TCS

TCS trendline support provides good risk-rewardOne can go long with the stop loss mentioned in the chart

Rising Wedge pattern in weekly chart of TCSProbable scenario:- The rising wedge pattern is a probable sign of a strong bearish movement. In the case of TCS, if the price doesn't hold the support line it might go bearish . If the price doesn't find immediate support while retracing it might go for a strong bearish move.
Alternate Scenario:- If the price breakouts the resistance level and holds that position for some period then the strong bullish trend might continue which is less probable to happen.
Probable scenario: Alternate Scenario = 70 : 30

TCS uptrend channel buy for next leg upTCS for july expiry could be between 3150 to 3300. Can be bought near 3150..!!

TCS_AT SUPPORTTCS might show upside move if it takes support of the trendline drawn on the chart.
(for educational purpose only)

Uptrend inevitable in TCSTCS will test S1 and then should give a upward trend.
Important resistance levels - 3288 and 3400.
PS: For educational purposes only.
***** Kindly consider following me for more analysis *****

TCSTCS - Cmp 3348
Possible breakout candidate. Looks good for long if sustains above 3340-3355 on closing basis for possible targets of 3475 and higher.

TCS TCS (D):- CMP 3217, LOOKS GOOD FOR 3400/3500++, Invalid BELOW 3150
1) RSI HIDDEN DIVERGENCE :)
2) Bullish Candlestick

TCS -Reversal TradeIF closes with a strong bullish candle. It would be a great RR trade. #Positional

TCS TRIPLE TOP PATTERN
A triple top is formed by three peaks moving into the same area, with pullbacks in between.
A triple top is considered complete, indicating a further price slide, once the price moves below pattern support.
A trader exits longs or enters shorts when the triple top completes.
If trading the pattern, a stop loss can be placed above resistance (peaks).
The estimated downside target for the pattern is the height of the pattern subtracted from the breakout point.
How a Triple Top Works
The triple top pattern occurs when the price of an asset creates three peaks at nearly the same price level. The area of the peaks is resistance. The pullbacks between the peaks are called the swing lows. After the third peak, if the price falls below the swing lows, the pattern is considered complete and traders watch for a further move to the downside.
The three consecutive peaks make the triple top visually similar to the head and shoulders pattern; however, in this case, the middle peak is nearly equal to the other peaks rather than being higher. The pattern is also similar to the double top pattern, when the price touches the resistance area twice, creating a pair of high points before falling.

TCS taken support at 3174 today on weekly chartAs per me, TCS has taken support at 3174 today and on this weekly chart, by the end of this week, hammer formation expected.
lets see and if not right this than, support will be near r4, which will be 3140+

TATA STEELTata Steel Double Top Pattern the Amazing Moment. if Tata Steel
break out this level and market stand in 1260 upside then we will be got 1300+ level few months
Tata Steel is poised for the next phase of growth even as it continues to stay the course on deleveraging.
Over the next five years, the average India capital expenditure is estimated at Rs 10,000-12,000 Crore per annum and that excludes potential acquisitions. As against a $1 billion annual debt reduction target, the company is likely to reduce gross debt by over $2 billion in FY22.
Koushik Chatterjee, executive director and chief financial officer, Tata Steel, told investors on Tuesday that the company would continue to deleverage and make its balance sheet stronger in order to position for the next phase of growth.
“This year, I can certainly say that it will be much more than our announced policy of $1 billion,” he said during the investor meet.
The investor presentation mentioned that among FY22 deleveraging priorities, over $2 billion gross debt reduction and Prioritising offshore debt pre-payments.
In the June quarter also, the company had made material repayments in the Singapore and European balance-sheets, said Chatterjee.

TCS is showing some crack todaySome serious selling is seen in NSE:TCS for the last few days. Specially on Friday, selling was seen with good volumes. Today selling could be due to dividends.

TCS near support zone-- good 15% upside potential >Currently forming a flat top pattern and support is only 1% away
>A buy position can be initiated for a target of 3700 in mid term


Accumulate TCS at highest RRRObservations from TCS Chart:
1. Formation of an ascending triangle
2. A reversal from lower line is hinted by RSI divergence under formation.
3. Currently at lower price which has high risk to reward ratio.
4. Accumulate upto 3165. Set SL below 3150. Target 3750+
Right information at right time is the key..!!

TCS is looking weak.If NSE:TCS gives closing below 50 DEMA then can show 3180 levels soon. It has broken it's support around 3225. Let's see what happens in the second half session.

TCS declared results todayNSE:TCS has declared results today and came as per market's expectations. TCS is making higher lows that shows it's in uptrend. Some profit booking has been seen in the last few trading sessions though.

TCS Stock future prediction | Bearish IMPORTANT NOTE: Trade in 5 Min and 15 Min Time frame, the TradingView is not allowing to post in the smaller time frame and I'm not interested to buy premium plan so please trade as per given time frame and level and targets Thanks.
TCS Future trade analysis.
Buy at 3222, if it holds the level
And trying to move upside then enter
for targets 1 and 2
SELL BELOW 3222,
And wait for targets 1 and 2
DISCLAIMER:- I Am Not SEBI Registered Analyst or financial adviser.
All Post and Levels Posting Only For learning Purpose. Not Giving Any Recommendations For Trade. I'm Not Responsible For Your Any Kind Of Loss Or Profit. Before trading please consult with your financial advisor.
No Claim, All Rights Reserved.‼️

Bearish Engulfing TCS A bearish engulfing pattern is a technical chart pattern that signals lower prices to come. The pattern consists of an up (white or green) candlestick followed by a large down (black or red) candlestick that eclipses or "engulfs" the smaller up candle.
Bearish Engulfing Potential Sell Signal:
Three ways for selling using the Bearish Engulfing Pattern from most aggressive to most conservative:
1. A Aggressive trader might sell at the close of candle
2. If there is a substantial increase in volume that accompanies the large move downward in price, a trader might view this as an even stronger indication to sell. Also, a trader might sell after the Bearish Engulfing Pattern occurs; by waiting until the next candle to sell, a trader is trying to verify that the bearish reversal pattern is for real and was not just a one candle occurrence. In the chart of TCS, trader would probably entered after the Bearish Engulfing Pattern because the selling continued. Usually trader’s wait for other signals, such as a price break below the upward support line (see: Resistance), before entering a sell order. However, in the case of TCS in chart, the Bearish Engulfing Pattern occurred at the same time as the trendline break below support.
stay with me, learn with fun
mcpriceaction

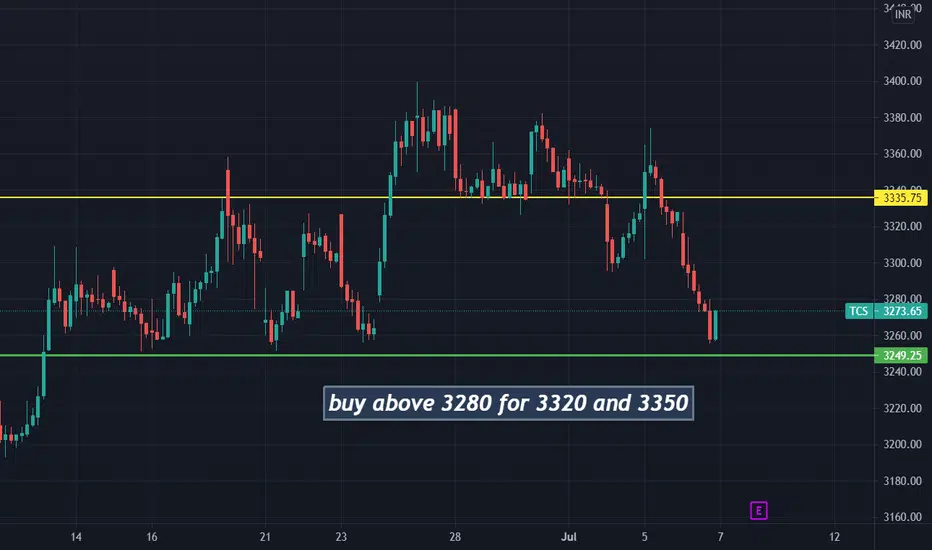
Buy TCS TARGET 3380Buy TCS target 3380 because it is on support it will jump back from support to resistance

TCS is still showing some profit booking today as wellProfit booking is seen in NSE:TCS today as well. It's been happening for the last 4-5 trading sessions.