Intraday levels - 03 June 2021 - Cup and Handle pattern
- Support and Resistance levels marked in chart
TCS

TCS Trade Setup 1st June !!TREND ANALYSIS & TRADE SETUP !
WAVE ANALYSIS !!
Follow Chart Instruction.
Do not be Hurry for entry.
Wait for Proper Entry Setup.
Buy/Sell with Best Risk Reward.
Educational Chart Only.
Wait for ENTRY CONFIRMATION !
Risk:Reward: 4-6 times.

#ONGC #TIDEWATER #OIL #IOC #HINDPETRO #BPCL #DIESEL #PETROL #IT#ONGC
NSE: ONGC
CMP 117.60
Target 130+
Time frame < 2 months
Factors:
Petroleum sector booming
Rising Volume with rising Prices.
Flag pattern breakout.
Pennant Pattern Breakout with Bullish Candle.
Retest Successful.
Higher Highs & Higher Lows.
Broken above RESISTANCE levels
Trading at SUPPORT levels
Fundamental are strong.
Risk Return Ratio is healthy.
And
Rising from Double Bottom Pattern to Flag Pattern forming
The stock has potential to go beyond 130 in longer time.
PEER COMPARISONS:
NSE: ONGC
NSE: TIDEWATER
NSE: IOC
NSE: OIL
NSE: HINDPETRO
NSE: BPCL
NSE: PETRONET
NSE: SUPPETRO
NSE: CHENNPETRO
NSE: RELIANCE
If you like my work KINDLY LIKE SHARE & FOLLOW this page for free Stock Recommendations.
With 💚 from Rachit Sethia

HCl Technology analysisLooking at the chart it is tarding exactly on its trendline it's 1st support is around 925 and the most strong support is 900,and talking about resistance it is at 950 which is also one of the pivot point,it may go till 965 and further 982


TCS View for LONGAs we can see TCS is in Triangle pattern
Will take the entry above 3146.00
For the targets of :-
Target 1 :- 3200
Target 2 :- 3300
Target 3 :- 3325
STOP LOSS :- 3103
Take Entries & Exit as per Price Action only
Always Follow Risk Reward Ratio & your Money Management
** Only for Educational Purposes
PLEASE DO LIKE , COMMENT & FOLLOW US


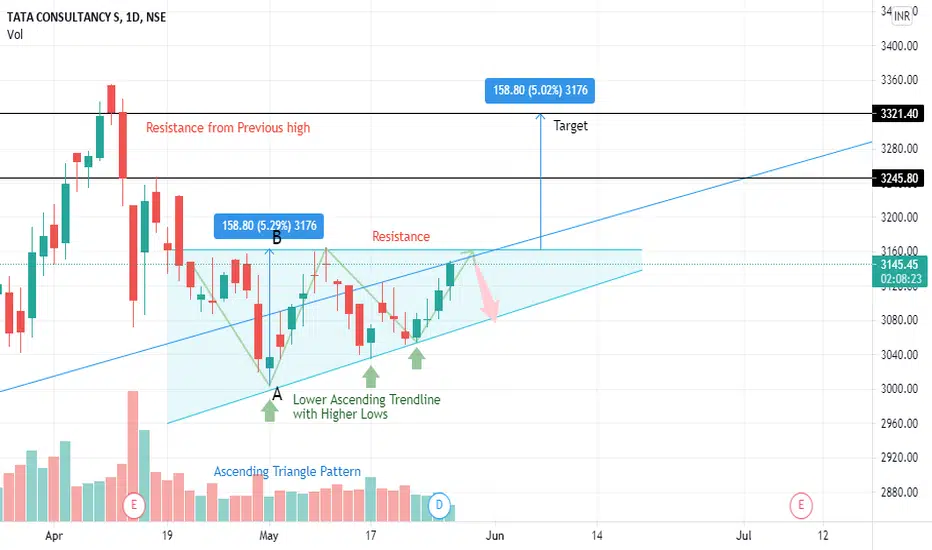
TCS Breakout with Ascending Triangle ?My idea about TCS is clearly visible in Chart.
You can see a Ascending Triangle Pattern formation. Its mostly known for a Positive direction breakout.
We have a lower ascending trendline which is also acting as a support line. You can see Higher lows. Whenever there are higher lows we can say stock is in Up trend.
Upper horizontal trend line is resistance line, you can see the Flat Highs.
This two trend line forming a pattern known as Ascending Triangle Pattern.
So what to do now? Where to take entry?
The answer is simple. We will wait for a breakout. Whenever the stock price breaks the Upper horizontal trendline (resistance). We can take entry after a confirmation candle. For short term or positional as per your preference. But my recommendation is for long term.
Technically you can find your target with a simple calculation.
See in chart, I have measured the distance from resistance to first Low.
A - B = 158.80
Add 158.80 in resistance line price
158.80 + 3164.20 = 3323
We can expect Target near 3323. also you can see this target is near to the resistance from previous highs.
Stock is IT sector leader. Fundamentally strong. Performance is consistently increasing. Nifty 50 stock. Also listed in foreign market.
Can we expect a Bull run ? What do you think ?
This is my personal view. I am neither sebi registered nor stock market expert. You do your own analysis. I am not responsible for any Profit or Loss.


TCS #StockMarket #StocksToBuy #StocksToWatch #stockmarkets watcTCS at Triangle BO, if BO success good to enter as per levels
Keep TSL

TCS bullish breakout first target 3145. second target 3218TCS bullish breakout first target 3145. second target 3218


[Positional] TCS : Triangle BreakoutAs per chart
Long with the Short line as SL.
Short with the Long line as SL.
DD Advised.


TCS for Tuesday (25th may)On 15 min tf, tcs is forming a symmetrical triangle pattern.
break on either side can give a good move
wait for retest
keep a target of 0.8 or 1% of the stock


TCS Pennant formation Pennant formation with lower volume. Breakout with higher volume could bring out a nice move upwards.
Follow for more


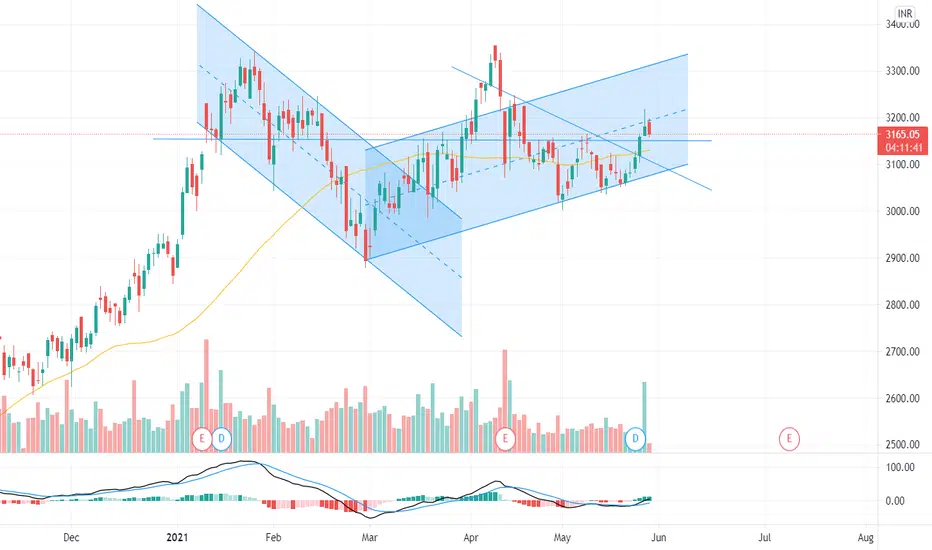
IT Giant looking weakTCS has given a breakdown from bearish channel and Looking weak. Important levels mentioned on chart.
