WIPRO 1D Time framw📈 Price Action
Previous Close: ₹255.75
Today's Close: ₹256.50
Daily Range: ₹253.00 – ₹257.00
Volume: 804,499 shares (significantly higher than the 50-day average of 369,496 shares)
52-Week Range: ₹228.00 – ₹324.55
🔧 Technical Indicators
Relative Strength Index (RSI): 63.59 — Indicates bullish momentum.
MACD: Positive — Suggests upward trend.
Moving Averages:
5-day MA: ₹254.50
50-day MA: ₹249.00
200-day MA: ₹265.00
Trend: Bullish, as the stock is trading above short-term moving averages.
Stochastic Oscillator: 76.47% — Indicates overbought conditions, suggesting potential for a pullback.
Average True Range (ATR): ₹0.05 — Indicates low volatility.
📊 Support & Resistance Levels
Immediate Support: ₹253.00
Immediate Resistance: ₹257.00
Pivot Point: ₹255.00
🧠 Trend Analysis
Trend: Bullish
Momentum: Positive
Volatility: Low
Summary: Wipro's stock is exhibiting a bullish trend with positive momentum. The current overbought condition, as indicated by the stochastic oscillator, suggests that the stock may experience a short-term pullback before continuing its upward trajectory. Traders should monitor the support and resistance levels for potential entry and exit points.
TCS

SENSEX 1D Time frame📊 Current Snapshot
Current Price: ₹81,571
Day’s Range: ₹81,500 – ₹81,600
Previous Close: ₹81,425.15
Opening Price: ₹81,504.36
Volume: Moderate
📈 Trend & Indicators
Trend: Neutral to mildly bullish; trading near short-term resistance.
RSI (14): Neutral zone.
MACD: Positive → indicating mild bullish momentum.
Moving Averages: Short-term averages indicate neutral to slightly bullish outlook.
🔮 Outlook
Bullish Scenario: Break above ₹81,700 with strong volume could target ₹81,900.
Bearish Scenario: Drop below ₹81,400 may lead to further decline toward ₹81,200.
Neutral Scenario: Consolidation between ₹81,400 – ₹81,700; breakout needed for directional move.
📌 Key Factors to Watch
Economic Indicators: Interest rates, inflation, and RBI policy updates.
Sector Performance: Trends in the IT and financial sectors.
Global Cues: Global market trends, US indices, crude oil, and currency movements.

BANKNIFTY 1D Time frameApologies for any confusion earlier. As of September 11, 2025, at 2:48 PM IST, the Nifty Bank (BANKNIFTY) index is trading at approximately ₹54,536.00 on the daily (1D) time frame.
The Economic Times
📊 Current Snapshot
Current Price: ₹54,681.00
Day’s Range: ₹54,402.40 – ₹54,733.90
Previous Close: ₹54,536.00
Opening Price: ₹54,413.05
Volume: Approximately 6.16 million shares
📈 Trend & Indicators
Trend: Neutral to mildly bullish; trading near short-term resistance.
RSI (14): Neutral zone.
MACD: Positive → indicating mild bullish momentum.
Moving Averages: Short-term averages indicate neutral to slightly bullish outlook.
🔮 Outlook
Bullish Scenario: Break above ₹54,800 with strong volume could target ₹55,000.
Bearish Scenario: Drop below ₹54,400 may lead to further decline toward ₹54,200.
Neutral Scenario: Consolidation between ₹54,400 – ₹54,800; breakout needed for directional move.
📌 Key Factors to Watch
Economic Indicators: Interest rates, inflation, and RBI policy updates.
Sector Performance: Trends in the banking sector.
Global Cues: Global market trends, US indices, crude oil, and currency movements.

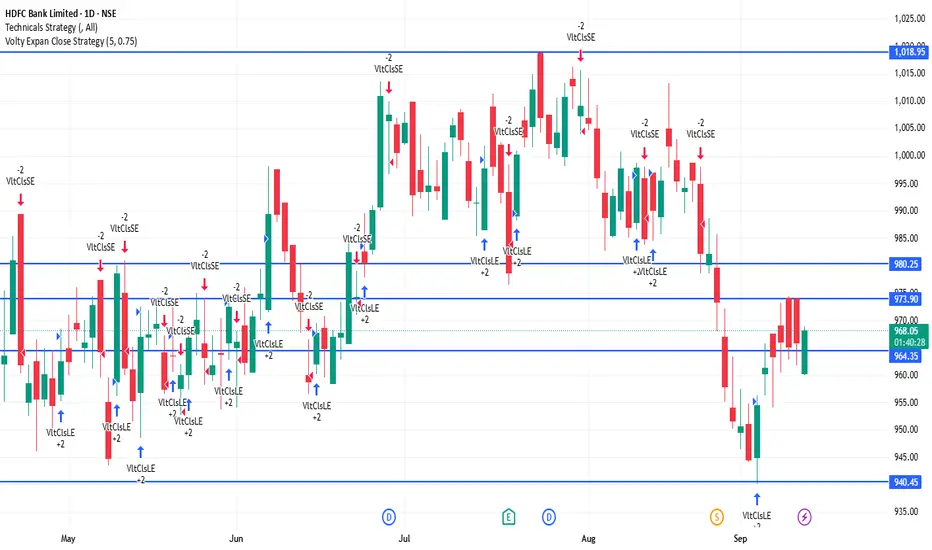
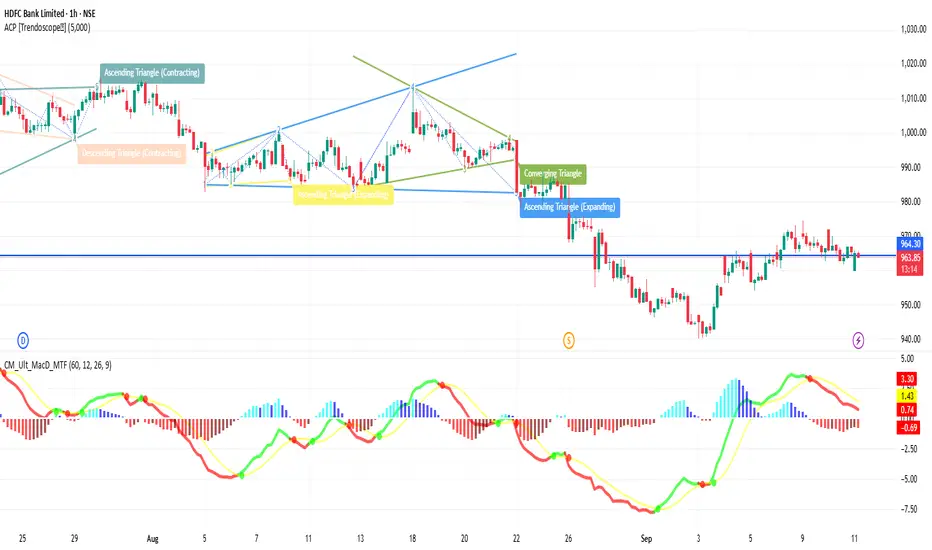
HDFCBANK 4Hour Time frame 📊 Current Snapshot
Current Price: ₹967.95
Day’s Range: ₹959.90 – ₹968.90
Previous Close: ₹965.90
Opening Price (4H): ₹960.30
Volume: Approximately 7.2 million shares
📈 Trend & Indicators
Trend: Neutral to mildly bullish; trading near short-term resistance.
RSI (14): Neutral zone.
MACD: Positive → indicating mild bullish momentum.
Moving Averages: Short-term averages indicate neutral to slightly bullish outlook.
🔮 Outlook
Bullish Scenario: Break above ₹968.90 with strong volume could target ₹975.00.
Bearish Scenario: Drop below ₹960.00 may lead to further decline toward ₹950.00.
Neutral Scenario: Consolidation between ₹960.00 – ₹968.90; breakout needed for directional move.
📌 Key Factors to Watch
Economic Indicators: Interest rates, inflation, and RBI policy updates.
Sector Performance: Trends in the banking sector.
Global Cues: Global market trends, US indices, crude oil, and currency movements.
BANKNIFTY 4Hour Time frame📊 Current Snapshot
Current Price: ₹54,731
Day’s Range (4H): ₹54,600 – ₹54,800
Previous Close: ₹54,228
Opening Price (4H): ₹54,350
Volume: Moderate
🔑 Key Support & Resistance Levels
Immediate Support: ₹54,650
Next Support: ₹54,600
Immediate Resistance: ₹54,800
Next Resistance: ₹54,900
📈 Trend & Indicators
Trend: Mildly bullish; trading near short-term resistance.
RSI (14): ~64 – Neutral to slightly bullish.
MACD: Positive → indicates bullish momentum.
Moving Averages: Short-term averages indicate bullish bias.
🔮 Outlook
Bullish Scenario: Sustained move above ₹54,800 may push toward ₹54,900–₹55,000.
Bearish Scenario: Drop below ₹54,650 could lead to retracement toward ₹54,600.
Neutral Scenario: Consolidation between ₹54,650 – ₹54,800; breakout needed for directional move.
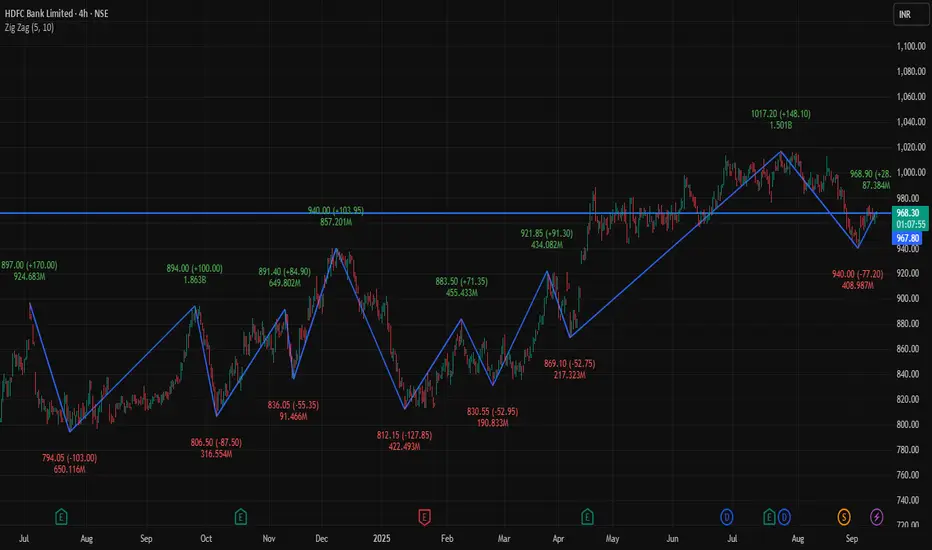
HDFCBANK 1D Time frameCurrent Price Action
HDFCBANK is trading around ₹962–968.
Day’s low is near ₹960 and high is around ₹978.
The stock is consolidating in a tight range.
⚖️ Key Levels
Immediate Resistance: ₹968 – ₹970
Next Resistance: ₹975 – ₹980
Immediate Support: ₹960
Strong Support: ₹950 – ₹955
📊 Indicators
Moving Averages: Price is below the 50-day MA (short-term weakness) but above the 200-day MA (long-term trend still intact).
RSI (14-day): Around 40–45 → neutral to slightly weak momentum.
MACD: Negative bias, showing limited upside strength.
📈 Outlook
If HDFCBANK stays above ₹960, a bounce toward ₹970 – ₹975 is possible.
A breakout above ₹975 – ₹980 could turn the trend stronger.
If the stock slips below ₹955 – ₹950, it may head lower toward ₹940 – ₹935.
Current bias: Neutral to slightly bearish until price breaks above resistance.
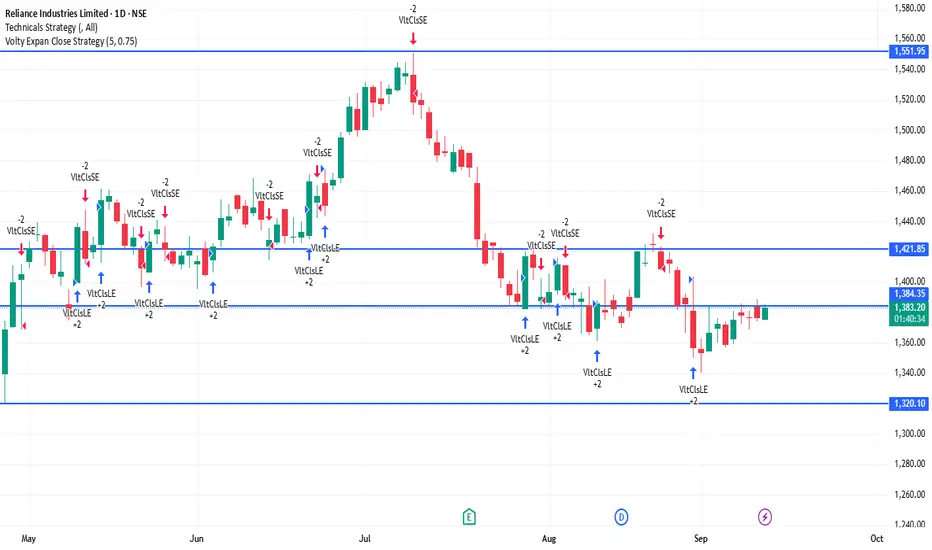
RELIANCE 1D Time frameCurrent Price Action
Reliance is trading around ₹1,384.
Day’s low is near ₹1,375 and high is near ₹1,385.
Price is consolidating in a narrow band after recent gains.
⚖️ Key Levels
Immediate Resistance: ₹1,385 – ₹1,390
Next Resistance: ₹1,400 – ₹1,410
Immediate Support: ₹1,375
Strong Support: ₹1,360 – ₹1,350
📊 Indicators
Moving Averages: Short- and medium-term averages remain bullish, confirming uptrend strength.
RSI (14-day): Around 58–60 → showing bullish momentum, still not overbought.
MACD: Positive crossover → indicates bullish bias.
📈 Outlook
As long as Reliance holds above ₹1,375, the bias stays bullish.
A breakout above ₹1,390 – ₹1,400 can push the stock toward ₹1,410 – ₹1,420.
If it falls below ₹1,375, it could slip toward ₹1,360 – ₹1,350.
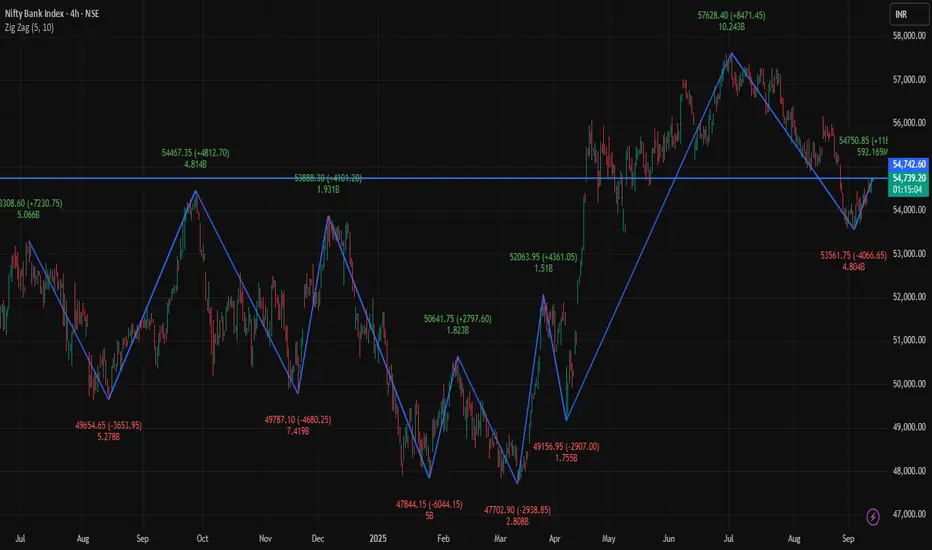
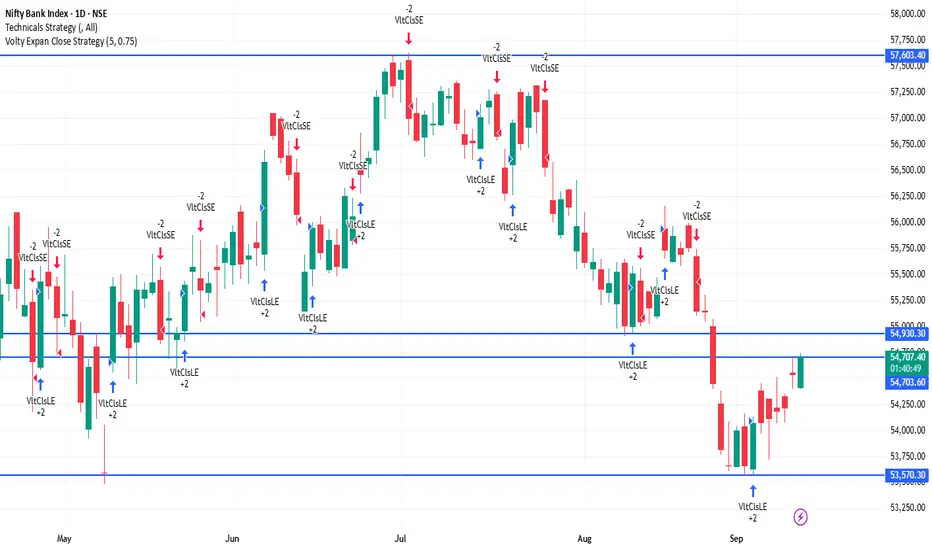
BANKNIFTY 1D Time frame📍 Current Price Action
BankNIFTY is trading around 54,680 – 54,817.
Day’s low is near 54,400, and high is near 54,825.
Index is consolidating near the upper end of the recent range.
⚖️ Key Levels
Immediate Resistance: 54,700 – 55,000
Next Resistance: 55,300 – 55,500
Immediate Support: 54,400
Strong Support: 53,800 – 53,500
📊 Indicators
Moving Averages: Short-, medium-, and long-term averages remain in a bullish alignment → trend still positive.
RSI (14-day): Around 60-65 → showing bullish momentum, but not extreme.
MACD: Still positive, indicating bullish momentum, though strength is flattening.
📈 Outlook
As long as BankNIFTY stays above 54,400, the bias remains bullish to neutral.
A breakout above 55,000 could push the index toward 55,300 – 55,500.
A breakdown below 54,400 could trigger a slide toward 53,800 – 53,500.
SBIN 1H Time framePrice Snapshot
Current price around : ~ ₹818
52-week high/low: ~ ₹875 / ₹680
Recent price action: modest upside from support, but resistance overhead
📈 Indicators & Momentum (Hourly Approx)
Moving Averages (short-period) are just below current price → giving support
Medium/longer hourly MAs (20-50 hr) are above → resistance zones
RSI (1-hour): neutral to slightly bullish, not overbought yet
Momentum indicators show mild strength but not a breakout — watching for volume to confirm
🧭 Short-Term Outlook
Bullish scenario: If SBI holds above ~₹820 and breaks past ~₹825-830, upward target could be ~₹840+
Bearish scenario: If it loses support around ~₹805-810, risk of pullback toward ~₹800 or below
Bias: Slightly bullish in the short term, provided support holds and resistance tests are successful

HDFCBANK 1H Time frameKey Price & Market Info
Current Price: ~ ₹960-965
52-Week Range: ~ ₹806 – ₹1,018
Daily Range (recent): roughly between ₹959 – ₹966
🔎 Technical Indicators & Momentum
RSI (14-hour): ~ 42-45 → Neutral to mildly weak
MACD (hourly estimates): Slightly negative → some bearish pressure
ADX (trend strength): Moderate (~20-25) → trend is present but not very strong
Moving Averages:
Short-term (5-10 hour) MAs seem to be acting as minor resistance/support zones near current price
Mid-term MAs (50-hour) are above the price → resistance upward
Long-term support (200-hour MA) is well below current price → that gives some downside cushion
🔧 Support & Resistance (1-Hour)
Immediate Resistance: ~ ₹970-975
Near Resistance Zone: ~ ₹985-₹990
Support Levels: ~ ₹950-₹955 first, then ~₹940 if weakness increases
🧭 Short-Term Outlook
Bullish Case: If price breaks above ~₹970-975 with volume, upward move toward ~₹985+ might be possible.
Bearish Case: Failing resistance and dropping below ~₹950 might test lower support ~₹940.
Overall Bias: Slightly bearish to neutral—more inclined to expect consolidation or minor pullback unless strong upward catalyst appears.
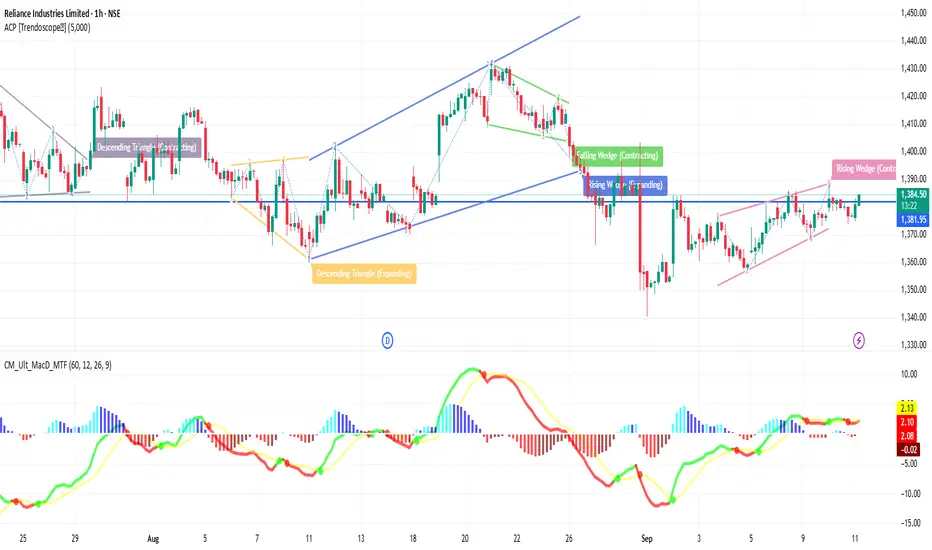
RELIANCE 1H Time framePrice Movement (1H Candles)
Reliance is trading around ₹1,381 – ₹1,383.
On the 1-hour chart, candles are showing sideways consolidation between ₹1,375 (support) and ₹1,385 (resistance).
This tells us that buyers and sellers are in balance, waiting for a breakout.
2️⃣ Support & Resistance Zones
Immediate Support: ~₹1,375 → If this breaks, price may slip toward ₹1,360.
Stronger Support: ~₹1,345 – ₹1,340 → A key zone where buyers may return strongly.
Immediate Resistance: ~₹1,385 → A breakout above can open the way to ₹1,395 – ₹1,400.
Major Resistance: ~₹1,415 – ₹1,420 → If crossed, trend becomes strongly bullish.
3️⃣ Indicators (1H View)
20 EMA: Very close to current price, showing consolidation.
50 EMA: Just below current levels, acting as dynamic support.
200 EMA: Much lower, confirming long-term uptrend is intact.
RSI: Neutral (around 50) → market is not overbought, not oversold.
MACD: Flat → no clear momentum yet, waiting for direction.
4️⃣ Trend Explanation
Right now, the 1-hour trend is neutral to mildly bullish.
If Reliance holds above ₹1,375 – ₹1,360, bulls remain in control.
A move above ₹1,385 with volume can trigger a rally toward ₹1,400+.
But if Reliance breaks below ₹1,360, weakness may appear, and the next fall could be toward ₹1,340.
5️⃣ Conclusion (1H Time Frame)
Sideways Phase: Reliance is consolidating in a narrow band.
Bullish Signal: Above ₹1,385 with good buying volume.
Bearish Signal: Below ₹1,375, deeper support around ₹1,360.
Traders should wait for a breakout or breakdown before taking big positions.
SENSEX 1H Time frameCurrent Snapshot
Sensex Last Price: around 81,425
Intraday High (1H): near 81,580
Intraday Low (1H): around
📈 Trend View (1H)
Above 81,580 → 82,000 = bullish momentum likely.
Below 81,225 → 81,000 = bearish sentiment can increase.
Staying between these = sideways consolidation.
📊 Trend & Bias
Above 81,600–82,000 → bullish breakout, upside momentum likely.
Below 81,000 → bearish pressure, possible drift toward 80,500.
As long as price holds higher lows on 1H candles, trend stays mildly positive.
⚠️ Risk Factors
Sudden global news or domestic policy updates may cause sharp reversals.
If volume is weak during up-moves, breakouts may fail.
Overbought conditions on momentum indicators (RSI/MACD) could slow the rally.

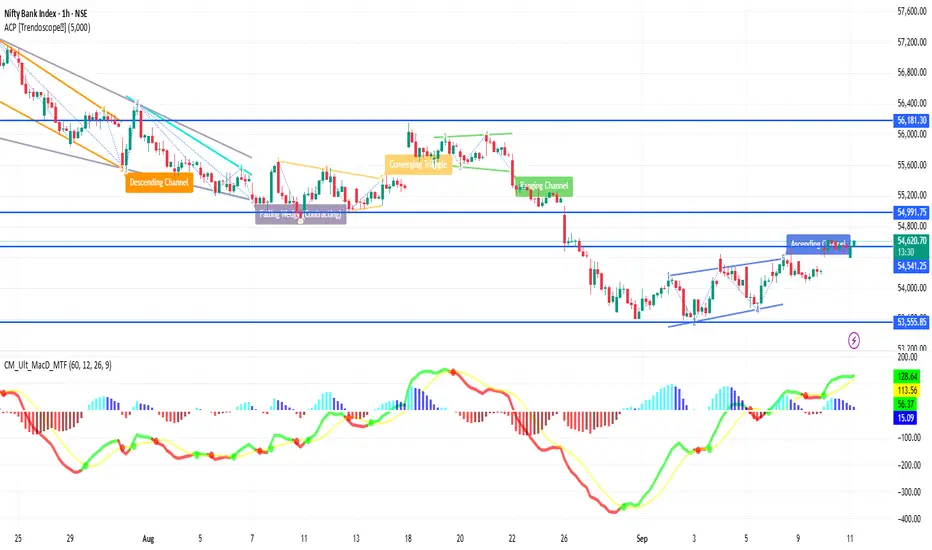
BANKNIFTY 1H Time frameBankNifty 1H Snapshot
Current Price: ~54,581
Recent Range: ~54,400 – 54,700
Bias: Slightly bullish, holding above short-term support
📈 Key Levels
Immediate Resistance: 54,650 – 54,700
Next Resistance: 54,800 → if broken, can open upside momentum
Immediate Support: 54,450
Deeper Support: 54,300 → then 54,000
🔎 Indicators (1-Hour)
RSI: Mid-60s → bullish but not yet extreme
MACD: Positive crossover → supports buying momentum
Stochastic: Near overbought → watch for minor pullback
🧭 Outlook
Bullish Case: Sustained above 54,600 → next push toward 54,700-54,800
Bearish Case: Slip below 54,450 → opens weakness toward 54,300
Overall Bias: Moderately bullish while holding above 54,450
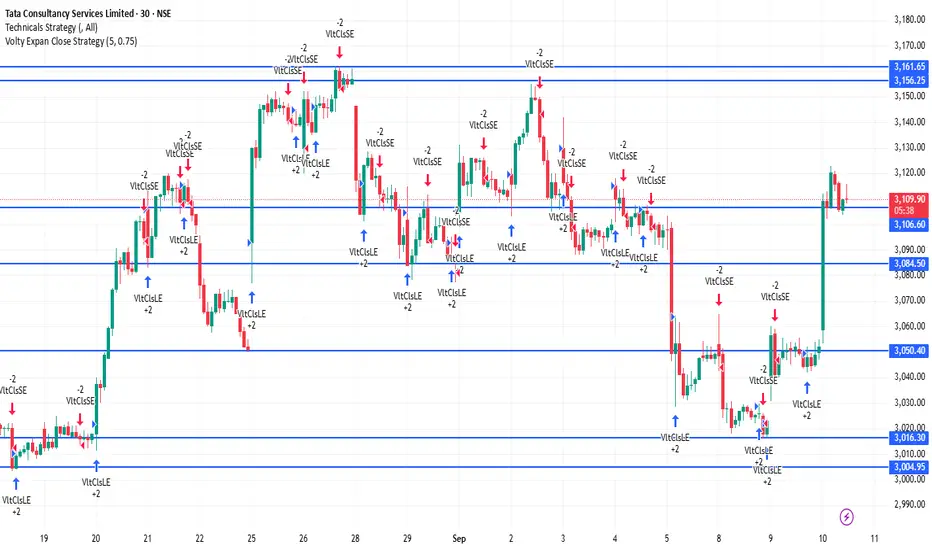
TCS 30Minutes Time frameTCS – 30-Minute Time Frame Important Levels (Current Estimate)
Support Zones
₹3,080 – ₹3,090 → Immediate intraday support
₹3,050 – ₹3,060 → Stronger support level where dip-buying may emerge
₹3,020 – ₹3,030 → Major support; a breakdown here may indicate intraday weakness
Resistance Zones
₹3,130 – ₹3,140 → Immediate intraday resistance
₹3,160 – ₹3,170 → Strong resistance zone; a breakout may extend upward momentum
₹3,200 – ₹3,210 → Major resistance; surpassing this can fuel a more sustained rally
Intraday Trend Outlook (30M Chart)
The trend appears mildly bullish as long as TCS holds above ₹3,080.
A clear move above ₹3,140 can open the path toward ₹3,160–₹3,200.
If it falls below ₹3,050, price may pull back toward ₹3,020, and a break under that could signal further downside.
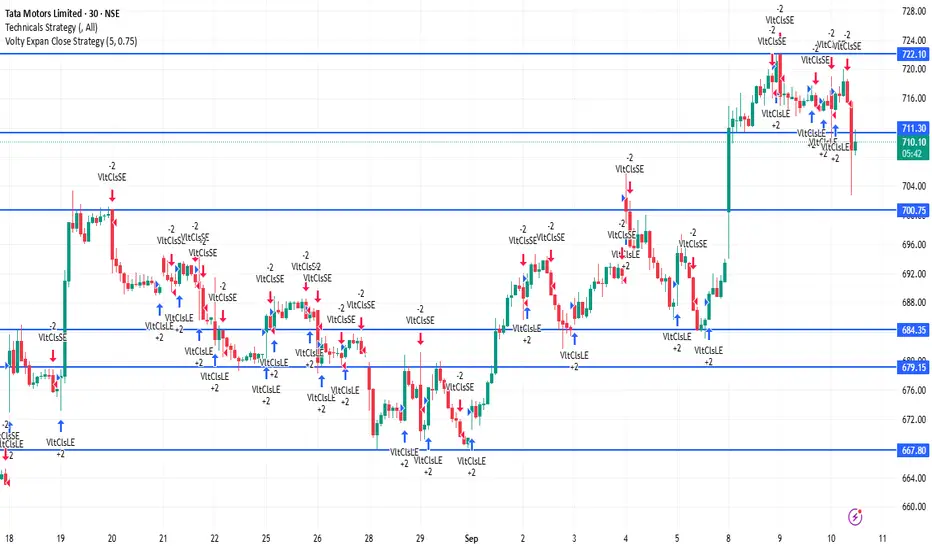
TATAMOTORS 30Minutes Time frame📊 Tata Motors – 30M Technical Levels
🔹 Support Zones
₹708 – ₹710 → Immediate intraday support
₹705 – ₹707 → Strong support zone
₹702 – ₹704 → Critical support; breakdown here can lead to further weakness
🔹 Resistance Zones
₹720 – ₹722 → First major resistance
₹724 – ₹726 → Strong supply zone
₹728 – ₹730 → Intraday breakout level; above this, momentum may pick up strongly
📈 30M Trend Outlook
Stock is sideways to mildly bullish on the 30-min chart.
Above ₹722 → Buyers gain control; possible upside to ₹726–₹730.
Below ₹708 → Weakness likely; price may slip to ₹705–₹702.
As long as it stays above ₹710, bias remains positive in the short term.
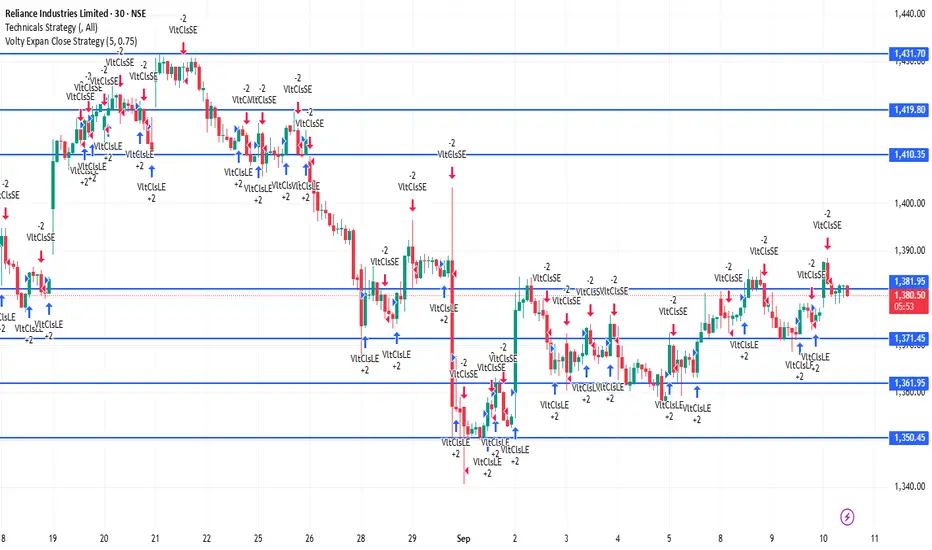
RELIANCE 30Mitunes Time frame📊 Reliance Industries (30M Chart)
Current Zone: Trading around ₹1,380–₹1,382.
🔻 Support Levels:
₹1,375 → Immediate intraday support
₹1,369–₹1,370 → Strong support zone
₹1,362–₹1,363 → Major support
🔺 Resistance Levels:
₹1,382–₹1,383 → Immediate hurdle
₹1,387–₹1,388 → Strong resistance zone
₹1,394–₹1,395 → Major resistance
📈 Trend Outlook (30M):
Above ₹1,383 → Momentum stays bullish, price may push toward ₹1,388–₹1,395.
Between ₹1,369–₹1,382 → Neutral to slightly bullish consolidation zone.
Below ₹1,369 → Weakness may drag price toward ₹1,363 or lower.
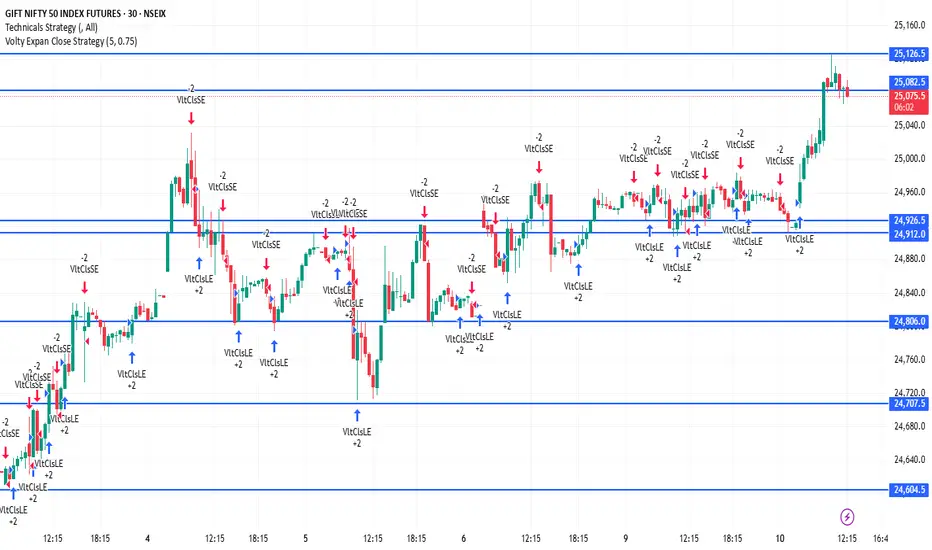
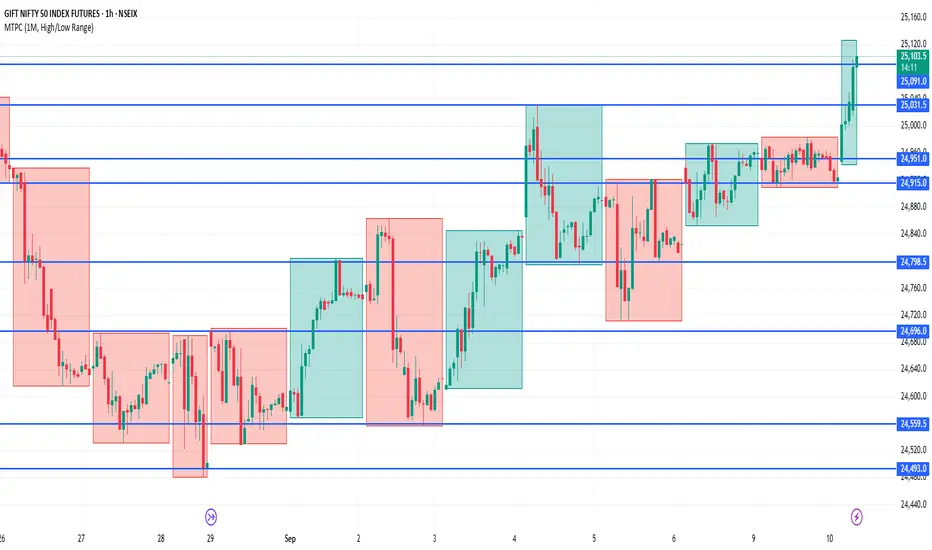
NIFTY1! 30Minutes Time frame📊 NIFTY1! – 30-Minute Timeframe (Current)
Current Price Zone: Approximately 25,092
🔻 Support Levels:
25,060 – Immediate support
25,020 – Stronger support zone
24,980 – Major support; breakdown here may lead to further weakness
🔺 Resistance Levels:
25,130 – Immediate resistance
25,180 – Strong resistance zone
25,220 – Major resistance; breakout above this level may signal bullish momentum
📈 Intraday Trend Outlook
Above 25,130: Bullish momentum likely; potential upside toward 25,180–25,220.
Between 25,060 – 25,130: Neutral to slightly bullish consolidation zone.
Below 25,060: Weakness may develop; potential slide toward 25,020–24,980.
NIFTY1!📍 NIFTY1! – 1H Key Levels
🔹 Support Zones
22,450 – 22,500 → Immediate intraday support
22,350 – 22,400 → Stronger support, buyers likely active here
22,200 – 22,250 → Major support zone, breakdown can invite selling pressure
🔹 Resistance Zones
22,650 – 22,700 → Immediate resistance on 1H chart
22,800 – 22,850 → Strong resistance area, breakout may fuel rally
23,000 → Psychological and major resistance zone
⚖️ Quick Summary
Above 22,700, momentum may push Nifty Futures towards 22,850 – 23,000.
Below 22,450, weakness could drag price back to 22,350 – 22,200.
Current 1H trend bias is mildly bullish, but range-bound moves are possible between 22,450 – 22,700 before a breakout.
BTCUSD📍 BTCUSD – 1H Key Levels
🔹 Support Zones
$55,200 – $55,500 → Immediate intraday support
$54,500 – $54,800 → Strong support zone, buyers likely to defend here
$53,800 – $54,000 → Major support, breakdown here could trigger deeper correction
🔹 Resistance Zones
$56,800 – $57,000 → Immediate 1H resistance
$57,800 – $58,200 → Strong resistance, breakout can fuel further upside
$59,000 – $59,500 → Major resistance, likely to act as a supply zone
⚖️ Quick Summary
As long as BTCUSD trades above $55,500, short-term bias remains bullish.
Breakout above $57,000 may push price towards $58,200 – $59,500.
Breakdown below $54,800 may drag price back towards $54,000 – $53,800.
Current 1H bias: Range-bound to bullish, waiting for a breakout from $55,500 – $57,000 zone.

Options Watchlist — An Educational View of OI & Price Action________________________________________
📊 Options OI Trade Outlook — Bearish Setups Only
“This analysis is shared purely for educational purposes and market awareness — not a trading recommendation.”
(Educational Purpose | Not Financial Advice | SEBI Compliant)
Hello Traders 👋,
Here are 4 Bearish option setups based on today’s OI + Price Action + IV + Greeks study.
This is strictly for learning and educational purposes.
________________________________________
🔴 1. TCS 3200 PUT
LTP: 118.15
Sentiment: Bearish | Trend: Down | Strength: 5/5 (Strong)
IV: 17.7 | Delta: -0.63 | Theta: -0.93 | Vega: 3.5
Buildup: Long Build-up
Why?
3200 PE shows a Long Build-up with price up 40.4% and OI up 33.6%, confirming strong bearish positioning.
Volume surged +65%, showing active participation. IV eased (-5.4%), keeping premiums cheaper. Delta -0.63 signals high sensitivity to downside moves.
________________________________________
🔴 2. SBIN 820 PUT
LTP: 21.65
Sentiment: Bearish | Trend: Down | Strength: 5/5 (Strong)
IV: 14.8 | Delta: -0.56 | Theta: -0.31 | Vega: 0.95
Buildup: Long Build-up
Why?
820 PE reflects a Long Build-up with price rising 20.6% and OI also increasing — a textbook bearish confirmation.
Low IV (14.8) makes premiums attractive. Delta -0.56 shows quick reactivity to price moves.
________________________________________
🔴 3. INFY 1520 PUT
LTP: 42.80
Sentiment: Bearish | Trend: Down | Strength: 5/5 (Strong)
IV: 20.8 | Delta: -0.51 | Theta: -0.63 | Vega: 1.79
Buildup: Long Build-up
Why?
1520 PE shows heavy Long Build-up, with price up 36.5% and OI exploding 106%.
Volume spiked strongly, reflecting aggressive bearish positioning. IV is moderate (20.8), while Delta -0.51 indicates solid responsiveness to further downside.
________________________________________
🔴 4. LT 3600 PUT
LTP: 81.0
Sentiment: Bearish | Trend: Down | Strength: 2.5/5 (Moderate)
IV: 16.9 | Delta: -0.50 | Theta: -1.58 | Vega: 4.26
Buildup: Short Build-up
Why?
3600 PE shows a Short Build-up, with price falling 10.3% while OI rose 41%, pointing to fresh shorts.
Volume surged +29%, confirming activity. IV is steady at 16.9, and Delta -0.50 indicates balanced downside exposure.
________________________________________
⚠️ Disclaimer – Please Read Carefully
The information shared here is meant purely for learning and awareness.
It is not a buy or sell recommendation and should not be taken as investment advice.
📌 I am not a SEBI-registered investment advisor.
📌 All views expressed are based on personal study, chart patterns, and publicly available data.
📌 Trading — whether in stocks or options — carries risk. Markets can move unexpectedly, and losses can exceed capital.
📌 Past setups do not guarantee future outcomes.
👉 Beginners: use this to learn market behavior, practice with paper trades before risking money.
👉 Experienced traders: apply your own risk management, sizing, and strategy filters.
👉 Always consult a SEBI-registered financial advisor before real trades.
By engaging with this content, you acknowledge full responsibility for your own trading and investments.
________________________________________
💬 Found this useful?
🔼 Boost this post to help more traders learn.
✍️ Share your thoughts/setups in comments — let’s grow together.
🔁 Share with fellow traders & learners.
👉 “Follow for more clean, structured breakdowns with discipline at the core.”
🚀 Stay Calm. Stay Clean. Trade With Patience.
Trade Smart | Learn Zones | Be Self-Reliant 📊
________________________________________
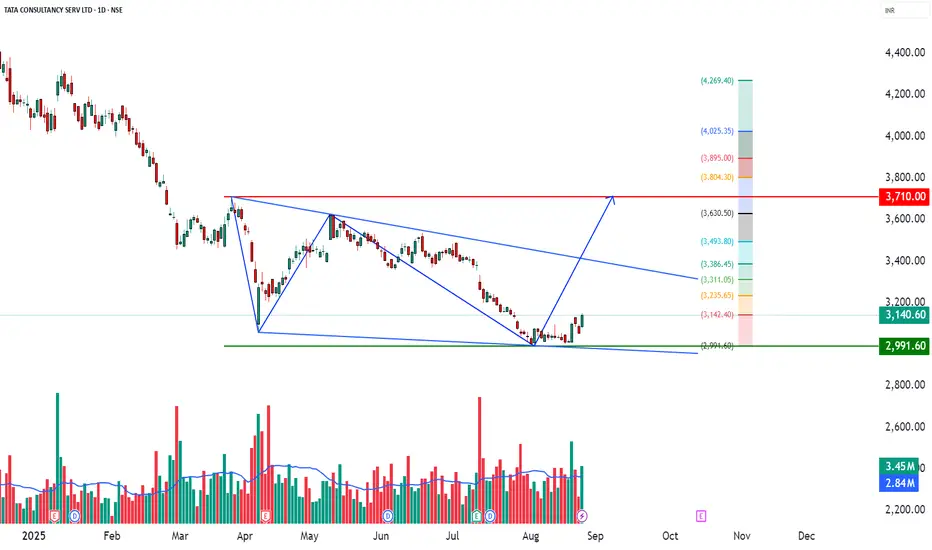
TCS – upport Bounce with Volume Confirmation📊 TCS – Technical & Educational Snapshot
Ticker: NSE:TCS | Sector: 💻 IT Services
CMP: ₹3,140.60 ▲ (+2.84% | 26 Aug 2025)
Learning Bias (for study purpose): ⭐⭐⭐ (Cautiously Bullish)
Pattern Observed: 📈 Support Bounce with Volume Confirmation
📰 Sentiment Analysis
👉 Overall Sentiment: Moderately Positive ✅
Bullish Drivers:
• Bounce from strong support near ₹3,000 with bullish candle & above-avg volume
• RSI breakout + Bollinger Band expansion → fresh buying interest
• Publicly available analyst reports indicate average estimates around ₹3,725; strong bullish case highlighted up to ₹4,610
• IT sector optimism for H2 FY26 earnings recovery
Risks (Bearish Case):
• Broader trend still marked Downtrend ⚠️
• Stochastic at 92 → overbought in short-term
• Employee layoffs & union protests (~12K–30K) may dampen sentiment
• Failure to hold ₹3,047 (support) could trigger deeper correction
Short-term Outlook: Upside momentum possible towards ₹3,160–3,200, but resistance supply zone must be watched.
Long-term Outlook: Positive — strong fundamentals, debt-free balance sheet, consistent dividends, and sector recovery cues.
📊 Technical Snapshot
TCS has formed a support bounce near the ₹3,000 bottom range, supported by a strong bullish candle and above-average volume.
Indicators: MACD bullish on daily/weekly, neutral-to-bearish on monthly.
RSI ~54 → healthy momentum without being overheated.
Trend direction still tagged as Downtrend, hence positional caution is advised.
📊 Volume Check
🔹 Current Volume: 3.45M
🔹 20 SMA Volume: 2.84M ✅
💥 Above-average participation → validates breakout reliability.
💡 Interpretation: Stronger demand from institutions/traders supporting price action.
💡 Learnings
Support bounces near psychological zones (₹3,000 in this case) often attract buying interest.
When combined with RSI breakouts, Bollinger Band expansion, and volume confirmation, the setup becomes more reliable.
However, overbought stochastic warns of possible near-term pullbacks — hence, stop-loss discipline is key.
📌 Key Levels
Resistance: 3,169 | 3,198 | 3,244
Support: 3,094 | 3,048 | 3,019
Fibonacci Reference Levels: 2,991 | 3,142 | 3,235 | 3,311 | 3,386 | 3,494 | 3,631
🎯 STWP Learning Reference
• Observed bounce zone: ~₹3,152
• Key support level: ~₹3,047
• Upside reference zones (if momentum continues): 3,200 | 3,244 | 3,310
• Pullback watch zone: 3,048–3,095
• Invalidation reference: Below 2,991 → momentum weakens
⚠️ Disclaimer – Please Read Carefully
This post is shared only for educational and informational purposes. It is not investment advice or a recommendation to buy/sell any security. I am not a SEBI-registered investment advisor. Please do your own research or consult a SEBI-registered advisor before making trading or investment decisions.
Trading and investing involve risk. Past performance or past setups do not guarantee future results. Always use stop-loss, proper position sizing, and risk management.
💬 Found this useful?
🔼 Boost this post to help more traders discover clean setups.
✍️ Share your thoughts, setups, or questions in the comments — let’s learn together.
🔁 Repost to spread awareness among traders & beginners.
✅ Follow simpletradewithpatience for clean charts, price action insights & beginner-friendly setups.
🚀 Stay Calm. Stay Clean. Trade With Patience.
Trade Smart | Learn Zones | Be Self-Reliant 📊
BTCUSD 4 Hours View Support Zones & Turning Points
** ~$115,000 Pivot Zone**
A consolidation area around $115,000 (± $600) acts as a short-term support base and momentum gauge.
~$117,430 (4H MA50)
The 50-period moving average on the 4H chart sits near $117,430, serving as a dynamic support level.
Previous ATH zones ($110K–$112K)
These levels have historically flipped as support after bullish retreats.
Resistance & Overhead Supply
$120,000 Psychological Barrier
A major round-number resistance that needs to be overcome for sustained bullish momentum.
$121K–$123K (Current and Previous ATH Range)
These levels remain formidable obstacles, marking the highest recent peaks.
$124,500 Zone
The recent all-time high, now under challenging supply and selling pressure.
Elliott Wave & Retracement Support
~$118,657 (38.2% Fibonacci retracement)
This level aligns with the corrective wave (Wave IV) in the Elliott Wave count, suggesting a solid bounce zone for potential Wave V continuation.

TCS may drip down in the coming week?In the current chart pattern, TCS seems to be on the border of completing its minute wave 4 and may see a fall in the coming days to complete its wave 5.
