Bullish Flag pattern in TCSOn 25th Sept 2020, TCS made a good bullish rally from 2368 to 2433. And consolidated in the range 2398-2436 forming a Bullish flag pattern.
Also in the 1Day chart, there is a Bullish Harami pattern which supports the possible bullish run on upcoming days.
TCS

GLORY OF CHART READING ON TCSPerfect trade set up example gone in
near past i am posting for
all new and experience traders
that spotting pattern on chart is
always helpful to float
in the share market.
Here Perfect breakout of descending triangle
break out and result is
all clear almost 250 points
SO KEEP ON LEARNING
STAY ON mcpriceaction
comments are welcome

TCS The Perfect Time to Book your Profits!!!
Upward Impulse complete and the correction forming is a Fat Correction where Wave A is complete B is almost complete;
Hence Wave C is yet to start and this is going to be a downward Impulse with 5 Waves and this correction ca retrace the Previous Impulse as much as 100% as per the rule of the Elliott Wave Theory;
So this is the time to book your profits;

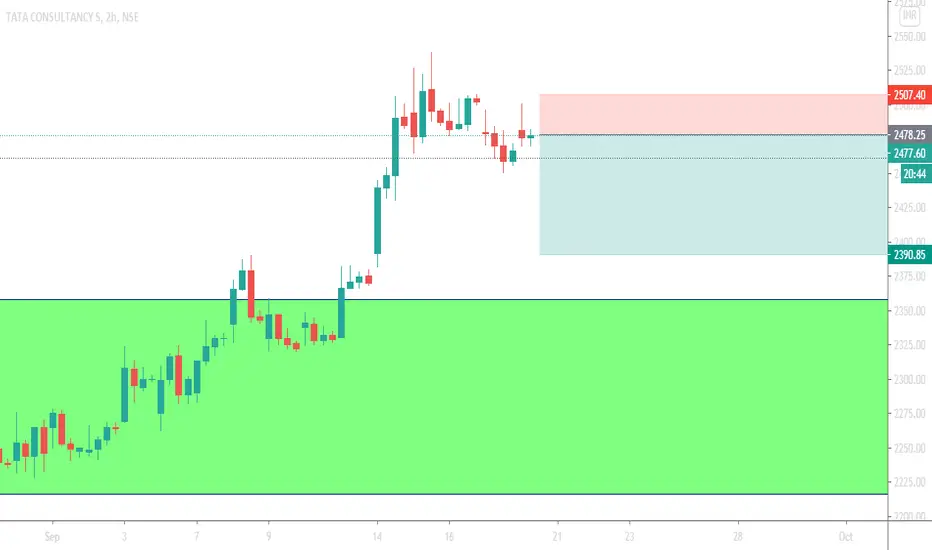
TCS Short TradePitchfork resistance
Targeting at least a 100 point downmove (50%-61% fib retracement)
Will book at 2390 ideally
Market are volatile however keep your risk appetite in mind. Just learning :)


TCS is Making Descending Triangle Pattern (Breakout Trade)Tata Consultancy Services Limited : Information Technology Consulting Company ( NSE:TCS ) is Making Descending Triangle Pattern (PATTERN BREAKOUT TRADE).
This can become a very good trade for INTRADAY traders.
Target + StopLoss: There is no target here. You keep the first target as much as the StopLoss you put. And the StopLoss will be the Low/High of the candle that broke this pattern. Or Low/High swing backward inside the pattern.
And as soon as you get a profit of 0.50% of your target, you will trail your StopLoss and bring it to the entry point. And as soon as your first target is hit, you will release half of your total quantity and continue to trail your StopLoss above the last swing Low/High.
Target and StopLoss are never already fixed in the chart pattern.
Thank you.
You always have to trade only by money management, position sizing, StopLoss trailing. This is the way to stay in profit.
Chart Published By Ravinder Sharma

TCS : Long SetupNSE:TCS
Hi Traders,
TCS remained range-bound throughout month and it has started moving in upward direction with upward price channel.
Entry and target level on chart.
**********************************************************************************************************************************
If it is helpful for you, please show your support and hit the LIKE button.
Provide some feedback below in the comment!
This would give us encouragement to keep sharing our ideas here on this platform.
###Learn To Earn###
* This analysis is educational/learning purpose only.
* Trade at your own risk.
Trade well,
**********************************************************************************************************************************

TCSTCS:- supper bullish upward channel follow buy zone 2100/2300 for target 2600₹ with sl 2180 clbs
#Disclaimer:-I just shared view for only educational purpose.

TCS in Correction Expecting a drop from 2500-2520; need to look for further confirmation. If rejects supports finds at 2250-2300 zone for next few trading sessions.

TCS - Rounding Bottom - May turn into Cup and Handle TCS has steadily formed Rounded bottom. However, it is tilted upward. I am unsure whether this still can be considered as an acceptable Rounding Bottom. Can someone please validate?

TCS seems to be bullish for next trading sessionHolding support at 2440; finds next resistance at 2510-2520, shorting only below support ,if only breaks with strong momentum in price.

BIG breakout in IT sector on weekly timeframe , big breakout on decade long trendline happened few weeks ago and its sustaining . so, strong possibilty of multiyear bull rally in stocks


UPTREND DOW THEORY IN TCS SPOTTCS SPOT is in strong uptrend. If this holds present support zone. It can rally up to 2450++.
View negated if create new LOWER LOW on Day Closing Basis.

Pattern formed at long time resistance 2300. Price at resistance levels 2300 and forming ascending triangle pattern. Expecting upside movement after breaking 2300 levels. Wait for it.


TCS LONGThe price has formed a bullish triangle pattern, and it seems like this may provide a good long opportunity.
Wait for a breakout above the hypotenuse of the triangle to go long. The target for the trade will be the previous high point @2357.
SL @ 2230.

