TCS at Support: Breakdown Fear or Bounce Setup?📊 Tata Consultancy Services Limited – 1H Technical Analysis
Timeframe: 1-Hour
Trend Structure: Rising channel (higher highs & higher lows)
Current Phase: ABC corrective pullback within an uptrend
CMP Zone: ~₹3,160
🔍 Big Picture Structure (Context First)
TCS is trading inside a well-defined rising channel, which tells us:
Institutions are accumulating on dips
Pullbacks are corrective, not impulsive
Trend strength remains intact as long as the channel holds
The recent decline is forming an ABC correction within this channel:
Wave (a): First profit-booking leg
Wave (b): Pullback rally (short covering)
Wave (c): Final emotional dip → testing demand
📘 In strong trends, Wave-C often marks the “last shakeout” before continuation.
🟩 Buying Zone: ₹3,155 – ₹3,181 (High-Probability Area)
🧠 Why this zone can attract buyers (Trading Psychology):
This area aligns with:
Channel support
Prior breakout memory
Wave-C completion expectations
Swing traders who missed the rally are waiting here
Existing longs defend this zone to protect trend structure
Shorts start booking profits after extended downside
👉 Result: Demand + short covering = bounce probability
📌 This is why it’s marked as a buying / accumulation zone, not a blind entry.
🔑 Key Levels & Why Price Reacts There
🟢 Wave-C Completion Zone: ~₹3,150–3,165
• Emotional selling exhausts
• Weak hands exit
• Smart money steps in
🧠 Markets usually turn when fear peaks, not when news feels good.
🔴 Invalidation / Stop-Loss: ₹3,105 (Hourly Close Below)
• Break of channel structure
• Buyers lose confidence
• Trend pauses or deepens into range
📉 Below this, psychology shifts from “buy dips” to “wait & watch”.
🔵 F&O Resistance Zone: ₹3,318 – ₹3,340
• Option writers active
• Profit booking by swing traders
• First supply reaction expected
📘 Derivative zones often cap the first rally.
🟢 Swing Target: ₹3,466
• Upper channel projection
• Momentum traders enter
• Short stop-losses fuel upside
📈 New highs revive optimism & momentum buying.
🟢 Bullish Scenario (Primary Probability)
If price:
Holds ₹3,155–3,181
Forms a base / higher low on 2H
Then:
Bounce toward ₹3,318–3,340
Acceptance above this zone → ₹3,466 swing target
Trend continuation within channel
📘 This is continuation, not reversal trading.
🔴 Bearish Risk Scenario (Secondary)
If price:
Closes below ₹3,105 (hourly)
Then:
Channel support breaks
Buyers step aside
Price may drift into deeper consolidation
📉 This reflects loss of momentum, not immediate trend reversal.
🎓 Educational Takeaways (Very Important)
Strong trends correct in ABC form, not straight lines
Best trades appear when fear meets structure
Channels work because institutions defend averages
Levels matter because traders remember pain & opportunity
🧠 Trading Psychology Behind This Chart
Zone Dominant Emotion
Upper channel Confidence / Greed
Pullback start Profit booking
Buying zone Fear vs Opportunity
Breakdown Doubt & Patience
New highs Momentum & FOMO
📘 Charts are visual representations of crowd emotion.
🔮 Price Outlook (Educational Projection)
Above ₹3,180: Bullish bias intact
Above ₹3,340: Momentum expansion
Target zone: ₹3,466
Below ₹3,105: Trend pause / deeper correction
🧾 Conclusion
TCS remains structurally bullish inside a rising channel.
The ₹3,155–3,181 zone is a decision area where Wave-C correction may end and trend continuation can begin.
📌 Strong stocks test patience before rewarding discipline.
⚠️ Disclaimer
This analysis is for educational purposes only.
I am not a SEBI registered analyst. Markets involve risk, and I may be wrong.
Please consult your financial advisor before taking any trade or investment decision.
Tcstrend

TCS - Swing Trade Setup📌 TCS — Elliott Wave Outlook: Possible Wave 4 Bounce Before Wave 5 Decline
TCS is currently trading near a critical zone where the earlier ABC corrective structure has already been completed. Price action is now approaching a region where structural deviation may occur.
From an Elliott Wave perspective, if the price breaks above the ABC completion zone, it can indicate the development of an intermediate Wave 4. Such Wave-4 formations typically retrace a portion of Wave 3, often creating a temporary relief rally within the broader structure.
However, unless the trend fully reverses, this Wave 4 bounce can remain corrective in nature. After completing Wave 4, the chart suggests that TCS may resume its decline to form Wave 5, thereby completing the higher-degree Wave B or Wave 2 within the Primary Wave Structure.
Key Technical Notes:
ABC corrective structure appears completed.
Breaks above the completion zone increase the probability of a corrective Wave 4 rally.
Wave 5 may unfold afterward, potentially completing Primary Wave B/2.
Trend confirmation should be based on hourly closes and price behavior near key Fib retracement zones.
What to Watch:
Price reaction near the ABC completion zone
Whether a structured Wave 4 bounce forms or price rejects sharply
Hourly close levels for confirmation
Volume behavior on the bounce or breakdown
Educational Insight:
Wave 4 rallies are often misleading for new traders—they may appear as reversals but are usually corrective. Always assess whether structure supports continuation before assuming a trend shift.
Conclusion
TCS is at a structural turning point. A break above the ABC completion region may trigger a Wave 4 relief move, but unless higher-degree resistance breaks convincingly, the larger structure still supports a potential Wave 5 decline to complete the primary correction.
Disclaimer:
I am not a SEBI-registered analyst. This analysis is for educational purposes only. Always perform your own research or consult a financial advisor before making trading decisions.

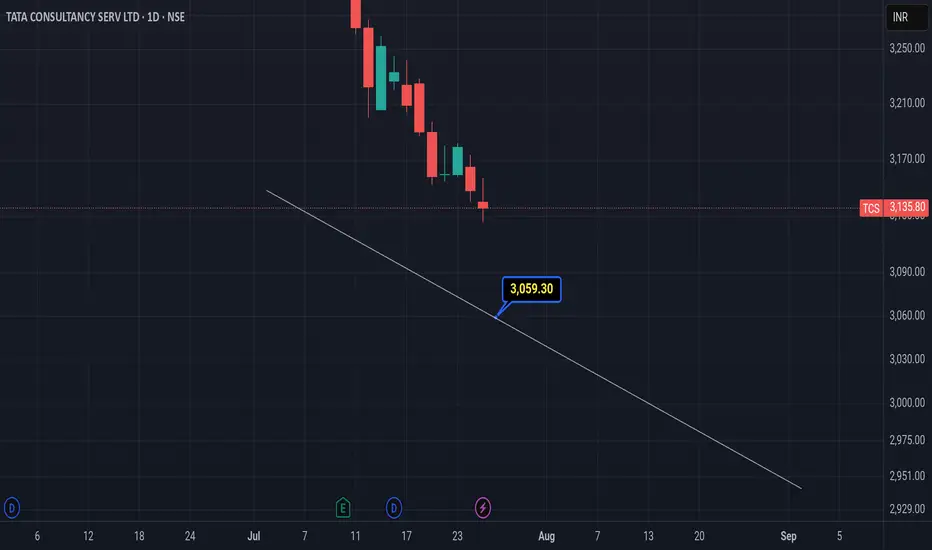
TCSThere's a Imp Gap pending at 3059 level, so chances are high it could possibly test that support level or to the white line.
Disclaimer :
It's a personal view not a financial advice and I assume no responsibility and liability whatever outcome arises.
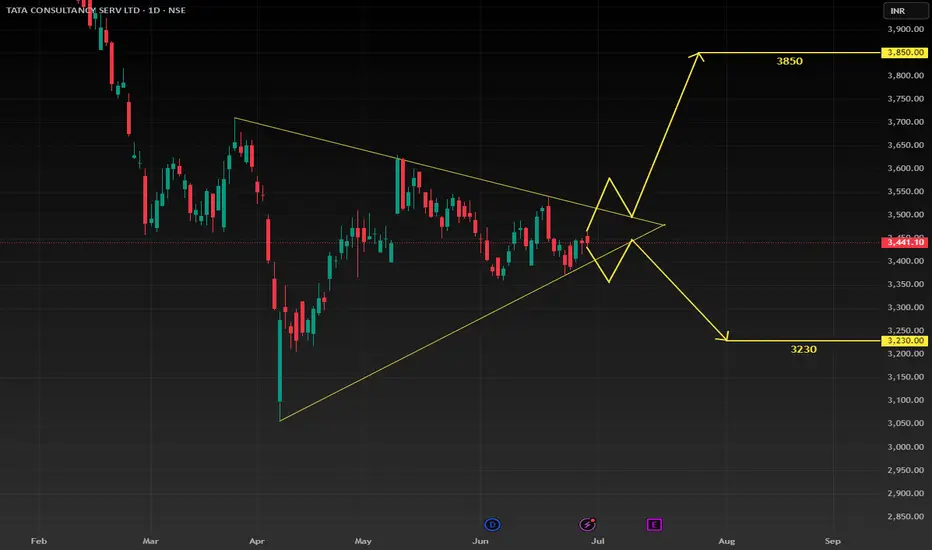
TCS nearing potential Breakout/Breakdown PointPrice of TCS is getting compressed into a triangle pattern and about to burst out on either side. So be watchful in the July 2025 month for the breakout/breakdown and plan your trade accordingly.
* Shared for the educational purpose only.
TCS | To Bleed MoreFrom the Highs of 4400s to the recent lows of 3500s stock has almost corrected near 20% n finally started to rose from a good weekly demand zone
But it seems the trouble is not over yet
As we can see a strong supply zone with gaps is present in the daily time frame, with a supply range between 3600 - 3670
Any signs of bearishness in lower time frame will be a good time to sell CE or buy PE with a strict Sl above 3680 for a downside target of 3450
Stock also has one more selling opportunity area in daily time frame with supply range between 3750 - 3775
If monitored properly can benefit from both the opportunities
TCS next moveTCS next move
CMP has triggered on demand area if its powerful demand we can expect a next target of 4600 and above
if its breaks bellow 41200 we can expect 3950 near by
Hit the like button to Rock !! Show some energy !!
Note :
⨻ Check the live market updates and analysis yourself before buy or sell.
⨺ Am not giving any advisory or signals its just my idea for upgrade my knowledge in trading for myself
⨹ This is my pre and post market analysis and my trading journey. Not a suggestion to buy or sell.
⫸ You are responsible for your trading not me ⫷
happy trading 🥰

TCS - Excellent Buy OpportunityStock has finally reached the strong support area of 4400-4420
It has bounced once from this area will try to do the same again
As it is also a Flip zone (Previous resistance turned support)
Expecting 4570-80 in coming days
View negates below 4400

TCS Swing TradeHello Traders,
As we all know Pharma, IT, FMCG is driving the market right now.
As the sector is bullish, just keep an eye on TCS about to make Fresh Highs.
Volume confirmation seen on Last 2 hours of Friday session.
Once breaks above resistance plan for a swing trade with LOW RISK & HIGH REWARD.
Educational Purpose Only
Thank You
Prince

TCS BULLISH VIEWTcs looking like bullish
It is farmed head and shoulder pattern
channel pattern also saying its moving up side
circuit also re-tested
20 ema also good supported
stops loss also very small
results also good
Entry @CMP
Stop loss@3884
1st target@4120
2nd target@4250
so please keep TCS in your watchlist for short term investment.
If you like my view, do support it with a boost which is valuable inspiration for me to post ideas like this in future. thank you friends!
Disclaimer:
I am not a SEBI Registered Analyst. Anything posted here is my own analysis and views. This is created for educational purposes only. Always consult your Financial Advisor before taking any decision or trade.
Happy trading.

TCS BREAKOUT & RETEST SWING TRADETCS in A Very Bullish zone.
Breakout of Last month resistance & retested the previous levels.
Above 50 ema & bounce back .
Plan for a swing Trade for good results.

TCS - BullishTCS is clearly taking support at key levels and clearly showing bullish and extremely pattern in chart. TCS could easily go higher once positive mood resumes.

TCS Ready For All Time High ??TCS Ready For All Time High ??
Clear Cup & Handle Formation
Buy At Cmp 3606 To Dips 3470-3500
SL - 3330 ( Weekly Closing Basis )
Target - 4050/4300

TCSTCS looking good weekly breakout 2years breakout entry level 4040 rs to 4100 target 🎯 is 5000 rs above , wait for retractement level and entry

TCS Analysis & PredictionThis is the analysis of TCS in the Daily Time Frame. Watch carefully. The chart explains itself.
If it sustains above the previous resistance level, it is good for the stock.
There are some prediction levels. These Levels act as Support and Resistance according to position of price. You have to trade according to level breakout or breakdown.
Always maintain your risk management.
Book your profit according to your “STOMACH”.
Disclaimer:
This is not investment advice. I am not a SEBI Registered Analyst. Anything posted here is my own analysis and views. This is created for educational purposes only. Always consult your Financial Advisor before taking any decision or trade.
Happy trading.
About TCS :
Tata Consultancy Services Ltd. is an information technology services, consulting, and business solutions organization. The firm offers a consulting-led, cognitive powered, portfolio of business, technology, and engineering services and solutions. It operates through the following segments: Banking, Financial Services, and Insurance; Manufacturing; Retail and Consumer Business; Communication; Media and Technology; and Others, such as energy, resources and utilities, life sciences and healthcare, s-governance, and products. The company was founded in April 1968 and is headquartered in Mumbai, India.

#BUYTCSToo much Ups and dows, Too much Consolidations Done.
Stock made stoploss hunting at bottom, now trend is established.
Buy for targets mentioned in chart

TCS: Another Leg of Impulse is on the wayStock has given a sharp downside move few weeks ago in an impulsive manner. After that stock has bounced back sharply in a three wave corrective structure and halted near 61.8% fibonacci retracement level and retreated lower.
Stock is likely to fall towards 3300 and 3200 in the coming weeks.

TCS buying levels3426 -3400 will be the area of value as of cmp
this price will be open until it get retest
3678 and 3480 is the side ways zone
wait paitently for the entry

TCS: Symmetrical Triangle BreakoutTCS has given Symmetrical Triangle Breakout on Daily and Weekly Timeframe. Still to confirm on Monthly Timeframe. Targets of 1100+ points


TCS SHORT TCS SELL LEVEL
if breakdown 3488 on daily basis the we can see down side move atleast 6% down side target 3371/3274

TCS on verge of Monthly Breakout TCS on verge of Monthly Breakout
Use all the dips new high coming soon 3800/4000++

TCS head & shoulder pattern on daily time frameTCS making head & shoulder pattern in DTF & if TCS close above 3140 then neglect H&S pattern. TCS following trendline support from 2020 so watch & trade carefully with stoploss

3 Expected Bottom Their are 3 expected bottom for TCS, which is predicted using ELLIOTT WAVE ANALYSIS. As shown we are in the process of WAVE C. Ending of WAVE C is expected at 3 point, which are 62%, 100% & 123% (projection of WAVE C)
