Nifty Metal - Breakout Setup, Move is ON...#CNXMETAL trading above Resistance of 8747
Next Resistance is at 11523
Support is at 6740
Here is previous chart:
Chart is self explanatory. Levels of breakout, possible up-moves (where index may find resistances) and support (close below which, setup will be invalidated) are clearly defined.
Disclaimer: This is for demonstration and educational purpose only. This is not buying or selling recommendations. I am not SEBI registered. Please consult your financial advisor before taking any trade.
Techanicalanalysis

National Aluminium Company Limited - Breakout Setup, Move is ON.#NATIONALUM trading above Resistance of 331
Next Resistance is at 443
Support is at 228
Here are previous charts:
Chart is self explanatory. Levels of breakout, possible up-moves (where stock may find resistances) and support (close below which, setup will be invalidated) are clearly defined.
Disclaimer: This is for demonstration and educational purpose only. This is not buying or selling recommendations. I am not SEBI registered. Please consult your financial advisor before taking any trade.

National Aluminium Company Limited - Breakout Setup, Move is ON.#NATIONALUM trading above Resistance of 216
Next Resistance is at 331
Support is at 142
Here are previous charts:
Chart is self explanatory. Levels of breakout, possible up-moves (where stock may find resistances) and support (close below which, setup will be invalidated) are clearly defined.
Disclaimer: This is for demonstration and educational purpose only. This is not buying or selling recommendations. I am not SEBI registered. Please consult your financial advisor before taking any trade.

Breakout in Nifty Auto...Chart is self explanatory. Levels of breakout, possible up-moves (where index may find resistances) and support (close below which, setup will be invalidated) are clearly defined.
Disclaimer: This is for demonstration and educational purpose only. This is not buying or selling recommendations. I am not SEBI registered. Please consult your financial advisor before taking any trade.

Breakout in CSB Bank Ltd...Chart is self explanatory. Levels of breakout, possible up-moves (where stock may find resistances) and support (close below which, setup will be invalidated) are clearly defined.
Disclaimer: This is for demonstration and educational purpose only. This is not buying or selling recommendations. I am not SEBI registered. Please consult your financial advisor before taking any trade.

Force Motors Ltd - Breakout Setup, Move is ON...#FORCEMOT trading above Resistance of 21123
Next Resistance is at 30646
Support is at 14435
Here are previous charts:
Chart is self explanatory. Levels of breakout, possible up-moves (where stock may find resistances) and support (close below which, setup will be invalidated) are clearly defined.
Disclaimer: This is for demonstration and educational purpose only. This is not buying or selling recommendations. I am not SEBI registered. Please consult your financial advisor before taking any trade.

Laurus Labs Limited - Breakout Setup, Move is ON...#LAURUSLABS trading above Resistance of 1091
Next Resistance is at 1512
Support is at 806
Here are previous charts:
Chart is self explanatory. Levels of breakout, possible up-moves (where stock may find resistances) and support (close below which, setup will be invalidated) are clearly defined.
Disclaimer: This is for demonstration and educational purpose only. This is not buying or selling recommendations. I am not SEBI registered. Please consult your financial advisor before taking any trade.

GOLD/SILVER RatioChart is self explanatory. The price of the TVC:GOLD/TVC:SILVER ratio (XAU/XAG) as of January 1, 2026, is approximately 60.71. This indicates that one ounce of gold is worth roughly 60.71 ounces of silver. Over the past year, the ratio has seen a significant change, trading within a 52-week range of 54.19 to 107.27.
Recent trends
* Market Sentiment and Economic Conditions: When economic uncertainty is high, investors typically flock to gold as a safe-haven asset, which widens the ratio (increases the number).
* Industrial Demand for Silver: Silver has significant industrial applications (electronics, solar panels), so its price often correlates with economic growth and industrial demand, which can narrow the ratio.
* Relative Volatility: Silver is generally more volatile than gold ("high-beta" version of gold); in a bull market for precious metals, silver prices tend to rise faster, lowering the ratio, while in a bear market, gold prices tend to hold up better, increasing the ratio.
Key Insights
* Ratio Fluctuation: The gold-silver ratio is highly volatile. Historically, the all-time high was 125:1 in April 2020.
* Recent Volatility: Both gold and silver have experienced significant price movements in 2025, driven by factors such as interest rate expectations, geopolitical tensions, and industrial demand for silver.
* Price Influences: Domestic gold and silver prices in India are influenced by international market trends, currency exchange rates, local demand, taxes, and import duties.
Gold-Silver Ratio and Future Price Predictions
The gold-silver ratio (calculated by dividing the gold price by the silver price) indicates which metal may be undervalued or overvalued compared to the other and helps anticipate potential out performance.
* High Ratio (e.g., above 80:1 or 90:1): Historically suggests that silver is undervalued relative to gold. This often signals a potential buying opportunity for silver, with expectations that silver's price may rise faster than gold's, causing the ratio to decrease (revert to its mean). A high ratio can also indicate economic uncertainty or a flight to gold's safe-haven appeal.
* Low Ratio (e.g., below 50:1 or 60:1): Historically suggests that silver is overvalued relative to gold. This may signal a potential buying opportunity for gold, with expectations that gold may outperform silver, causing the ratio to increase. A low ratio often coincides with periods of economic optimism and stronger industrial demand for silver.
Current Market Insights
As of late December 2025/early January 2026, the gold-silver ratio has recently fluctuated, with reports placing it around 60.53 to 64:1, down from highs earlier in 2025 that exceeded 100:1. The sharp drop in the ratio during 2025 signaled a strong out performance by silver.
* Silver Out performance Expected: Many analysts believe silver is still cheap relative to its long-term historical average ratio (around 40-60:1 or 60-80:1) and could continue to outperform gold.
* Key Drivers: Silver's strong industrial demand (especially in solar panels and electronics), coupled with persistent supply deficits, provides fundamental support for its price to potentially reach higher levels like $85-$100 per ounce in the medium to long term.
* Volatility and Risk: Silver is generally more volatile than gold, which means it has the potential for higher percentage gains but also larger pullbacks. Investors use the ratio as one of several tools to balance their portfolios, rather than relying on it as a sole predictor.
Disclaimer: This is for demonstration and educational purpose only. This is not buying or selling recommendations. I am not SEBI registered. Please consult your financial advisor before taking any trade.

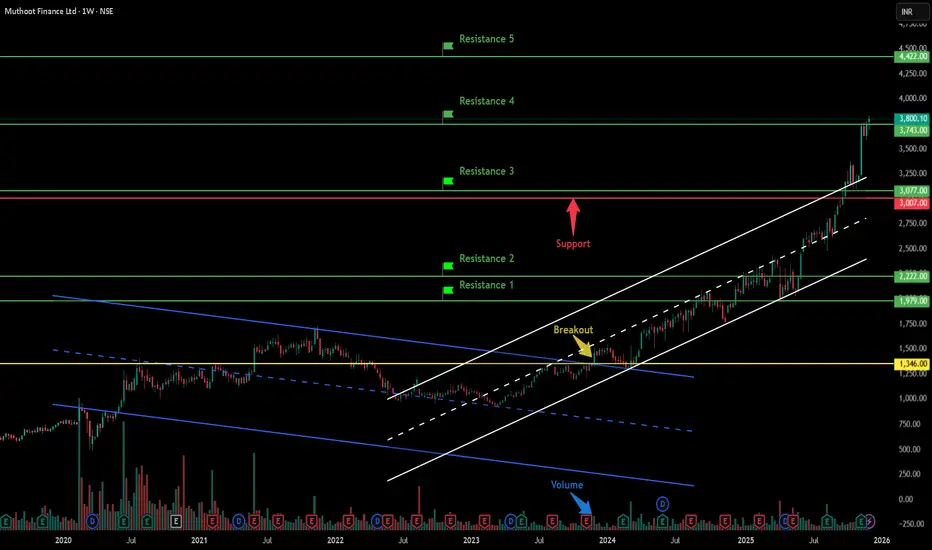
Muthoot Finance Limited - Breakout Setup, Move is ON...#MUTHOOTFIN trading above Resistance of 3743
Next Resistance is at 4422
Support is at 3007
Here are previous charts:
Chart is self explanatory. Levels of breakout, possible up-moves (where stock may find resistances) and support (close below which, setup will be invalidated) are clearly defined.
Disclaimer: This is for demonstration and educational purpose only. This is not buying or selling recommendations. I am not SEBI registered. Please consult your financial advisor before taking any trade.
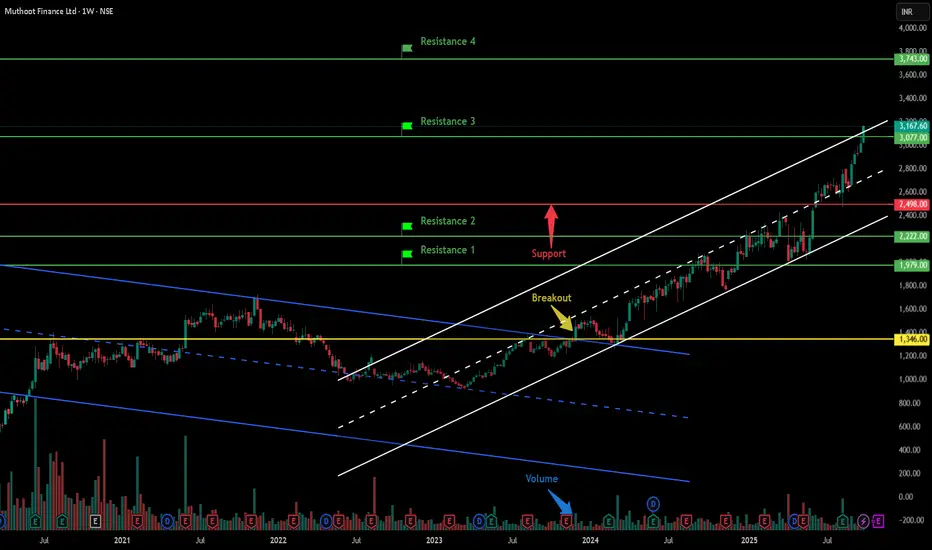
Muthoot Finance Limited - Breakout Setup, Move is ON...#MUTHOOTFIN trading above Resistance of 3077
Next Resistance is at 3743
Support is at 2498
Here are previous charts:
Chart is self explanatory. Levels of breakout, possible up-moves (where stock may find resistances) and support (close below which, setup will be invalidated) are clearly defined.
Disclaimer: This is for demonstration and educational purpose only. This is not buying or selling recommendations. I am not SEBI registered. Please consult your financial advisor before taking any trade.
Vimta Labs Limited - Breakout Setup, Move is ON...#VIMTALABS trading above Resistance of 952
Next Resistance is at 1214
Support is at 691
Here are previous charts:
Chart is self explanatory. Levels of breakout, possible up-moves (where stock may find resistances) and support (close below which, setup will be invalidated) are clearly defined.
Disclaimer: This is for demonstration and educational purpose only. This is not buying or selling recommendations. I am not SEBI registered. Please consult your financial advisor before taking any trade.

Venus Remedies Limited - Breakout Setup, Move is ON...#VENUSREM trading above Resistance of 638
Next Resistance is at 1182
Support is at 424
Here is previous chart:
Chart is self explanatory. Levels of breakout, possible up-moves (where stock may find resistances) and support (close below which, setup will be invalidated) are clearly defined.
Disclaimer: This is for demonstration and educational purpose only. This is not buying or selling recommendations. I am not SEBI registered. Please consult your financial advisor before taking any trade.

Privi Speciality Chemicals Ltd - Breakout Setup, Move is ON...#PRIVISCL trading above Resistance of 3196
Next Resistance is at 4757
Support is at 2166
Here is previous chart:
Chart is self explanatory. Levels of breakout, possible up-moves (where stock may find resistances) and support (close below which, setup will be invalidated) are clearly defined.
Disclaimer: This is for demonstration and educational purpose only. This is not buying or selling recommendations. I am not SEBI registered. Please consult your financial advisor before taking any trade.

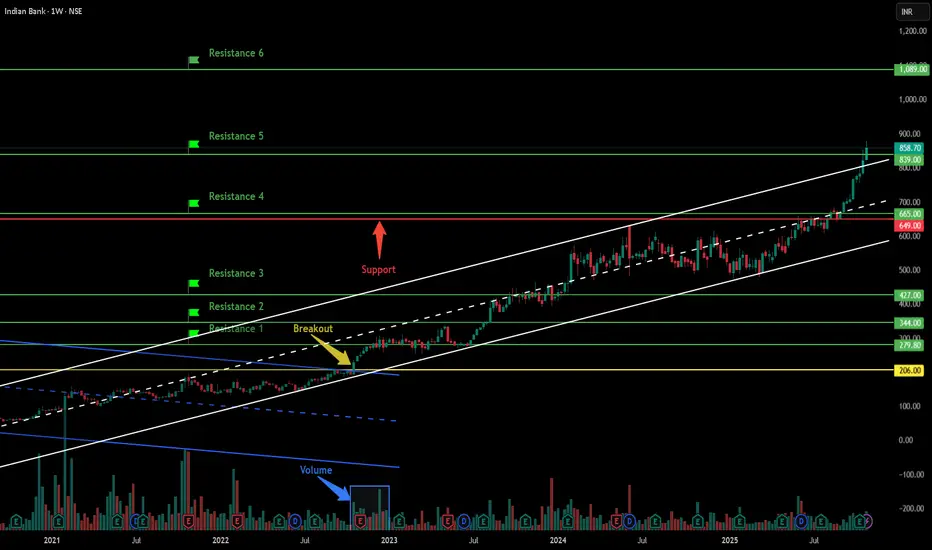
Indian Bank - Breakout Setup, Move is ON...#INDIANB trading above Resistance of 839
Next Resistance is at 1089
Support is at 649
Here are previous charts:
Chart is self explanatory. Levels of breakout, possible up-moves (where stock may find resistances) and support (close below which, setup will be invalidated) are clearly defined.
Disclaimer: This is for demonstration and educational purpose only. This is not buying or selling recommendations. I am not SEBI registered. Please consult your financial advisor before taking any trade.
Stallion India Fluorochemicals Ltd - Breakout Setup, Move is ON#STALLION trading above Resistance of 312
Next Resistance is at 524
Support is at 204
Here are previous charts:
Chart is self explanatory. Levels of breakout, possible up-moves (where stock may find resistances) and support (close below which, setup will be invalidated) are clearly defined.
Disclaimer: This is for demonstration and educational purpose only. This is not buying or selling recommendations. I am not SEBI registered. Please consult your financial advisor before taking any trade.

Le Travenues Technology Ltd - Breakout Setup, Move is ON...#IXIGO trading above Resistance of 327
Next Resistance is at 460
Support is at 249
Here is previous chart:
Chart is self explanatory. Levels of breakout, possible up-moves (where stock may find resistances) and support (close below which, setup will be invalidated) are clearly defined.
Disclaimer: This is for demonstration and educational purpose only. This is not buying or selling recommendations. I am not SEBI registered. Please consult your financial advisor before taking any trade.

Inox Green Energy Services Ltd - Breakout Setup, Move is ON...#INOXGREEN trading above Resistance of 245
Next Resistance is at 363
Support is at 143
Here are previous charts:
Chart is self explanatory. Levels of breakout, possible up-moves (where stock may find resistances) and support (close below which, setup will be invalidated) are clearly defined.
Disclaimer: This is for demonstration and educational purpose only. This is not buying or selling recommendations. I am not SEBI registered. Please consult your financial advisor before taking any trade.

Inox Green Energy Services Ltd - Breakout Setup, Move is ON...#INOXGREEN trading above Resistance of 160
Next Resistance is at 245
Support is at 99
Here are previous charts:
Chart is self explanatory. Levels of breakout, possible up-moves (where stock may find resistances) and support (close below which, setup will be invalidated) are clearly defined.
Disclaimer: This is for demonstration and educational purpose only. This is not buying or selling recommendations. I am not SEBI registered. Please consult your financial advisor before taking any trade.

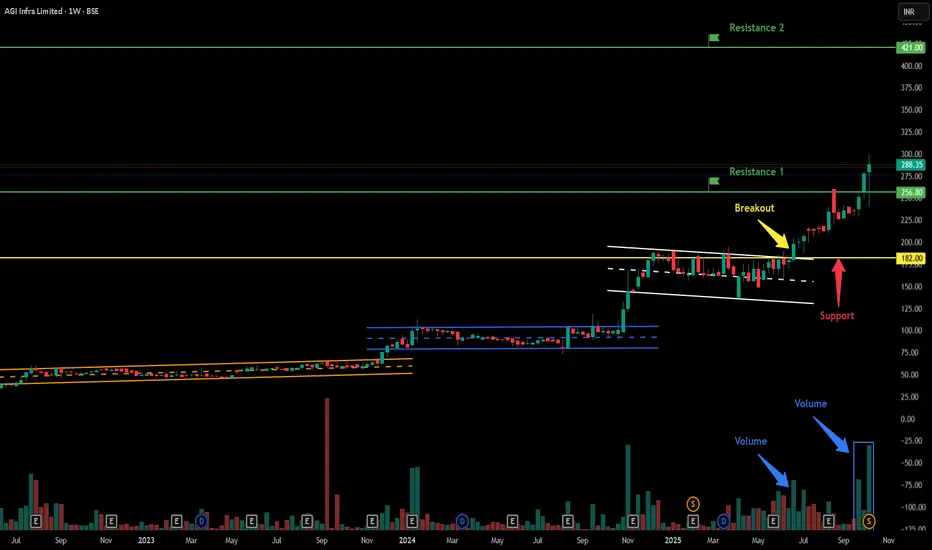
AGI Infra Ltd - Breakout Setup, Move is ON...#AGIIL trading above Resistance of 256.80
Next Resistance is at 421
Support is at 182
Here is previous chart:
Chart is self explanatory. Levels of breakout, possible up-moves (where stock may find resistances) and support (close below which, setup will be invalidated) are clearly defined.
Disclaimer: This is for demonstration and educational purpose only. This is not buying or selling recommendations. I am not SEBI registered. Please consult your financial advisor before taking any trade.
Bajaj Finance Limited- Breakout Setup, Move is ON...#BAJFINANCE trading above Resistance of 1004.50
Next Resistance is at 1182
Support is at 851
Here is previous chart:
Chart is self explanatory. Levels of breakout, possible up-moves (where stock may find resistances) and support (close below which, setup will be invalidated) are clearly defined.
Disclaimer: This is for demonstration and educational purpose only. This is not buying or selling recommendations. I am not SEBI registered. Please consult your financial advisor before taking any trade.

Indraprastha Medical Corporation Ltd- Breakout Setup, Move is ON#INDRAMEDCO trading above Resistance of 547
Next Resistance is at 789
Support is at 390
Here are previous charts:
Chart is self explanatory. Levels of breakout, possible up-moves (where stock may find resistances) and support (close below which, setup will be invalidated) are clearly defined.
Disclaimer: This is for demonstration and educational purpose only. This is not buying or selling recommendations. I am not SEBI registered. Please consult your financial advisor before taking any trade.

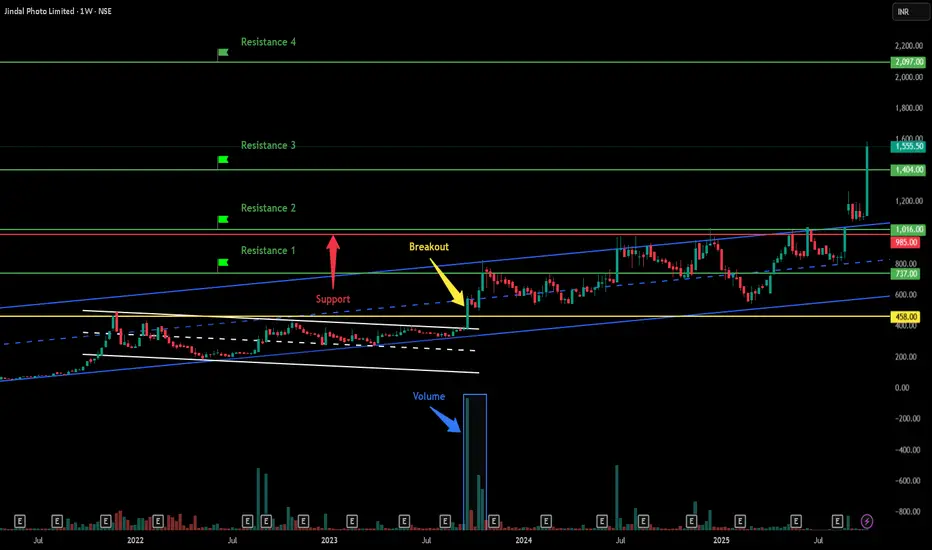
Jindal Photo Limited - Breakout Setup, Move is ON...#JINDALPHOT trading above Resistance of 1404
Next Resistance is at 2097
Support is at 985
Here are previous charts:
Chart is self explanatory. Levels of breakout, possible up-moves (where stock may find resistances) and support (close below which, setup will be invalidated) are clearly defined.
Disclaimer: This is for demonstration and educational purpose only. This is not buying or selling recommendations. I am not SEBI registered. Please consult your financial advisor before taking any trade.
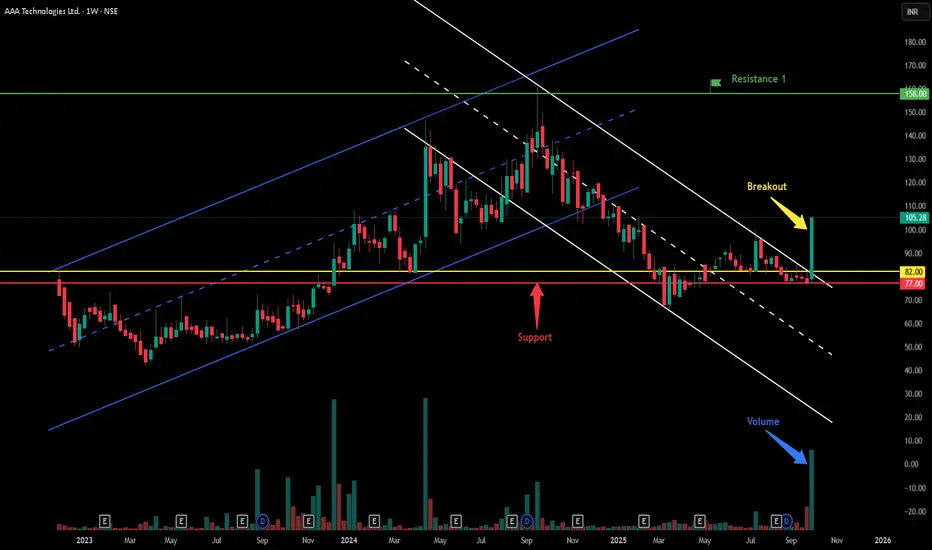
Breakout in AAA Technologies Ltd...Chart is self explanatory. Levels of breakout, possible up-moves (where stock may find resistances) and support (close below which, setup will be invalidated) are clearly defined.
Disclaimer: This is for demonstration and educational purpose only. This is not buying or selling recommendations. I am not SEBI registered. Please consult your financial advisor before taking any trade.