Gold Outlook – Buying as the Main ThemeGold Outlook – Buying as the Main Theme
Gold continues to move in line with previous analyses. Earlier today in the Asian session, the market saw a quick dip due to liquidity being cleared during the daily one-hour break. However, price quickly recovered, broke through the 3339 resistance, and confirmed that buying momentum has returned, strengthening the short-term bullish trend.
Expectations for a new Elliott wave cycle are gradually taking shape. At this point, wave 3 is considered to have begun — typically the strongest phase with greater momentum and wider price swings. This supports the scenario of a medium-term bullish outlook.
Price remains above the key EMA levels, confirming that the long-term trend is intact. The breakout above 3339 reinforces buyer strength and opens the way towards Fibonacci extension targets at 2.618 and 3.618. MACD also maintains positive momentum, while Elliott structure suggests that wave 3 still has room to extend further.
As long as gold holds above the 3336–3338 zone, this remains a reasonable area to consider buying. A minor pullback around this level would offer an even better opportunity to join the trend, with a stop-loss of about 6 dollars to manage risk effectively.
When price approaches Fibonacci extension targets, traders may consider partial profit-taking or look for short-term selling opportunities. This approach will be suitable given how far wave 3 has already extended.
It is important to monitor price reactions around the extension zones. Higher timeframes such as H1–H4 should be prioritised to capture the broader structure and avoid market noise.
A strong trend never moves in a straight line; it always comes with pauses and retracements. Staying patient and riding with the main trend is often the best way to maximise profits in the medium term.
#XAUUSD #Gold #TechnicalAnalysis #PriceAction #Fibonacci #ElliottWave #MACD #Forex #IndiaTrading
Techincalanalysis

Vodafone Idea (VI) chart pattern analysis + fundamentals + peer Vodafone Idea (VI) chart pattern analysis + fundamentals + peer comparison + learnings
-Technical Chart Analysis – Vodafone Idea (Weekly)
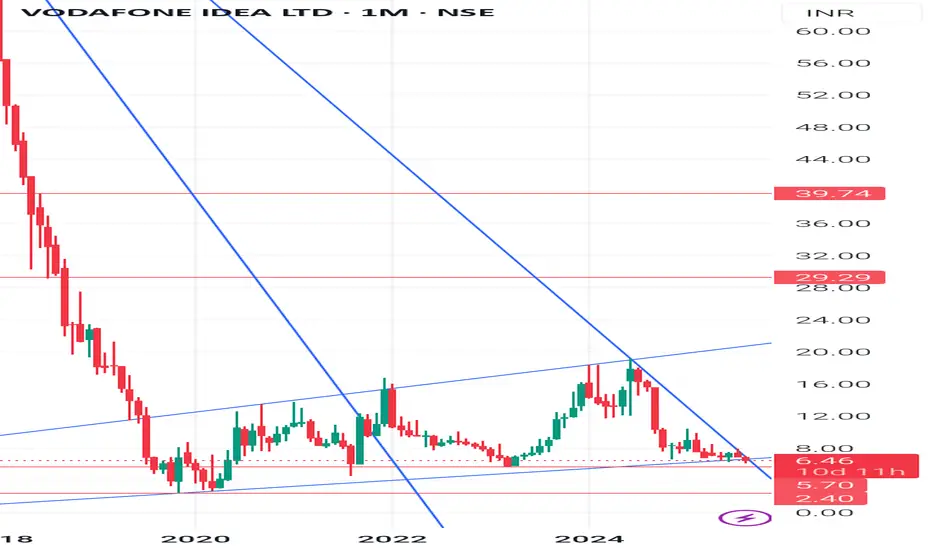
-CMP (Current Market Price): 6.46 (+5.04%)
-Trend: Stock has been in a long-term downtrend since 2018.
👉Key Support Levels:
5.70 (immediate)
4.20 (medium-term)
2.40 (long-term bottom)
👉Resistance Levels:
8.50 (immediate)
12.20 (medium-term)
16.80, then 29.3 & 39.7 (long-term hurdles)
👉Pattern Observation:
Price is struggling near a channel support line.
Stock is in a make-or-break zone – either bounces back from current support or risks sliding further.
Any weekly close above 8.5 will confirm strength and may lead to 12–16 zone.
👉 Fundamental Comparison (Vodafone Idea vs Competitors)
(FY24 / recent data approx)
Company Revenue ( Cr) Net Profit Debt ( Cr) Market Share (Telecom) P/E Ratio ARPU (Avg Revenue/User)
Vodafone Idea - 42,000 Loss (-29,000 Cr) - 2.1 lakh Cr - 19% NA (Loss-making) - 145
Bharti Airtel - 1.4 lakh Cr Profit (- 8,300 Cr) - 1.6 lakh Cr - 33% - 68x - 208
Reliance Jio - 98,000 Cr Profit (- 20,000 Cr) - 1.1 lakh Cr - 38% - 22x - 182
🔑 Key Observations:
-VI is the only loss-making player in top 3.
-Heavy debt (- 2.1 lakh Cr) makes survival tough without tariff hikes or govt. relief.
-ARPU (revenue per customer) is lowest among peers, which shows weak monetization.
-Airtel & Jio are fundamentally stronger with consistent profits.
👉 Basic Learnings for Students / New Investors
1. Chart Patterns Reflect History – A stock in downtrend for years (like VI) shows structural weakness; don’t catch falling knives without reason.
2. Support & Resistance Levels – Help in risk management; always watch where the stock can bounce or fall.
3. Debt is a Red Flag – Too much borrowing restricts growth; fundamentals matter more than temporary price spikes.
4. Compare with Competitors – If peers are profitable (Airtel, Jio) and one is struggling (VI), investors must be cautious.
5. Turnaround Bets are Risky – Such stocks may give multi-bagger returns if revived, or wipe out wealth if debt crushes survival.
Disclaimer👉
This analysis is for educational purposes only. It is not financial advice or stock recommendation. Always consult a SEBI-registered advisor before investing. Market investments carry risk.
#VodafoneIdea #StockMarketIndia #TechnicalAnalysis #FundamentalAnalysis #Airtel #RelianceJio #TelecomSector #StockMarketForBeginners #InvestmentLearning #SupportResistance #ChartAnalysis
POLICYBZR (PB FINTECH LTD.)POLICYBZR gave BO of an old resistance, then re-tested and now seems to be getting ready.
It made VCP pattern. Making Hammer candles, decent volume, above 20-50ema, crossing the resistance again, there is probability of an upside move.
Keep eyes on it 👀
If you like my analysis, please follow me as a token of appreciation :)
in.tradingview.com/u/SatpalS/
For learning and educational purposes only, not trading advice. Please consult your financial advisor before investing.

Fed Set to Cut 50bps: Gold Gains as the Bullish Wave Forms Again📌 Macro Overview
US Treasury Secretary Bessent gives the green light for a potential 50-basis-point rate cut by the Fed in September.
July CPI remains soft → USD weakens, bond yields fall, boosting gold’s bullish outlook.
Gold briefly touched $3,370/oz, closing at $3,355.9/oz (+0.24%).
Gains capped as US equities continue to break records and geopolitical tensions ease.
Market focus now shifts to PPI data, jobless claims, and the anticipated Trump–Putin meeting for the next directional cues.
🧐 Technical Outlook – MMFLOW Analysis
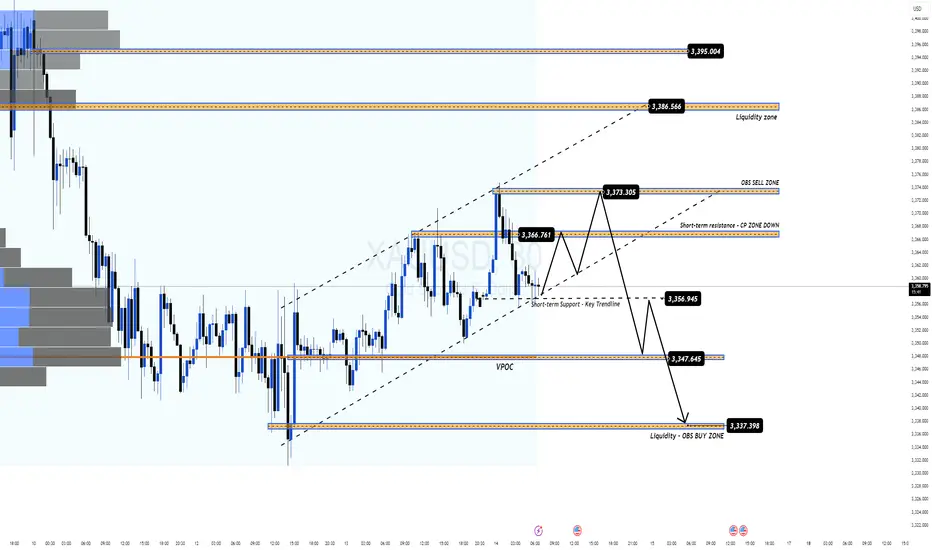
The bullish recovery wave is clearly re-emerging after a corrective phase, with price hunting liquidity zones left behind in the recent retracement.
Preferred strategy: Trade around key liquidity levels or continuation zones for SELL opportunities; BUY entries will be taken earlier to catch the recovery wave within the current price channel.
Price Structure & Observation Zones:
Short-term uptrend channel intact, primary support at 3336 – 3334 (Liquidity – OBS BUY Zone).
Major resistance at 3394 – 3396 (Liquidity Grab Zone + H1 Supply).
🎯 MMFLOW Trading Plan
🔹 BUY SCALP – Catch the recovery wave
Entry: 3336 – 3334
SL: 3330
TP: 3340 – 3345 – 3350 – 3355 – 3360 – 3365 – 3370 – 3380 – ???
🔹 SELL SCALP – Counter-trend at resistance
Entry: 3394 – 3396
SL: 3400
TP: 3390 – 3385 – 3380 – 3370 – 3360
📊 Key Levels
Resistance: 3365 – 3370 – 3395
Support: 3340 – 3336 – 3330
💡 MMFLOW Strategy Tip:
Wait for price to retest the 3336 – 3334 BUY ZONE for trend-following BUY positions.
Watch for liquidity absorption signals at 339x – a potential SELL reversal zone.
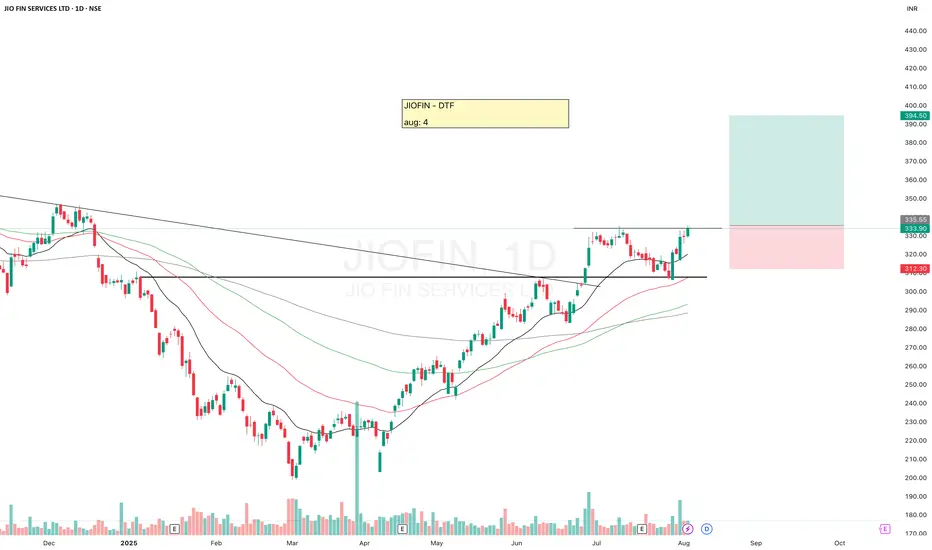
JIOFINJIOFIN is looking good, breakout from here may give a good upside move.
EMAs are aligned, keep eyes on it.
✅ If you like my analysis, please follow me here as a token of appreciation :)
in.tradingview.com/u/SatpalS/
📌 For learning and educational purposes only, not a recommendation. Please consult your financial advisor before investing.
Tata powerThe stock Tata power is making rising wedge pattern and making higher high pattern.
It's immediate levels are as below-:
Support 1- 355
Support 2- 323
Support 3- 282
And resistance
R1- 435
R2- 495
R3- 666

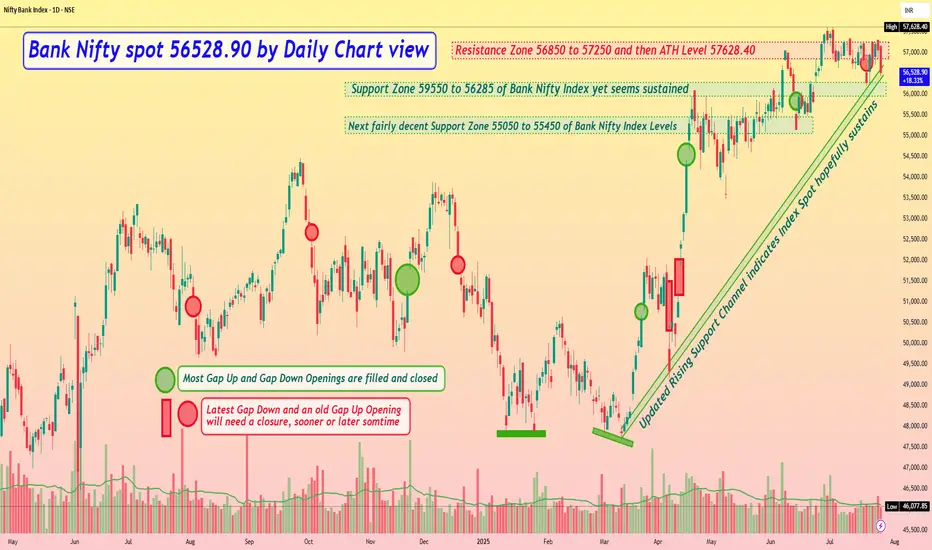
Bank Nifty spot 56528.90 by Daily Chart view - Weekly updateBank Nifty spot 56528.90 by Daily Chart view - Weekly update
- Resistance Zone seen at 56850 to 57250 and then ATH Level 57628.40
- Updated Rising Support Channel indicates Index Spot hopefully sustains
- Support Zone seen at 59550 to 56285 of Bank Nifty Index yet seems sustained
- Next fairly decent Support Zone seen at 55050 to 55450 of Bank Nifty Index Levels
- *Multiple reasons attribute for weakness and breakdown and that is how Markets show their Supremacy*
MARKSANSMARKSANS looks good, it's been facing resistance for a long time, and now constantly making HL and Equal highs.
✅ If you like my analysis, please follow me here as a token of appreciation :)
in.tradingview.com/u/SatpalS/
📌 For learning and educational purposes only, not a recommendation. Please consult your financial advisor before investing.

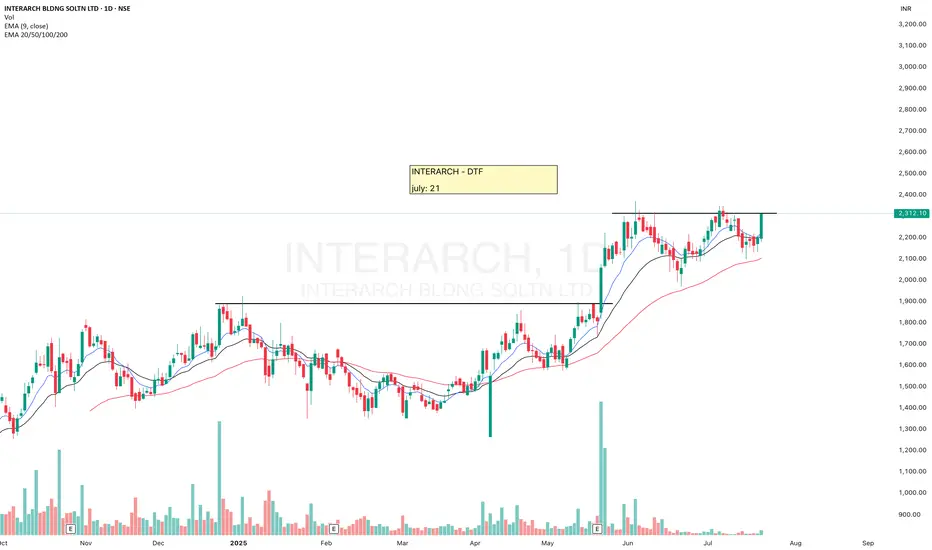
INTERARCHINTERARCH is looking strong, there is probability of an upside move.
Keep eyes on this.
✅ If you like my analysis, please follow me as a token of appreciation :)
in.tradingview.com/u/SatpalS/
📌 For learning and educational purposes only, not a recommendation. Please consult your financial advisor before investing.
US30 potential for the upsideLooking for US30 to push to the upside upon the retest of the recently created 4h/1h demand zone.Use proper risk management should you join me.

Advance Option Trading Why Institutions Prefer Options
Leverage – Control large positions with small capital
Risk Management – Protect portfolios
Cash Flow – Earn premium income
Volatility Play – Earn from IV rise/fall
Customization – Tailored exposure using exotic options
Core Strategies Used by Institutions
1. Protective Puts
Buy puts to insure large stock holdings against downside risk.
2. Covered Calls
Earn premium income on long-term stock holdings.
3. Calendar Spreads
Take advantage of time decay and volatility differences.
4. Straddles & Strangles
Bet on volatility movement, not direction.
Tools Used by Institutional Option Traders
Bloomberg Terminal – Real-time data, pricing models
Quantitative Models – Black-Scholes, Binomial Trees
Algo Execution – Smart order routing
Risk Management Software – VaR, Greeks analysis
Option Analytics Platforms – Orats, Trade Alert

Option Trading Part-1 What Is Institutional Option Trading?
Institutional Option Trading involves using derivatives (Options) for:
Hedging big equity portfolios
Speculating on volatility or price movement
Arbitrage opportunities
🔹 Key Techniques:
Volatility Arbitrage
Delta-Neutral Hedging
Covered Calls
Protective Puts
Iron Condors & Spreads
How Institutions Use Options Differently
✅ Retail Focus:
Naked calls/puts
Directional trades
Limited capital
✅ Institutional Focus:
Portfolio insurance
Complex multi-leg strategies
Implied Volatility arbitrage
Event-based hedging (like earnings or Fed news)

Option TradingInstitutional Trading – The Backbone of Markets
✅ Who Are Institutional Traders?
They are big market participants such as:
Pension Funds
Insurance Companies
Hedge Funds
Mutual Funds
Foreign Institutional Investors (FIIs)
✅ Why Are They Important?
Provide liquidity in markets
Trade with large volumes
Influence market trends

Institution Option Trading What Is Trading?
Trading refers to buying and selling financial instruments (stocks, options, futures) in financial markets for profit. It can be:
Retail Trading – Done by individual investors.
Institutional Trading – Conducted by large organizations like banks, mutual funds, hedge funds.
What Is Investing?
Investing involves allocating capital with the expectation of long-term wealth generation. It focuses on:
Value appreciation
Dividends or returns over time
Longer holding periods

PVR Channel Break out - Upside 5% Gain (short term)PVR INOX: Setting the Stage for a 5% Upside?
PVR INOX Ltd is showing signs of a potential breakout, with technical indicators aligning for a short-term upside of around 5%. On the hourly chart, the stock is consolidating above key EMAs (968–970 zone), forming a bullish structure supported by a rising trendline.
Current Price: ₹974.50
Upside Target: ₹1,020+
Indicators: EMA confluence, breakout from descending channel, volume uptick
Morning Doji Star - Bullish (Emerging) 1 day Time frame
What’s fueling the optimism?
- 🔥 Strong box office performance in early 2025, with collections up 39% YoY in Jan–Feb
- 🎟️ Highest-grossing February since COVID, led by hits like Chhaava
- 💼 Promoter stake increase and bullish brokerage calls (ICICI Securities sees up to 100% long-term upside)
With a robust content pipeline and improving fundamentals, PVR INOX might just be ready for its next act.

Trading Master ClassPost-Trade Processing
Clearing and Settlement: Trades are cleared by clearing houses and settled typically on T+1 or T+2 basis.
Regulatory Reporting: All trades must be reported for transparency and compliance.
Performance Review and Compliance
Evaluation: Execution quality, cost efficiency, and market impact are reviewed.
Audit Trails: Maintain detailed records for regulatory bodies like SEBI, SEC, etc.
Continuous Improvement: Algorithms and strategies are refined based on trade performance.
Key Components in Institutional Trading
Liquidity Management: Large trades need sufficient liquidity to avoid market disruption.
Algorithmic Support: Automated systems manage trade slicing and timing.
Risk Control: Continuous monitoring of exposure, slippage, and adverse market moves.

Option Trading Order Strategy Design
Execution Planning: Institutions cannot place large orders directly; they split trades into smaller lots to avoid price impact.
Techniques:
Algorithmic Trading (TWAP, VWAP, Iceberg orders)
Dark Pool Execution
Block Trades via Brokers
Trade Execution
Methods: Trades are routed through brokers, electronic communication networks (ECNs), or proprietary trading desks.
Real-Time Monitoring: Institutions monitor slippage, transaction costs, and market reaction continuously.

Institutional Trading ProcessInstitutional Trading Process
1. Research and Strategy Development
Extensive quantitative research.
Backtesting models.
Scenario analysis using risk management software.
2. Trade Execution
Executing trades via dark pools to prevent market impact.
Using smart order routers for best price execution.
3. Risk Management
Continuous monitoring of positions.
Real-time adjustments using delta-hedging.
Portfolio diversification to spread risk.
4. Reporting and Compliance
Institutional trades are heavily regulated.
Detailed reporting to regulatory bodies like SEBI, SEC, etc.

Institution Option TradingInstitutional options trading refers to the large-scale use of options by financial institutions such as hedge funds, mutual funds, pension funds, banks, insurance companies, and proprietary trading firms. Unlike retail traders, institutional participants possess significant capital, advanced technology, and deep market insight, enabling them to deploy complex options strategies for hedging, speculation, and arbitrage purposes.
Institutional options trading plays a crucial role in shaping market dynamics. These large entities can influence volatility, liquidity, and price movements due to the size and frequency of their trades. Understanding how institutional traders operate provides retail traders with key insights to align their strategies effectively.
The Foundation of Options Trading
1. Understanding Options
Options are derivative contracts that give the buyer the right, but not the obligation, to buy or sell an underlying asset at a predetermined price (strike price) within a specified time frame.
Types of Options:
Call Options: Provide the right to buy.
Put Options: Provide the right to sell.
2. Key Option Terminologies
Premium: Price paid to buy the option.
Strike Price: Predetermined price to buy/sell the underlying asset.
Expiration Date: Last date the option can be exercised.
In-the-Money (ITM): Option with intrinsic value.
Out-of-the-Money (OTM): Option with no intrinsic value.

Technical ClassCandlestick patterns are essential tools in technical analysis that help traders predict potential market movements based on price action. Each candlestick represents four key data points: Open, High, Low, and Close prices within a specific time frame.
Types of Candlestick Patterns:
1. Single Candlestick Patterns
Doji: Market indecision (Open ≈ Close)
Hammer: Bullish reversal, long lower wick
Shooting Star: Bearish reversal, long upper wick
Spinning Top: Market indecision, small body
2. Double Candlestick Patterns
Bullish Engulfing: Strong bullish reversal
Bearish Engulfing: Strong bearish reversal
Tweezer Bottom/Top: Reversal signals
3. Triple Candlestick Patterns
Morning Star: Bullish reversal (3 candles)
Evening Star: Bearish reversal (3 candles)
Three White Soldiers: Strong bullish continuation
Three Black Crows: Strong bearish continuation
✅ Importance in Trading:
Predict Trend Reversals
Identify Continuation Patterns
Spot Market Sentiment Early

NYKAA - Breakout from DTFNYKAA has resistance weakening on the Daily charts and has given a breakout with good volume.
The target of this pattern signals an upside potential of 10% from the current price level in the medium term.
The stock is trading above its 50- and 100-day simple moving averages (SMAs). The range is more than >1.2X, and the Volume is also >2X the average.
CMP- Rs. 108
Target Price- Rs228 ( 10% upside)
SL -202
Disclaimer: This is not a buy/sell recommendation. For educational purpose only. Kindly consult your financial advisor before entering a trade.

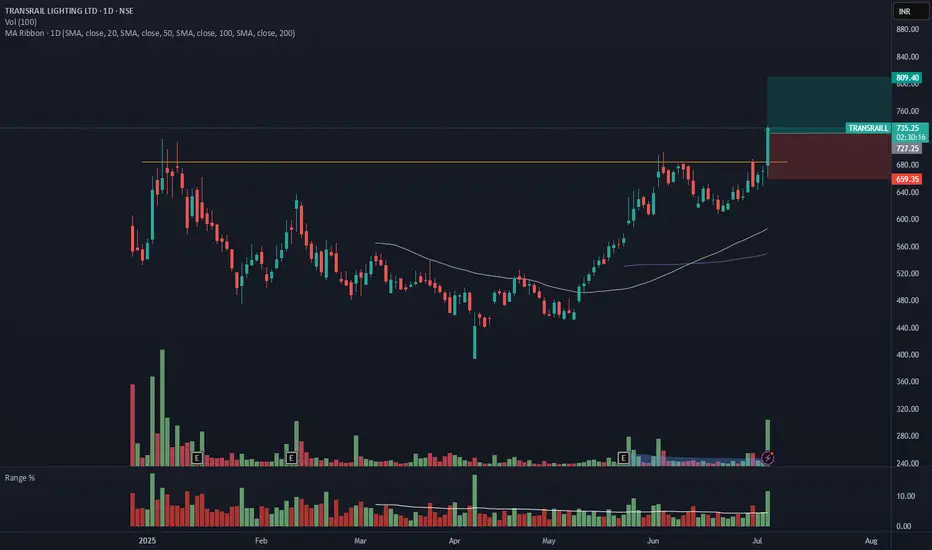
TRANSRAILL - Breakout from Daily TFTRANSRAILL has resistance weakening on the Daily charts and has given a breakout with good volume.
The target of this pattern signals an upside potential of ~10% from the current price level in the medium term.
The stock is trading above its 50- and 100-day simple moving averages (SMAs). The range is more than >2X, and the Volume is also >6X the average.
CMP- Rs. 727
Target Price- Rs.805( ~10% upside)
SL -859
Note- The breakout candle has gone up, extended, so be mindful of your position.
Disclaimer: This is not a buy/sell recommendation. For educational purpose only. Kindly consult your financial advisor before entering a trade.
Trading with Professionalsnvesting Basics
Investing involves allocating money into assets with the expectation of generating income or profit over time. Unlike trading, investing usually focuses on long-term wealth building.
Investment Vehicles:
Stocks: Equity ownership in companies.
Bonds: Fixed-income securities.
Mutual Funds: Pooled investments managed by professionals.
ETFs: Funds that track indices and can be traded like stocks.
Real Estate: Property investments.
Investment Strategies:
Value Investing: Buying undervalued stocks.
Growth Investing: Investing in companies with high growth potential.
Dividend Investing: Focusing on stocks that provide regular income.
Risk Management in Investing:
Diversification across sectors and asset classes.
Regular portfolio rebalancing.
Long-term focus to absorb short-term volatility
