Institutional Trading Trading is the act of buying and selling financial instruments like stocks, bonds, currencies, commodities, and derivatives with the goal of making a profit. Traders operate in various markets, including stock markets, forex markets, commodity markets, and cryptocurrency markets. Trading is often contrasted with investing, which is generally focused on long-term wealth accumulation.
There are different types of traders:
Day Traders: Buy and sell securities within the same trading day.
Swing Traders: Hold positions from a few days to several weeks.
Scalp Traders: Execute dozens to hundreds of trades in a day, aiming for small profits.
Position Traders: Hold trades for months or even years, blending trading and investing.
Trading can be driven by technical analysis, fundamental analysis, or a combination of both. Traders use a wide array of tools and strategies to analyze price movements and market trends.
Techincalanalysis

Institutional TradingInstitutional Investment Process
Setting Objectives: Determining risk tolerance, return targets, and time horizons.
Asset Allocation: Dividing the portfolio among different asset classes.
Security Selection: Choosing individual investments.
Portfolio Monitoring: Continuously reviewing performance and risk.
Institutional Trading
Institutional trading refers to the buying and selling of securities in large volumes by institutions.
Types of Institutional Traders
Proprietary Traders: Trade with the institution's own money.
Agency Traders: Execute trades on behalf of clients.
Program Traders: Use algorithms to trade baskets of stocks.
Trading Venues
Exchanges: NYSE, NASDAQ, etc.
Dark Pools: Private exchanges for large orders.
Over-the-Counter (OTC): Direct trading without an exchange.

Advantages of Institutional Option TradingAdvantages of Institutional Option Trading
Institutional Investing
Institutional investing is the process of managing large-scale investment portfolios with long-term goals.
Investment Objectives
Capital Preservation: Maintaining the value of assets.
Capital Appreciation: Growing the portfolio over time.
Income Generation: Providing steady returns through dividends or interest.

Institutional Option Trading Institutional Option Trading
Institutional option trading involves using options as part of sophisticated strategies to hedge risk, enhance returns, or speculate.
Objectives of Institutional Option Trading
Hedging: Protecting large portfolios against market downturns.
Income Generation: Selling options to collect premiums.
Speculation: Taking directional bets with options.
Arbitrage: Exploiting price inefficiencies across markets.
Common Institutional Option Strategies
Covered Call Writing: Selling call options against stock holdings to generate income.
Protective Puts: Buying puts to insure portfolios against downside risk.
Spreads (Vertical, Horizontal, Diagonal): Limiting risk while aiming for a defined profit range.
Straddles and Strangles: Betting on volatility, regardless of market direction.
Iron Condors: Selling out-of-the-money calls and puts to profit from low volatility.

NSE:BAYERCROP - MOVING FURTHER UP.Stock Summary : Bayer CropScience is engaged in Agri Care business which primarily includes manufacture, sale and distribution of insecticides, fungicides, herbicide and various other agrochemical products and corn seeds.
Technical Setup :
Bayer Crop on daily time frame crossed and closed above a important level of 6259.70. The Stock has been moving on the upside continiously on a daily time frame which clearly shows buyers strength.
The Stock was in a consilidation zone since Feburary 2025 till May 2025 and finally on May 27 2025 the stock opened gap up with high volume confirming it which is nothing but a Runaway gap.
The Higher level of 5,302.95 level which acted as a resistance druring consolidation was retested after few days and the stock witnessed buying again ultimately crossing an important level of 6259.70 as mentined above.
Indicators :
MACD indicator already above central line and positive crossover indicates a positive monetum to continue.
ADX indicator is at 36.31 along with +DI above - DI whcih shows strength in upside direction.
ATR(Average True Range) is rising which signals volatilty increasing and is at 184.56 which means aveage movement of the stock is near 184.56.
Now, Once the stock moves above 6368.50 level and gives a close above it a upside towards R1- 6,558.00 can be seen on the charts and next level would be R2 - 6722.10. A support on the downside would be S1 -6187.35
Support and Resitance Levels :
R1 - 6368.50 S1 - 6259.70
R2 -6558.00 S2 - 6187.35
R3 - 6722.10
Estimated time to reach Resistance on the upside is expected to be 10-15 days.
Disclaimer : I am not a SEBI REGISTERED RESEARCH ANALYST AND INVESTMENT ADVISER." This analysis is intended solely for informational and educational purposes and should not be interpreted as financial advice. It is advisable to consult a qualified financial advisor or conduct thorough research before making investment decisions.
Like, Comment and Share

CHOLAFIN- Breakout from DTFCHOLAFIN has resistance weakening on the Daily charts and has given a breakout with good volume.
The target of this pattern signals an upside potential of ~10% from the current price level in the medium term.
The stock is trading above its 50- and 100-day simple moving averages (SMAs). The range is more than >1X, and the Volume is also >1X the average.
CMP- Rs. 1628
Est. Entry price ~ 1670
Target Price- Rs1813 ( ~10% upside)
SL -1610
Note- The candle closed isn't very promising, so we have to wait for a stronger move. The promising move should be able to close above 1670.
Disclaimer: This is not a buy/sell recommendation. For educational purpose only. Kindly consult your financial advisor before entering a trade.

RATTANINDIA POWER LTDTechnical View:
Price: ₹14.39 (+3.60%)
Volume: Very strong volume (~645M), indicating institutional interest or strong buying pressure.
EMA: Price is trading well above the EMA – confirms short-term bullish strength.
RSI: Currently at 66.67 – strong positive momentum.
Chart Pattern View:
Price is moving within a well-defined ascending channel.
Recently rebounded from the lower boundary – and now heading toward the upper resistance line.
Candlestick View:
Strong bullish candlestick seen in the current breakout candle.
No upper wick implies buyers were in full control throughout the session.
Buy Opportunity:
Entry Zone: 15.00 above
Target 1: 17.50 (previous swing high).
Target 2: 20.00 ++ (upper channel resistance if momentum continues).
Stop Loss: 12.90 (below breakout level and channel lower band).

Institutional Option Trading Part -4Common Institutional Option Strategies
Covered Call Writing: Selling call options against stock holdings to generate income.
Protective Puts: Buying puts to insure portfolios against downside risk.
Spreads (Vertical, Horizontal, Diagonal): Limiting risk while aiming for a defined profit range.
Straddles and Strangles: Betting on volatility, regardless of market direction.
Iron Condors: Selling out-of-the-money calls and puts to profit from low volatility.
Tools and Platforms
Order Management Systems (OMS): To handle complex orders efficiently.
Execution Management Systems (EMS): For rapid and algorithmic order execution.
Advanced Analytical Software: For options pricing, risk assessment, and scenario analysis.
Advantages of Institutional Option Trading
Ability to execute large trades without significant slippage.
Access to lower fees due to trade volume.
Enhanced risk management capabilities.

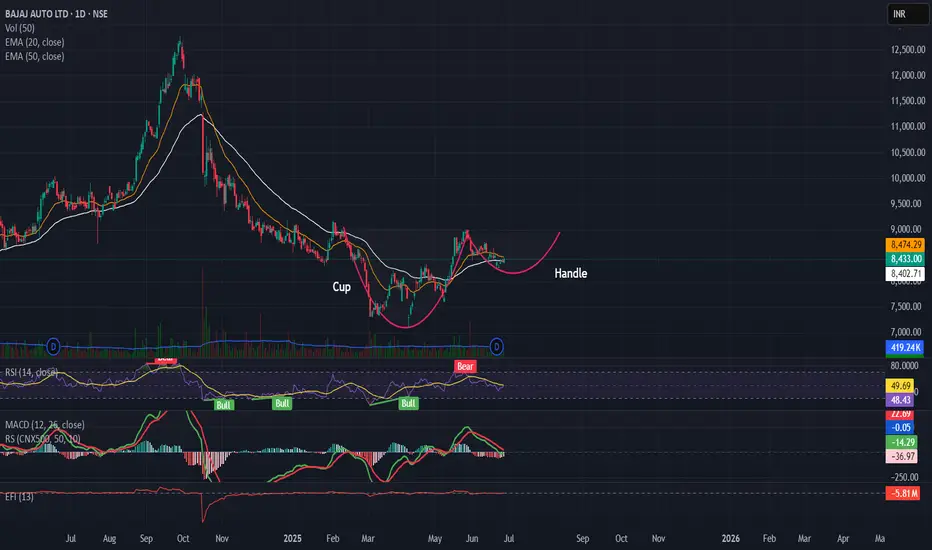
Cup and Handle Pattern in the makingAfter a 9 month long downtrend Bajaj Auto shows signs of reversal with a Cup and Handle pattern in the making with neckline breakout level at 9000
The stock trading close to the 20 and 50 EMA
RSI closing 50
MACD begins to stabalize
Target 11000
stoploss 8250
Learn Institutional Trading Part-10What is Divergence?
Divergence occurs when the price of a stock and an indicator (like RSI, MACD, or momentum indicators) move in opposite directions. It is often considered a warning that the current trend may be losing strength.
Types of Divergence
Regular Divergence:
Indicates potential trend reversal.
Example: Price makes a new high, but RSI makes a lower high.
Hidden Divergence:
Indicates trend continuation.
Example: Price makes a higher low, but RSI makes a lower low.
How to Use Divergence
Combine with support and resistance levels.
Confirm with volume and candlestick patte

Learn Institutional Trading Part-2What is Investing?
Investing involves committing your money to various assets like stocks, mutual funds, gold, real estate, or bonds to grow your wealth over time. Investing is generally a long-term strategy, focusing on the gradual accumulation of wealth.
Key Types of Investments
Stock Market Investments: Buying shares of companies.
Mutual Funds: Pooling money with other investors.
Bonds: Lending money to companies or governments for interest.
Gold & Real Estate: Physical assets that typically grow over time.
Investment Strategies
Value Investing: Buying undervalued stocks.
Growth Investing: Investing in companies with high growth potential.
Dividend Investing: Investing in companies that pay regular dividends.
Benefits of Investing
Builds wealth over time.
Helps fight inflation.
Provides financial security.

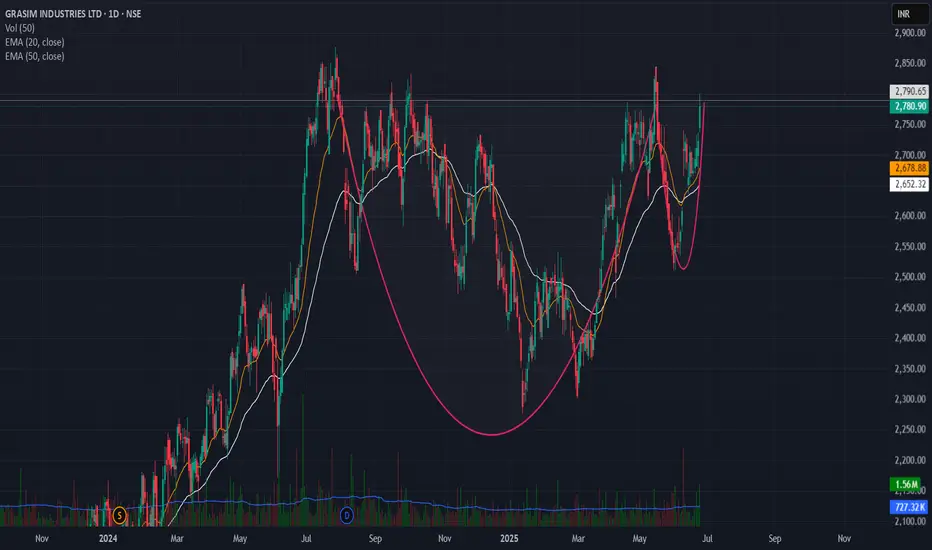
Breakout from cup and handle pattern Grasim Cup and Handle Breakout Setup
Grasim is forming a classic Cup and Handle pattern on the daily chart.
✅ Breakout Level: 2790
🛑 Stoploss: Below 2650 (handle low)
🎯 Target Zone: 3290 (based on depth projection and prior highs)
Pattern Logic:
Rounded cup base indicates accumulation
Handle pullback was shallow with declining volume
Breakout attempt with volume surge
Price above 20 EMA & 50 EMA
RSI > 55 and MACD nearing bullish crossover
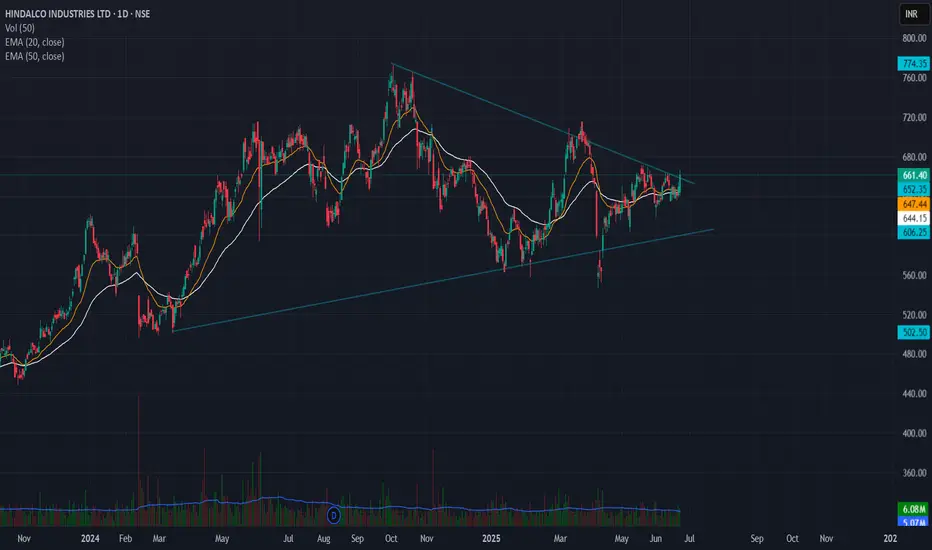
Hindalco Symmetrical Triangle breakout setup🔹 Pattern: Symmetrical Triangle
🔹 Breakout Level: ₹660
🔹 Stoploss: ₹635 (below swing low)
🔹 Target Zone: ₹850 – ₹900
🔹 Risk–Reward: 7.6 – 9.6
🔹 Timeframe: Positional (swing to medium term)
---
📊 Chart Analysis:
Hindalco has broken out of a well-defined symmetrical triangle on the daily chart, with strong price compression followed by bullish breakout confirmation.
The triangle height is ~₹200, projected from the breakout zone, giving a target range of ₹850–₹900.
🧠 Stoploss placed below the last swing low inside the triangle to avoid false breakdown traps.
Learn Institutional Option Trading Part-1Risk and Return in Indian Investments:
Stock Market: High risk, high reward.
Mutual Funds: Moderate risk.
Fixed Deposits and Government Bonds: Low risk, lower returns.
Gold: Medium risk, often used as a hedge.
Factors Influencing Investment Choices:
Risk Appetite
Investment Horizon
Tax Benefits
Liquidity

Learn Institutional Option Trading Part-6Mutual Funds in India:
Mutual funds pool money from multiple investors and invest in a diversified portfolio.
Types:
Equity Mutual Funds
Debt Mutual Funds
Hybrid Funds
Index Funds & ETFs
Systematic Investment Plan (SIP) is a popular method to invest monthly with discipline.
Government Schemes:
PPF (Public Provident Fund)
NSC (National Savings Certificate)
EPF (Employees Provident Fund)
These are safe, tax-efficient, and suitable for conservative investors.

Learn Institutional Option Trading Part-4Recent Growth of Options in India:
Retail participation has surged.
Weekly expiry options (especially on Bank Nifty) have become extremely popular.
SEBI introduced lot size and margin regulations to control excessive speculation.
Investing in India
What is Investing?
Investing means allocating money into assets like stocks, mutual funds, bonds, gold, or real estate to earn returns over time.
Major Investment Options in India:
Equities (Shares)
Mutual Funds
Fixed Deposits
Public Provident Fund (PPF)
Gold (Physical and Digital)
Real Estate
Bonds and Debentures

Learn Institutional Option Trading Part-10Popular Option Strategies in India:
Buying Call Options: Profit when the market rises.
Buying Put Options: Profit when the market falls.
Covered Call: Holding a stock and selling a call option to earn premiums.
Protective Put: Buying a put option to safeguard stock holdings.
Iron Condor: Earning from a range-bound market using multiple options.
Straddle and Strangle: Benefiting from high volatility.

Learn Institutional Option Trading Part-3In India, options are traded primarily on:
NSE (National Stock Exchange)
BSE (Bombay Stock Exchange)
The Securities and Exchange Board of India (SEBI) regulates the derivatives market and ensures fair practices.
Why is Option Trading Popular in India?
Leverage: Traders can control large positions with small capital.
Hedging: Investors use options to protect their portfolios from market fluctuations.
Income Generation: Strategies like covered calls can provide regular income.
Speculation: Traders can bet on price movements with limited risk.

Styrenix Performance Materials Ltd - Breakout Setup, Move is ON.#STYRENIX trading above Resistance of 2485
Next Resistance is at 3295
Support is at 1675
Here are previous charts:
Chart is self explanatory. Levels of breakout, possible up-moves (where stock may find resistances) and support (close below which, setup will be invalidated) are clearly defined.
Disclaimer: This is for demonstration and educational purpose only. This is not buying or selling recommendations. I am not SEBI registered. Please consult your financial advisor before taking any trade.

Institutions Option Database Trading Part-6Deep Dive into Options Basics (For Data Traders)
Options are contracts giving the right but not the obligation to buy or sell an asset at a certain price before a set date. They are used for hedging, speculation, and generating income.
🛠️ Two Types:
Call Option: Right to buy an asset.
Put Option: Right to sell an asset.
Backtesting means testing a strategy using past data to check performance. Key for data-driven option trading.
Example:
Load 1-year option chain data for BANKNIFTY.
Apply rules: Buy Call when IV drops by 10% & PCR < 0.8.
Check PnL for each trade.
Filter for success rate > 65%.

Learn Institution Trading Part -6Introduction to Institutional Option Trading
Institutional option trading refers to the sophisticated strategies used by hedge funds, mutual funds, insurance companies, proprietary trading firms, and foreign institutional investors (FIIs) to manage portfolios, hedge risks, and generate consistent alpha from the derivatives market. Unlike retail traders, institutions operate with large capital, access to advanced technology, and deep market insights, allowing them to structure complex trades.
2. Why Institutions Trade Options
Institutions don’t usually trade options for quick profits. Their trades are designed to meet broader objectives:
Hedging Equity Portfolios
Volatility Trading
Generating Yield on Holdings
Market Making and Arbitrage
Directional or Non-directional Speculation
3. Core Institutional Option Strategies
Let’s explore the most popular strategies that institutions use with real-world logic behind them.
A. Covered Call (Buy-Write)
Use: Income generation from long-term stock holdings
Structure: Buy stock + Sell Call Option (OTM or ATM)
Institutional Use Case:
A mutual fund holding Reliance shares might sell monthly call options against its holdings to generate monthly income (premium), enhancing total returns.

Support and Resistance Support Level:
A price level where demand is strong enough to prevent the price from falling further. It's like a floor—buyers enter here expecting prices to rise.
Example: If Nifty falls to 22,000 repeatedly and bounces back, 22,000 becomes a support level.
🔹 Resistance Level:
A price level where selling pressure overcomes buying, preventing prices from rising. It's like a ceiling—sellers dominate at this level.
Example: If Bank Nifty rises to 50,000 but fails to move above, 50,000 is resistance.
📊 How to Identify Them:
Historical price charts
Trendlines
Moving averages
Fibonacci levels
Volume analysis
📈 Use in Trading:
Buy near support
Sell near resistance
Use breakout strategy when price breaches either level

Advanced Institutions Option Trading - Part 10Option Pricing Models
Institutions rely on theoretical models to value options precisely.
Models Used:
Black-Scholes Model: Most common for European Options
Binomial Model: For American options
Monte Carlo Simulations: For complex path-dependent options
Bachelier Model: For negative rate scenarios
These models help forecast fair value, hedge ratios, and profit probabilities.
🔹 17. Algorithmic and Quant Option Trading
Institutional desks often use automation for efficiency.
Tools & Techniques:
Python, R, C++ for strategy coding
Machine Learning for volatility prediction
Option Flow Analysis (Unusual Orders)
Real-time Gamma Exposure Mapping
Quant desks track Volga, Vanna, Charm, and other second-order Greeks for precise hedging.
