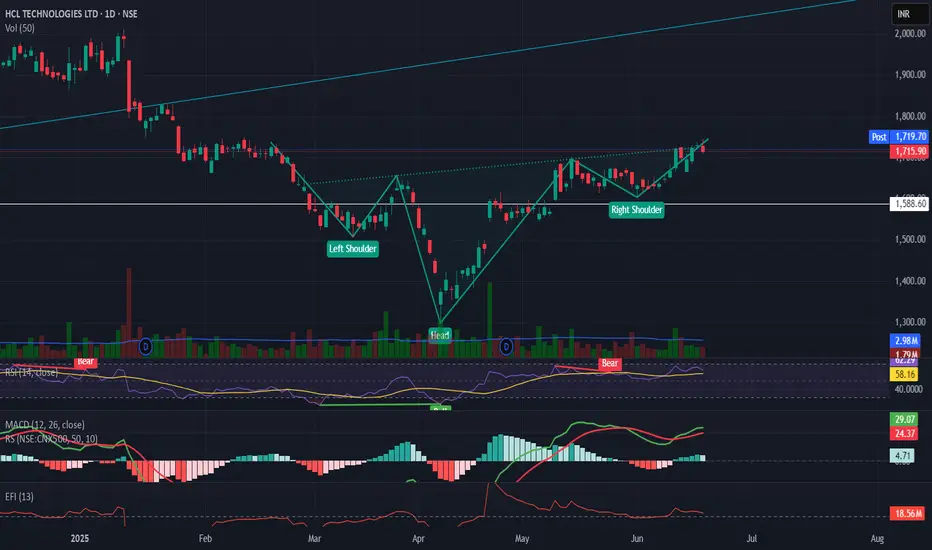
HclTech with inverse head and shoulders patternHclTech is showing six months long inverse head and shoulders pattern with major resistance at 1750.
RSI at 58
MACD is above its signal line and trending higher.
Efi Is above zero and is stable right now
target at 2140-2400 based on the pattern
Techincalanalysis
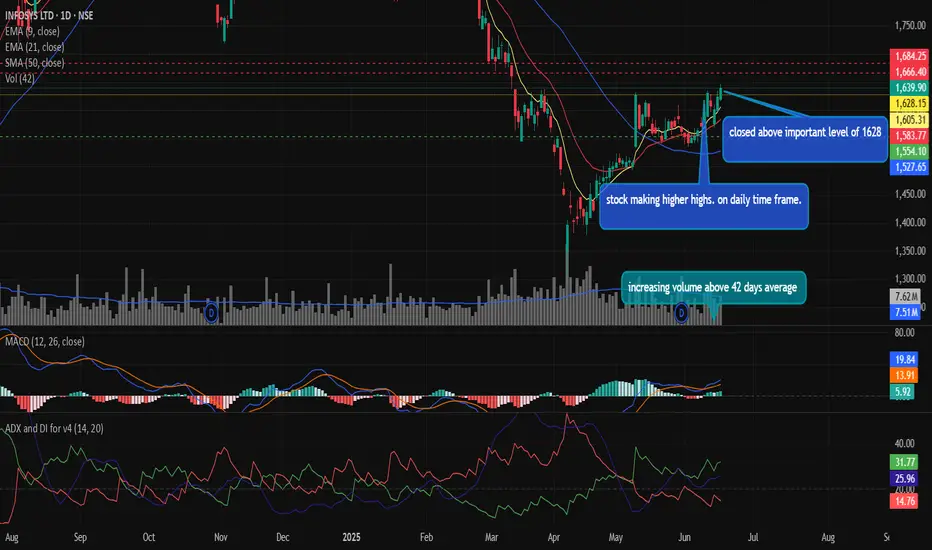
INFOSYS LTD Making higher high trend on daily time frame.Indian IT Sector is witnessing a recovery as most of the IT stocks closed on a postive note. Infosys Ltd being one of the secotral leader is seen making higher highs and higher lows trend on daily time frame as the with above average volume of 42 days (approx 2 Months).
The stock has closed above an important level of 1628 which acted as a hurdle. Now the stocks has suatianed above 1628 level a next resistance level of 1666.40 and 1684.25 seems to be achivabele.
MACD Indicator is alredy trading above zero line which signals postive momentum and alog with it ADX indicator is at 25.95 where +DI is trading above -DI which indicates strenghth in momentum.
let me know your thought in comment below.
Option Trading Master class Part -6What is Option Trading?
Definition:
Options are derivative contracts that give the holder the right, but not the obligation, to buy or sell an asset at a pre-decided price within a specific timeframe.
Types of Options:
Call Option: Right to buy
Put Option: Right to sell
Option Participants:
Buyers (Holders): Limited risk, unlimited reward
Sellers (Writers): Limited reward, unlimited risk
How Options Work (With Example)
Imagine Reliance stock is trading at ₹2,500.
Call Buyer: Buys a ₹2,500 Call Option by paying ₹50 premium
Scenario A (Stock goes to ₹2,600):
Intrinsic value = ₹100
Profit = ₹100 – ₹50 = ₹50 per share
Scenario B (Stock goes to ₹2,400):
Option expires worthless
Loss = ₹50 (premium paid)

Option Trading Master class Part -7Fundamentals of Stock Investing
Types of Investors:
Value Investors: Focus on undervalued companies
Growth Investors: Target high-growth potential stocks
Dividend Investors: Prefer regular income from dividends
Research Parameters:
Earnings per Share (EPS)
Price-to-Earnings Ratio (P/E)
Return on Equity (ROE)
Debt-to-Equity Ratio
Industry Trends
Tools for Investing:
Demat and Trading Account
Research Platforms (e.g., TradingView, Screener.in)
Portfolio Tracker (e.g., Zerodha Console)

Advanced Technical Master classMulti-Timeframe Analysis involves analyzing multiple chart timeframes (Monthly, Weekly, Daily, 4H, 1H) to confirm trend direction and improve timing accuracy.
Application:
Identify long-term trend (Monthly/Weekly)
Use Daily/4H for entry signals
Filter noise with lower timeframes
Key Tools: Moving Averages, Trendlines, MACD
Module 2: Advanced Chart Patterns
Key Patterns Covered:
Harmonic Patterns (Gartley, Bat, Crab)
Elliott Waves (Impulse & Corrective Waves)
Wyckoff Method (Accumulation/Distribution Phases)
Practical Use:
Pattern + Volume = Strong Entry
Combine with Fib levels for reversal confirmation
Module 3: Volume Price Analysis (VPA)
Core Principle:
Volume precedes price. Learn to read volume spikes, absorption, and exhaustion.
Indicators to Use:
On Balance Volume (OBV)
Volume Profile
VWAP

Institution Option Trading Part-7Regulatory & Risk Considerations
SEBI (India) & SEC (US) regulations limit speculative exposure.
Institutions must report Open Interest, Position Limits, Margin Usage.
Must adhere to VaR (Value at Risk) frameworks and internal risk policies.
Institutional Trading during Events
Earnings Seasons: Institutions use straddles/strangles for earnings plays.
Budget or RBI Policy: Protective collars/volatility trades.
Global Crisis (e.g. COVID): Use of massive protective puts (SPX, NIFTY).
VIX & Institutional Behavior
India VIX plays a vital role in determining institutional option strategies.
High VIX = buying protection, long gamma strategies.
Low VIX = selling premium, income strategies.

Institution Option Trading Part-2.0Institutional Order Flow – Market Impact
Option Flow as Signal: Large trades in options market may indicate upcoming moves in underlying assets.
Unusual Options Activity (UOA): Tracked by smart money traders to anticipate institutional moves.
Dark Pools: Institutions often use off-exchange mechanisms to avoid price impact.
Tools & Analytics Used by Institutions
Volatility Surface Analysis
Greeks Sensitivity Scans (Delta, Gamma, Vega, Theta)
Skew Charts & Term Structure
Trade Cost Analysis (TCA)
Liquidity Heatmaps
Algo Execution Strategies (TWAP, VWAP)

Institution Option Trading Part-6Introduction to Institutional Option Trading
Institutional option trading refers to the use of options by large financial institutions such as hedge funds, pension funds, insurance companies, mutual funds, and proprietary trading desks to manage risk, enhance returns, or speculate on price movements. Unlike retail traders, institutions bring scale, research, and complex strategies to the options market.
Slide 2: Key Characteristics of Institutional Traders
Large Capital Base: Institutions trade in bulk with millions or billions of dollars.
Data Advantage: Access to premium data, analytics, and predictive algorithms.
Advanced Infrastructure: High-frequency execution systems, smart order routing.
Risk Management Focus: Use options for hedging equity, credit, FX, or commodity exposure.
Regulatory Boundaries: Subject to risk limits, compliance, and disclosures

Institution Option Trading Part-5Popular Strategies Tested via Option Database
IV Crush Earnings Strategy
Buy/sell options before earnings when IV is high, expecting post-earnings IV drop.
High OI Breakouts
Trade breakouts from strikes with high OI using price+OI correlation.
Skew Arbitrage
Analyze IV skew and trade underpriced/overpriced strikes accordingly.
Time Decay Capture (Theta)
Sell options with high Theta before expiry using historical decay rates.
💡 Advantages of Option Database Trading
Quantitative Edge: Allows logic-based decisions over emotion-driven trades.
Backtesting Confidence: Know the probability of success before risking capital.
Scalability: Can analyze hundreds of symbols and expiry combinations.
Automation Ready: Can link with brokers to run fully algorithmic systems.

Institution Option Trading Part-3How Option Database Trading Works (Step-by-Step)
Step 1: Data Collection
Real-time data from NSE, BSE, CBOE, or broker APIs (Zerodha, Interactive Brokers, etc.).
Store tick-level or EOD snapshots into SQL/NoSQL databases.
Step 2: Data Cleaning & Normalization
Remove missing values, align timestamps, convert formats.
Normalize values like IV to make models consistent.
Step 3: Exploratory Data Analysis (EDA)
Use Python (Pandas, Matplotlib) or R to analyze:
Option volume spikes
Volatility contraction/expansion
Unusual OI build-ups
Step 4: Backtesting Trading Strategies
Strategies like Straddle, Strangle, Iron Condor, or IV Crush are tested.
Entry/exit logic coded, and trades simulated on historical data.
Step 5: Deploying Models
Successful strategies get automated using APIs or Trading Bots.
Regular performance metrics tracked and refined.

Option Trading with Professionals Why is Option Data Important?
Pattern Recognition: Historical data helps spot repeatable patterns across expiry dates, strikes, or underlyings.
Volatility Analysis: IV and HV trends assist in detecting overpriced or underpriced options.
Liquidity Study: OI and Volume data help identify where smart money is moving.
Strategy Development: Backtesting using past data validates the strength of a strategy before real capital is deployed.
Market Sentiment Gauge: Changes in IV, OI, and skew can reflect trader sentiment and possible direction.
🧰 Core Components of an Option Database
A fully functional options database setup typically includes:
1. Options Chain Data
Captures details like Strike Price, Expiry Date, LTP, IV, Bid/Ask Spread, Greeks.
Should be stored with timestamps and unique IDs for reference.
2. Open Interest & Volume History
Time-series data showing how OI and volume evolved intraday and over time.
3. Volatility Surfaces
3D models showing how IV changes with strike and time to maturity.
4. Underlying Asset Data
Historical prices, volume, dividends, splits, news events, and earnings.
5. Event Tags
Earnings announcements, economic reports, corporate actions tagged for context during backtesting.

Institution Option Trading Part-1In today’s fast-paced financial world, where milliseconds can make a difference, Option Database Trading has become an essential tool for serious traders, quantitative analysts, and institutional investors. This strategy revolves around using structured historical and real-time data from the options market to make informed, data-driven trading decisions.
This guide will help you understand what Option Database Trading is, how it works, what tools are required, and how it can significantly improve your edge in the options market.
📊 What is Option Database Trading?
Option database trading involves the systematic storage, analysis, and utilization of large datasets from the options market to find patterns, identify opportunities, and execute trades. It typically includes:
Historical Option Prices
Implied Volatility (IV) & Historical Volatility (HV)
Open Interest (OI) & Volume
Greeks (Delta, Theta, Vega, Gamma, Rho)
Option Chain Snapshots
Corporate Actions, Earnings, News Impact
By creating or accessing an options data warehouse, traders can backtest strategies, run simulations, and refine their models using real market data.

Trading Road Map 1. Foundation Stage (Beginner Level)
Understand Markets: Equity, Commodity, Forex, Derivatives
Basic Concepts: What is a stock, index, option, futures
Learn Platforms: TradingView, Zerodha, Upstox
Risk Awareness: Avoid FOMO, control emotions, capital safety
🔹 2. Skill Building Stage (Intermediate Level)
Technical Analysis: Charts, Patterns, Indicators (MACD, RSI, Moving Averages)
Fundamental Analysis: Earnings, Balance Sheets, PE ratio
Paper Trading: Practice without risking money
Journaling: Track trades, wins/losses, and learn from mistakes
🔹 3. Strategy Development (Advanced Level)
Create Systems: Scalping, Swing, Positional
Options Mastery: Strategies like Iron Condor, Straddle, Spread
Risk Management: Position sizing, SL rules, R:R ratio
Backtesting: Validate your strategy on historical data
🔹 4. Execution & Scaling (Pro Level)
Discipline & Psychology: Stick to plans, stay unemotional
Automation & Tools: Algo Trading, Screeners
Capital Scaling: From ₹10K to ₹10L+ systematically
Diversification: Trade across assets, build passive income

Trading with Experts What is Option Trading?
Option trading is a financial strategy where traders buy and sell options contracts — financial instruments that derive value from underlying assets like stocks or indices. Each option gives the buyer the right (not obligation) to buy (Call) or sell (Put) at a specified price before expiry.
🔹 Types of Options:
Call Option – Right to Buy
Put Option – Right to Sell
Index Options – Based on Nifty, Bank Nifty, etc.
Stock Options – Based on individual stocks (e.g., Reliance, HDFCBANK)
🔹 Key Components:
Strike Price – Agreed price to buy/sell
Premium – Price paid for the option
Expiry Date – Validity of the contract
Lot Size – Fixed quantity of shares per contract
ITM, ATM, OTM – In-the-money, At-the-money, Out-of-the-money
🔹 Why Trade Options?
✅ Leverage with less capital
✅ Hedging portfolio risk
✅ Strategic plays (Bullish, Bearish, Neutral)
✅ Income generation via selling options

Option Trading Master ClassOption Trading Master Class – Overview
🔹 Module 1: Basics of Options
What are Options? (Call vs Put)
Terminologies: Strike Price, Premium, Expiry, Lot Size
European vs American Options
🔹 Module 2: Options Pricing & Greeks
Intrinsic vs Extrinsic Value
Option Greeks: Delta, Gamma, Theta, Vega, Rho
How volatility affects option price
🔹 Module 3: Strategies for Beginners
Covered Call, Protective Put
Bull Call Spread, Bear Put Spread
Pros & Risks of each strategy
🔹 Module 4: Advanced Strategies
Iron Condor, Straddle, Strangle
Butterfly Spreads, Calendar Spreads
Adjusting positions for risk
🔹 Module 5: Live Market Application
Using Option Chain Analysis
Open Interest & Volume Interpretation
Entry/Exit points with technical support
🔹 Module 6: Psychology & Risk Management
Avoiding overtrading & expiry traps
Position sizing, SL rules
Emotional discipline in volatile markets

Advanced Institutions Level Trading || Part- 8Option Trading with India VIX and Nifty 50 in India
Introduction
Option trading in India has gained significant popularity in recent years, particularly among retail traders and institutional investors. Among the various instruments available, the Nifty 50 index options are the most traded due to their high liquidity and volatility. However, one key tool that helps traders make informed decisions in the options market is the India VIX (Volatility Index). Understanding the relationship between India VIX and Nifty 50 can give traders a strategic edge.
What Is Nifty 50?
The Nifty 50 is the benchmark index of the National Stock Exchange (NSE) of India. It comprises 50 of the largest and most liquid Indian stocks across sectors. The index represents the broader market and is widely used for benchmarking mutual funds, index funds, ETFs, and derivatives like futures and options.
Nifty 50 options are contracts that derive their value from the index itself. These contracts can be used to speculate on market direction, hedge positions, or generate income through strategies like writing options.
What Is India VIX?
The India VIX (Volatility Index) measures the market’s expectation of volatility over the next 30 calendar days. It is calculated based on the order book of Nifty 50 options. The index represents the degree of fear or complacency among market participants.
High India VIX: Indicates high expected volatility; usually occurs in uncertain or bearish market conditions.
Low India VIX: Indicates low expected volatility; typically seen in stable or bullish markets.
India VIX is also called the "fear gauge" of the Indian stock market, similar to the CBOE VIX in the U.S. markets.
Why India VIX Matters in Option Trading
Option prices are driven by several factors, primarily the underlying price, time to expiry, interest rates, dividends, and implied volatility (IV). India VIX is a real-time proxy for implied volatility in the Indian market, especially for Nifty 50 options.
Higher IV = Higher Option Premiums: When India VIX rises, option prices go up due to higher expected volatility.
Lower IV = Lower Premiums: When VIX drops, options become cheaper as volatility expectations fall.
Understanding India VIX helps traders anticipate how option premiums may behave and adjust their strategies accordingly.

Option Trading with Option chainIf you're looking for a simple options trading definition, it goes something like this: Options trading gives you the right or obligation to buy or sell a specific security on or by a specific date at a specific price. An option is a contract that's linked to an underlying asset, such as a stock or another security.
Options trading also involves two parties: the holder (buyer) and the writer (sometimes called the seller). Holders are investors who purchase contracts, while writers create them. The holder pays the writer a premium for the right to sell or buy a stock by a certain date.

Option Trading with Option chain part -3Example of an Option. Suppose that Microsoft (MFST) shares trade at $108 per share and you believe they will increase in value. You decide to buy a call option to benefit from an increase in the stock's price. You purchase one call option with a strike price of $115 for one month in the future for 37 cents per contract ...
Ans: Options contracts are of two types; Call options and Put options. However, they can differ based on their underlying assets and expiration date.

Technical Cass 9Hammer:
Doji :
Three-white soldiers:
Bullish Engulfing:
Tweezer Bottom:
How to confirm candlestick pattern?
Here are two reliable methods for confirming candlestick patterns with indicators:
MACD: A bullish crossover occurring alongside a bullish candlestick strengthens the case for upward movement.
RSI: Divergence between price and RSI can signal potential reversals, especially when aligned with candlestick patterns.

Option trading Who is the youngest successful stock trader in the world? 5 Youngest Stock Traders Ashu Sehrawat At only 22 years old, the self-made millionaire has created a name for himself as one of India's top stock traders.
Selling options spreads is one such strategy that fits the bill. It's often seen as one of the lowest risk option strategies because it allows you to have a pre-determined capped loss risk when trading. This way, you're not only minimizing risk but also generating income.

Database TradingIf you're looking for a simple options trading definition, it goes something like this: Options trading gives you the right or obligation to buy or sell a specific security on or by a specific date at a specific price. An option is a contract that's linked to an underlying asset, such as a stock or another security.
The long straddle is the best strategy for option trading that consists of purchasing an In-The-Money call and putting options with the same underlying asset, strike price, and expiration date. Profit potential is infinite in this method, while loss potential is limited.

Option Trading Part-7If you're looking for a simple options trading definition, it goes something like this: Options trading gives you the right or obligation to buy or sell a specific security on or by a specific date at a specific price. An option is a contract that's linked to an underlying asset, such as a stock or another security.
The Indian stock market has witnessed significant growth in recent decades, transforming from a manually operated environment to a digital, highly regulated, and globally integrated system. Among the many financial instruments available, options trading has emerged as one of the most dynamic and potentially rewarding strategies for traders and investors.

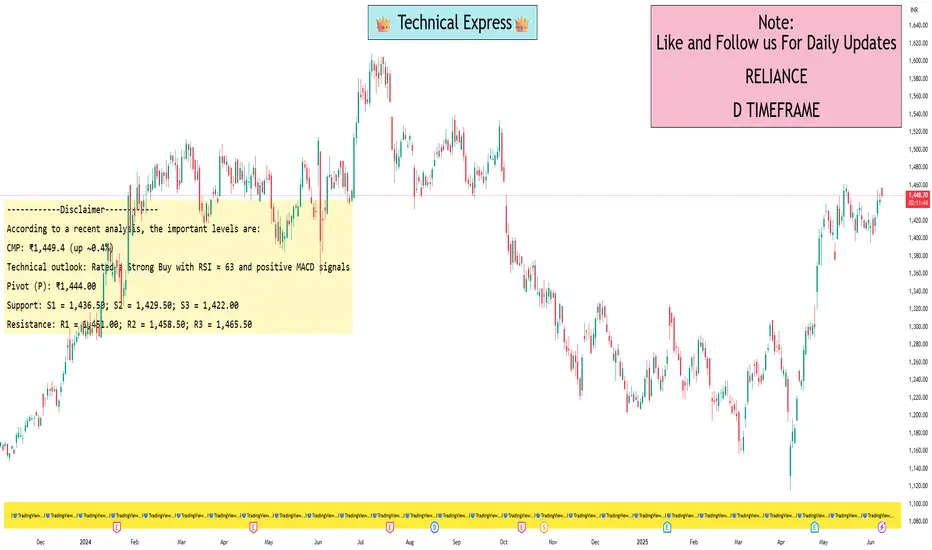
Reliance levels for swing tradingAccording to a recent analysis, the important levels are:
Current Price & Context
-- CMP: ₹1,449.4 (up ~0.4%)
-- Technical outlook: Rated a Strong Buy with RSI ≈ 63 and positive MACD signals
Pivot & CPR Levels
Daily (Classic) Pivot Points
Pivot (P): ₹1,444.00
Support: S1 = 1,436.50; S2 = 1,429.50; S3 = 1,422.00
Resistance: R1 = 1,451.00; R2 = 1,458.50; R3 = 1,465.50
Daily CPR:
Bottom Central (BC) = 1,444.25
Central = 1,444.00
Top Central (TC) = 1,443.75
Weekly Pivot Points
Pivot: ₹1,431.27
Support: S1 = 1,407.83; S2 = 1,372.17
Resistance: R1 = 1,466.93; R2 = 1,490.37