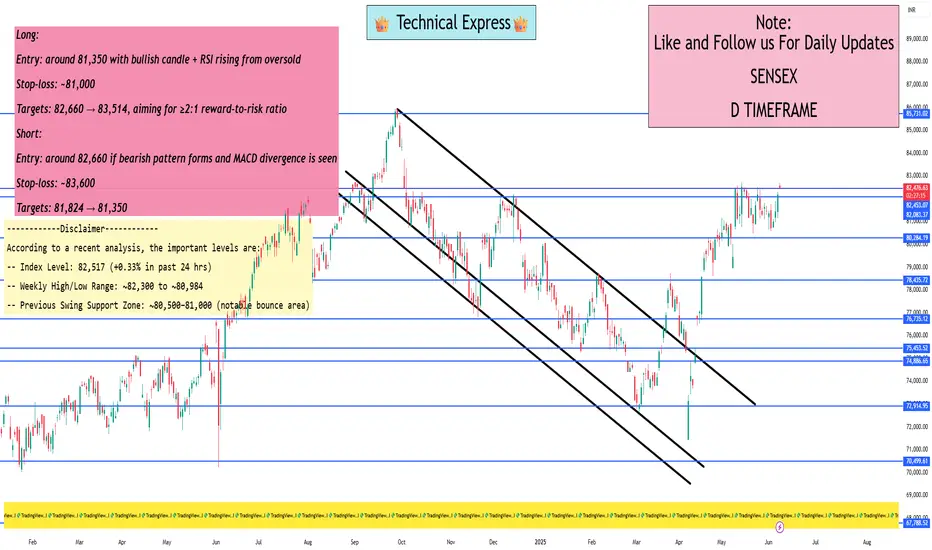
Sensex levels for swing tradingAccording to a recent analysis, the important levels are:
Index Level: 82,517 (+0.33% in past 24 hrs)
Weekly High/Low Range: ~82,300 to ~80,984
Previous Swing Support Zone: ~80,500–81,000 (notable bounce area)
Long:
Entry: around 81,350 with bullish candle + RSI rising from oversold
Stop‑loss: ~81,000
Targets: 82,660 → 83,514, aiming for ≥2:1 reward-to-risk ratio
Short:
Entry: around 82,660 if bearish pattern forms and MACD divergence is seen
Stop‑loss: ~83,600
Targets: 81,824 → 81,350
Techincalanalysis
Banknifty levels for swing tradingAccording to a recent analysis, the important levels are:
Trend‑deciding pivot: 56,713
Primary resistance zones: 56,948, 57,184, 57,420, 57,666
Support zones: 56,578, 56,241, 55,706, 55,534
A dip toward 56,578–56,713 is a potential long entry, targeting 56,948 and beyond.
A break below 56,241 opens doors to deeper support around 55,700–55,500.

Nifty-50 levels for swing tradingAccording to a recent analysis, the important levels are:
Trend‑deciding pivot: 25,064
Resistance (R): 25,142 → 25,221 → 25,299 → 25,343 → 25,416
Support (S): 24,985 → 24,907 → 24,828 → 24,750 → 24,671
Weekly Pivot: ~24,844
R1: ~25,187, R2: ~25,372; S1: ~24,661, S2: ~24,317

India’s Growth Story & Sectoral RotationTopic: India’s Growth Story & Sectoral Rotation
Slide 1: Introduction to India’s Growth Story
India is one of the world’s fastest-growing major economies. With strong demographics, reform-driven policies, and rising consumption, India is projected to become the third-largest economy by 2030.
Key Drivers of Growth:
Youth population & rising middle class
Government capex & infrastructure push
Tech innovation & digital economy
Global supply chain diversification (China+1)
Slide 2: Macroeconomic Tailwinds
✅ Stable GDP growth (6.5–7.5% range)
✅ Controlled inflation & improving fiscal health
✅ Strong forex reserves
✅ Structural reforms (GST, IBC, PLI schemes)
✅ FDI inflows & domestic manufacturing boost
Slide 3: Understanding Sectoral Rotation
Sectoral rotation is the shift in investor preference from one sector to another based on economic cycles, interest rates, or valuation changes. Smart investors track these rotations to maximize returns.
Why It Matters:
Not all sectors perform at the same time
Aligns portfolio with macro & earnings trends
Helps avoid underperforming sectors
Slide 4: Economic Cycle vs. Sector Performance
Economic Phase = Leading Sectors
Early Recovery = Auto, Capital Goods
Mid Expansion = Banking, Infra, IT
Peak FMCG, = Pharma
Slowdown Utilities, = Healthcare
Rotation typically happens quarterly to annually, often influenced by budget, RBI policy, and global cues.
Slide 5: Recent & Future Sector Trends
2023-2024 Themes:
Capital Goods & Infra: Capex surge
PSU Banks: Balance sheet revival
Defence & Railways: Govt-led spending
IT & FMCG: Facing margin pressure, expect rotation soon
Green Energy & EV: Emerging megatrends
2025 Outlook:
Watch for rotation into Financials, Consumption, Manufacturing, and selective Midcaps as earnings visibility improves.
Slide 6: Smart Investment Strategies
🔹 Use Sectoral/Thematic Mutual Funds or ETFs
🔹 Monitor quarterly earnings and sectoral updates
🔹 Combine with Smart SIP & dynamic asset allocation
🔹 Stay updated with policy announcements (Union Budget, RBI)
Smart SIP Strategy & Mutual Fund SelectionTopic: Smart SIP Strategy & Mutual Fund Selection
Slide 1: Introduction to Smart SIP Investing
A Systematic Investment Plan (SIP) helps investors build wealth gradually by investing fixed amounts in mutual funds at regular intervals. A “Smart SIP” goes beyond just monthly investing — it optimizes fund selection, timing, and asset allocation for better returns with lower risks.
Slide 2: What is a Smart SIP?
Traditional SIP vs. Smart SIP:
Traditional SIP invests the same amount monthly, regardless of market condition.
Smart SIP adjusts the investment amount based on market volatility, valuation, or technical indicators.
Smart SIP Components:
Dynamic contribution (more in dips)
Tactical asset allocation (equity, debt, gold)
Fund rebalancing every 6–12 months
Slide 3: Benefits of Smart SIP
✅ Enhances returns through market timing
✅ Reduces downside risk during bear phases
✅ Better rupee cost averaging
✅ Psychological edge (disciplined but flexible investing)
Slide 4: Mutual Fund Selection Criteria
When choosing funds, consider:
Category (Large-cap, Flexi-cap, Mid-cap, etc.)
Fund Manager Performance (Consistency over 3–5 years)
Expense Ratio (Lower = better returns)
Portfolio Quality (Diversification, sector exposure)
Fund Ratings (Morningstar, CRISIL, Value Research)
Slide 5: Types of Funds to Combine in a Smart SIP
Large Cap Fund – Stability & consistent returns
Flexi-Cap Fund – Dynamic across market cap
Mid/Small Cap Fund – Higher growth (add with caution)
Debt Fund – Hedge during market volatility
Thematic/Sectoral Fund – Optional, high-risk/high-reward
Slide 6: Ideal Smart SIP Strategy
🔹 Step 1: Allocate based on age & risk profile
🔹 Step 2: Use staggered investing — more in market dips
🔹 Step 3: Track fund performance quarterly
🔹 Step 4: Rebalance portfolio every 6–12 months
🔹 Step 5: Exit or reduce allocation when valuations are extreme

Dividend Investing & High-Yield StocksTopic: Dividend Investing & High-Yield Stocks
Slide 1: Introduction to Dividend Investing
What is Dividend Investing?
Dividend investing involves buying shares of companies that regularly pay out a portion of their earnings to shareholders. These payments, called dividends, are usually distributed quarterly and serve as a steady income source.
Why It Matters:
Generates passive income
Offers compounding returns when reinvested
Often signals strong, stable companies
Ideal For:
Long-term investors
Income-focused portfolios
Retirees looking for stable cash flow
Slide 2: Understanding High-Yield Stocks
Definition:
High-yield stocks offer a dividend yield significantly higher than the market average. Yield = Dividend per Share ÷ Share Price.
Pros:
Higher income returns
Potential price appreciation
Strong incentive for holding
Risks:
Yield traps (unsustainable payouts)
Sector-specific concentration (REITs, utilities)
Sensitivity to interest rate changes
Slide 3: Key Metrics to Analyze
1. Dividend Yield – High isn't always better; compare with industry peers.
2. Payout Ratio – % of earnings paid as dividends (ideal: <60%).
3. Dividend History – Consistent and increasing dividends show reliability.
4. Free Cash Flow – Enough cash to support future dividends.
5. Debt Levels – Too much debt may affect dividend sustainability.
Slide 4: Popular High-Yield Sectors
REITs (Real Estate Investment Trusts)
Utilities
Telecom
Energy/Oil & Gas
MLPs (Master Limited Partnerships)
These sectors often have regulated income or asset-backed cash flow streams, making them stable dividend payers.
Slide 5: Example High-Yield Stocks (India & Global)
India:
Coal India
Power Grid Corp
REC Ltd
ITC Ltd
Global:
AT&T
Verizon
Realty Income Corp (O)
Altria Group (MO)
Ensure to check for recent financial updates before investing.
Slide 6: Dividend Growth vs High Yield
Dividend Growth Stocks: Lower yield, but consistent increases (e.g., Infosys, HDFC Bank)
High-Yield Stocks: High immediate income, but riskier if growth lags
Balanced Approach: Combine both types for income and capital growth.

Open Interest & Option Chain Analysis Topic: Open Interest & Option Chain Analysis
1: What is Open Interest (OI)?
Simple Meaning:
Open Interest means the total number of active option or futures contracts in the market that haven’t been closed yet.
Easy Example:
If you and your friend enter into a new option trade, the open interest is 1. If someone else joins with a new trade, it becomes 2. But if you close your trade, it becomes 1 again.
What It Tells You:
If OI is increasing, more people are joining the market.
If OI is decreasing, traders are exiting their trades.
Combine OI with Price Movement:
Price going up + OI going up = New buying → Bullish
Price going down + OI going up = New selling → Bearish
Price going up + OI going down = Traders exiting shorts → Short covering
Price going down + OI going down = Traders exiting longs → Profit booking
2: What is an Option Chain?
Simple Meaning:
Option Chain is a table that shows all the call and put options for a stock at different strike prices.
What You’ll See in an Option Chain:
Strike Price: The price you agree to buy/sell.
Calls (CE): Right to buy.
Puts (PE): Right to sell.
Open Interest (OI): How many contracts are active.
Volume: How many were traded today.
LTP: Latest price of that option.
3: How to Read Option Chain Like a Pro
1. Spot the Support Levels:
Look for the highest OI on the put (PE) side → Big money sees this as support.
2. Spot the Resistance Levels:
Look for the highest OI on the call (CE) side → Traders think price won't go above this.
3. Track Market Mood:
If more puts are being written (PE OI going up) → Traders are bullish.
If more calls are being written (CE OI going up) → Traders are bearish.
4. PCR (Put Call Ratio):
PCR > 1 → More puts than calls = Bullish
PCR < 1 → More calls than puts = Bearish

Advance Institutions Option Trading - Lecture 5When it comes to low risk options strategies, selling a call spread and selling a put spread are techniques that traders often utilize. These strategies are characterized by a high probability of profit due to the low probability of loss, and they limit risk in case the trade doesn't go as planned.
While day traders look at minute-to-minute price changes, swing traders look at trends that play out over several days. This is considered one of the most profitable trading types that allows more flexibility, as you don't need to be glued to your computer screen all day.

Advance Institutions Option Trading - Lecture 1Institutional traders are professionals trading for large entities like mutual funds, hedge funds, etc. Oftentimes they will trade options to hedge their positions, but they may also trade options as pure speculation.
Equirus Securities is one of the leading domestic institutional equities brokerage firms in India with more than 180 companies under over coverage and empanelment with almost all domestic institutions and many leading FIIs.

Cummins India: Technical + Fundamental BreakdownIn this video, I dive into Cummins India, combining technical analysis with key fundamental insights. I cover chart patterns, volume action, support/resistance zones, and recent financial performance to help identify a potential investing & swing trade opportunity.
🔍 Perfect for traders who want both data and conviction behind their trades.
Watch, learn, and trade smarter.

JKLAKSHMI CEMENT - Bullish Inverted H&S Breakout (Daily T/F)Trade Setup
📌 Stock: JK Lakshmi Cement ( NSE:JKLAKSHMI )
📌 Trend: Strong Bullish Momentum
📌 Risk-Reward Ratio: 1:3 (Favorable)
🎯 Entry Zone: ₹862 (Breakout Confirmation)
🛑 Stop Loss: ₹807 (Daily Closing Basis) (~6.4% Risk)
🎯 Target Levels:
₹899.60
₹938.85
₹979.80
₹1,022.50 (Final Target)
Technical Rationale
✅ Bullish Inverted H&S Breakout - Classic reversal pattern confirming uptrend continuation
✅ Strong Momentum - Daily & Weekly RSI >60 (Bullish zone)
✅ Volume Confirmation - Breakout volume 376K vs previous day's 193K (Nearly 2x surge)
✅ Multi-Timeframe Alignment - Daily and weekly charts showing strength
Key Observations
• The breakout comes with significantly higher volume, validating strength
• Well-defined pattern with clear neckline breakout
• Conservative stop loss at recent swing low
Trade Management Strategy
• Consider partial profit booking at each target level
• Move stop loss to breakeven after Target 1 is achieved
• Trail stop loss to protect profits as price progresses
Disclaimer ⚠️
This analysis is strictly for educational purposes and should not be construed as financial advice. Trading in equities involves substantial risk of capital loss. Past performance is not indicative of future results. Always conduct your own research, consider your risk appetite, and consult a financial advisor before making any investment decisions. The author assumes no responsibility for any trading outcomes based on this information.
What do you think? Are you watching NSE:JKLAKSHMI for this breakout opportunity? Share your views in the comments!

Institutional Intraday Trading Part -7Options Type: Understand whether you're dealing with Call Options (bullish) or Put Options (bearish).
Strike Price: This is the agreed price for exercising the contract. ...
Open Interest (OI): Indicates the number of active contracts for a strike price.

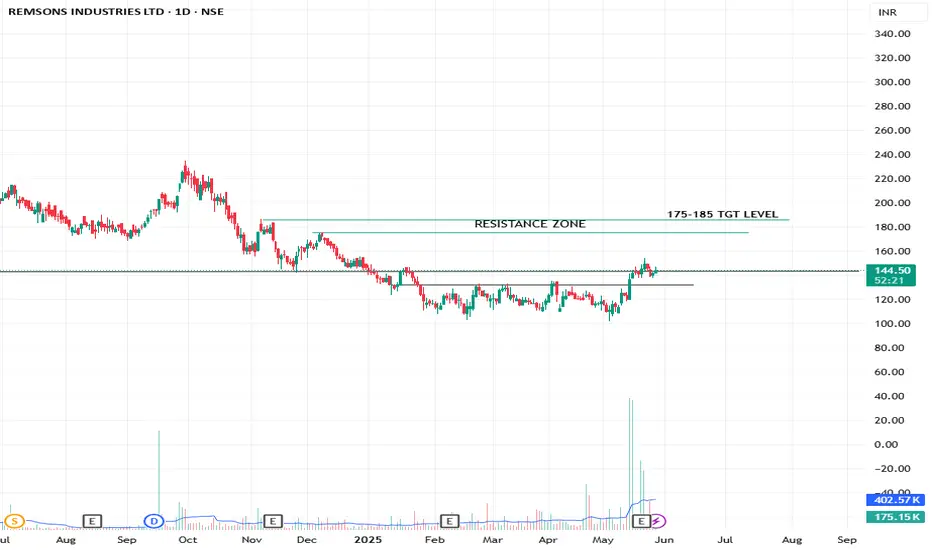
SWING/POSITIONAL PICKREMSONS INDUSTRIES LTD
TECHNICAL VIEW
Stock is shift the range and consoilidate near resistance or breakout zone. Buy 140-145 for 175-185 TGT, sl near 130 at closing basis..
FUNDAMENTAL VIEW
Quarterly/Yearly EBITDA & PAT Both Are Highest In History. ROE & ROCE Is Also Good.
I Am Not SEBI Registered Research Analyst. It Is Giving Only Educational Purpose. Trade In REMSONSIND After Discussing With Your Financial Advisor.
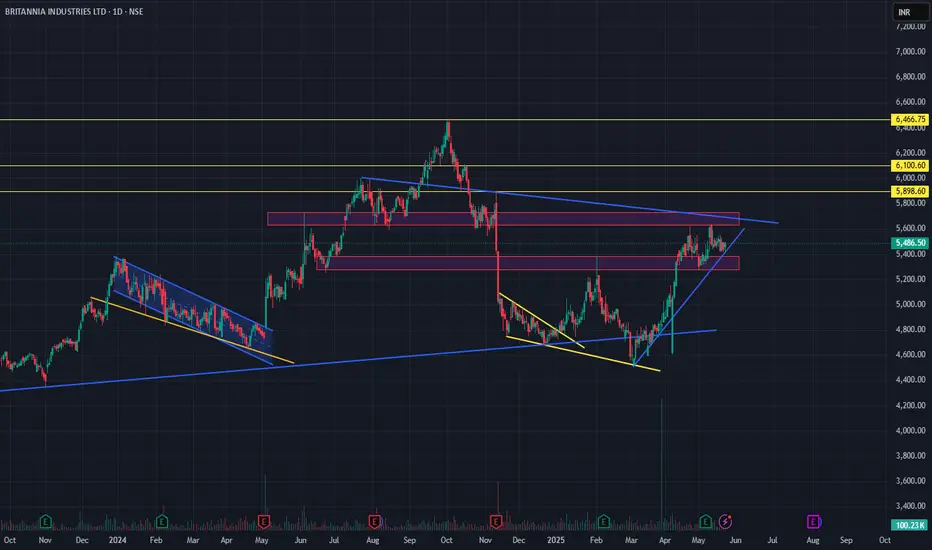
Britannia Industries – Triangle Breakout Loading?NSE: BRITANNIA | CMP: ₹5,486.50 | Timeframe: Daily
Britannia is approaching a crucial symmetrical triangle apex, formed by a long-term descending resistance and a recent ascending trendline. The price is compressing — signaling a potential breakout soon.
🔍 Key Levels:
Resistance: ₹5,890 (triangle top + horizontal zone)
Support: ₹5,280–5,400 (demand zone)
Targets on breakout: ₹6,100 → ₹6,466
📊 Structure Highlights:
Previous falling wedge breakout led to a solid uptrend.
Current price action shows higher lows, indicating strength.
Breakout + volume = bullish confirmation.
🧭 Strategy:
Bullish bias above ₹5,890 with volume.
Watch for invalidation if price breaks below ₹5,280.
📌 Tight consolidation = Big move ahead. Add to watchlist!
Confidence Petrol ltd., Looking good ; min 50% Roi ; swingFor short term investment ;
Leave a " Like If you agree " .👍
.
Wait for small retracement & daily candle to close above - "57.50" .
Trade carefully untill ENTRY level.
.
Entry: 57.5
Target: 61-66-73-81
sl: 53
major stoploss/ support: 44.5.
.
Enter only if market Breaks and retrace and support above
"Yellow box" mentioned.
.
.
Don't make complicated trade set-up.📈📉
Keep it " simple, focus on consistency "💹
Refer our old ideas for accuracy rate🧑💻
Follow for daily updates👍
.
Refer old posted idea attached below.

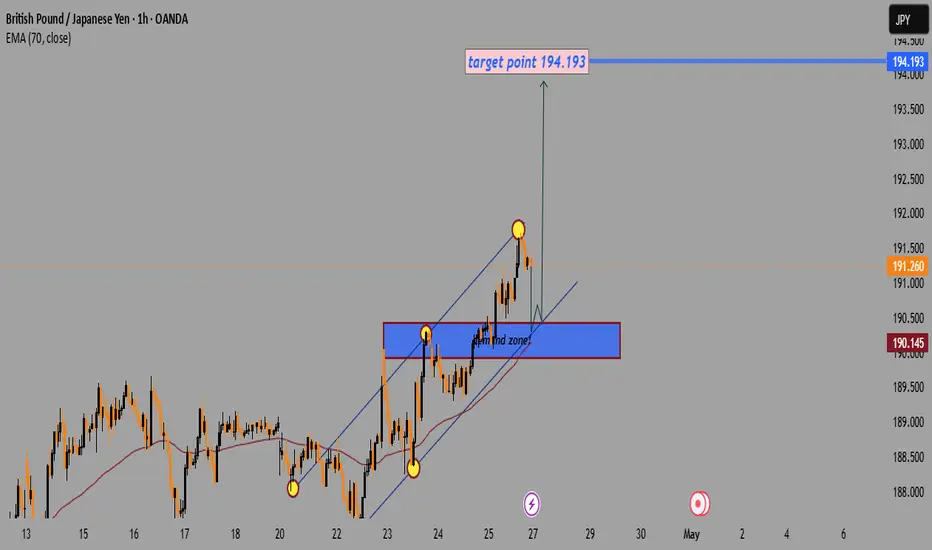
GBP/JPY Bullish Setup:Targeting194.193 After Demand Zone RetestTrend:
📈 Uptrend inside a rising channel (blue lines).
Key Zones:
🟦 Demand Zone: Between 190.400 - 190.700.
🧲 Acts as strong support where buyers previously stepped in.
Indicators:
📉 EMA 70 at 190.145 (below price) → bullish support.
Price Action:
📍 Current price: Around 191.260.
🔥 Recently touched upper channel resistance and pulled back slightly.
Target:
🎯 Target Point: 194.193.
Scenario:
🔄 Expecting a small pullback towards the demand zone or channel support.
🚀 Then a bullish continuation towards the target (194.193).
Risk Warning:
⚠️ If the price breaks below the demand zone and EMA, the bullish idea might be invalid.
Master class Find the Top Watch out for strong stocks. As a trader you must identify strong and weak stocks. ...
Research well. ...
Focus on a small set of stocks. ...
Keep an eye on the news. ...
Focus on timing. ...
Use tools and indicators. ...
Find the right trading platform.

How to Find any Top or Bottom in Stocks or Index with Data A call option writer stands to make a profit if the underlying stock stays below the strike price. After writing a put option, the trader profits if the price stays above the strike price. An option writer's profitability is limited to the premium they receive for writing the option (which is the option buyer's cost).

Learn Intestinal Level TradingIf you're looking for a simple options trading definition, it goes something like this: Options trading gives you the right or obligation to buy or sell a specific security on or by a specific date at a specific price. An option is a contract that's linked to an underlying asset, such as a stock or another security.
Several factors contribute to this high failure rate: Lack of Knowledge and Education: Many traders enter the options market without a thorough understanding of how options work. Options can be complex financial instruments, and trading them without proper education can lead to significant losses
Option trading is largely a skill requiring knowledge of market trends, strategies, and risk management techniques. While there is an element of uncertainty in the markets, successful traders rely on analysis, planning, and discipline rather than luck.

Technical Concept part 2A 'Technical Concept' in Computer Science refers to the idea of measuring and assessing data packages within a server, computer, or web page to analyze and report the services provided via the Internet.

RSI Divergence Part 2RSI divergence occurs when the price of an asset and the RSI indicator move in opposite directions. This can signal a potential trend reversal or a weakening of the current trend. There are two main types: bearish and bullish divergence.

"Plan the Short: DXY Targeting 98.004 "2. Current Price:
Around 99.587 💵
3. Indicators:
EMA 70 (Exponential Moving Average) ➡️ 99.442 📈
Price is dancing around the EMA, meaning trend is a bit bullish for now.
4. Chart Pattern:
Price moving inside an ascending channel 📈➰
Bouncing between channel support and resistance levels ⚡
5. Trading Plan:
Wait for price to reach the blue resistance zone ⬛ (around 100.5 to 100.9)
Look for sell (short) signals after reaching there ⛔
Expecting a reversal and drop down to target 98.004 🎯
6. Stop Loss & Target:
STOP LOSS: 🔴 100.870 (above resistance zone)
TARGET: 🎯 98.004
7. Key Observations:
Current Trend: Short-term bullish 📈 inside channel
Expected Move: Reach blue box ➡️ sell ➡️ fall toward 98.004 📉
News Events: Upcoming 📅🔔 (could create volatility)
Summary:
* 📈 Uptrend inside a channel.
* ⬛ Wait for price to hit the blue zone (100.5–100.9).
* ⛔ Look for short signals in the zone.
* 🔴 Stop Loss: 100.870.
* 🎯 Target: 98.004.
* ⚡ Watch out for news events that can move the market!

Tech Mahindra Q4 Earnings Highlights: #TECHM
Tech Mahindra Q4 Earnings Highlights: #TECHM
• Net Profit: ₹1,166.7 Cr-
Up 18.7% QoQ (vs *983.2 Cr) •
Revenue: *13,384 Cr - Up 0.7% QoQ (vs *13,285.6 Cr)
⚫ EBITDA: *1,378 Cr-Grows 2.1% QoQ (vs *1,350.2 Cr)
⚫ EBITDA Margin: 10.3%, Slightly Up from 10.2% QoQ
Technical Analysis Summary:
The stock made a recent high of ₹1,810.
*1,210.
It was in a downtrend but has reversed from a strong support level at
Currently trading at ₹1,445, the stock has formed a Doji candle, indicating a balance between buying and selling pressure.
A break below *1,430-₹1,425 may signal increased selling pressure and potential downward movement.
Conversely, a break above ₹1,465-₹1,470 may trigger buying momentum
and a potential upward move.
