MACD Divergence Part 2Moving Average Convergence/Divergence (MACD) The Moving Average Convergence/Divergence (MACD) is a momentum indicator showing the relationship between two EMAs of a security's price.
Techincalanalysis

Divergence SecretsIn the share market, divergence refers to a situation where the price of an asset moves in a direction opposite to what a technical indicator is suggesting. This can signal a weakening trend and potentially a trend reversal. Divergence can be either positive (price moving higher) or negative (price moving lower).

Meaning of Management and Psychology Management and psychology, when combined, explore how understanding human behavior can improve organizational effectiveness. Management is the process of directing and organizing resources (including people) to achieve goals, while psychology studies the mind and behavior. Therefore, management psychology (or managerial psychology) is about using psychological principles to understand and improve managerial practices, decision-making, and leadership in organizations.

Explain Swing Trading Swing trading is a speculative strategy where traders aim to profit from short-term price swings in a financial asset, typically holding positions for a few days to a few weeks. It focuses on capturing gains from the short-term fluctuations within a broader market trend, unlike day trading (which focuses on intraday movements) or long-term investing (which focuses on larger trends).

Database TradingTrading data is typically collected from stock exchanges such as the New York Stock Exchange (NYSE) or NASDAQ. This can be a useful source for trades that are made over the listed exchanges and can provide many different data poitns, such as trade prices and times.

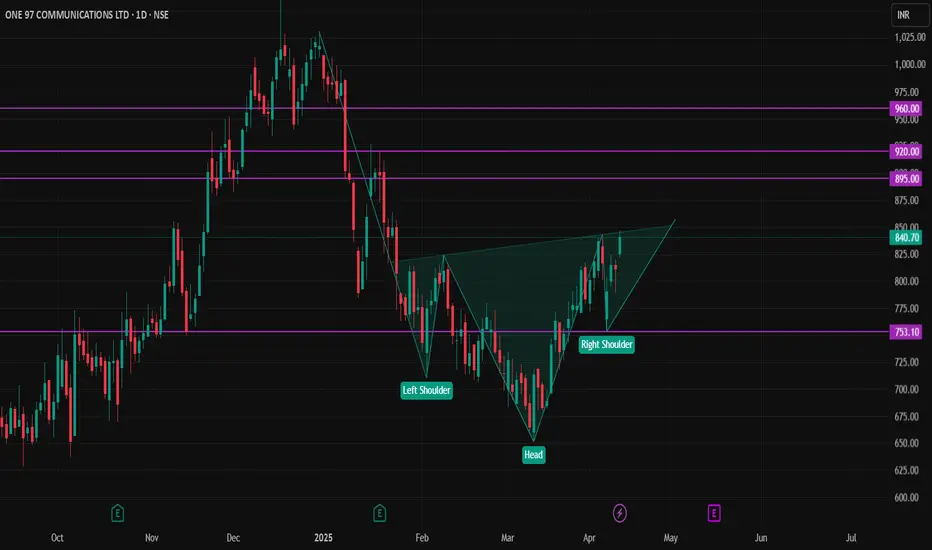
PAYTM STOCKNSE:PAYTM Stock is waiting for breakout the inverted head and shoulders pattern.
buy sustain above 750 rupees,
Target 1 is 885 to 895 rupees,
Target 2 is 915 to 920 rupees,
Target 3 is 950 to 960 rupees,
Stoploss close below 750 rupees atleast 1 day candle.
Candlestick PatternCandlestick patterns are a visual representation of price movements in financial markets, used in technical analysis to identify potential future price movements. Each candlestick represents price action (open, high, low, close) over a specific period, and the combination of these candlesticks forms patterns that can suggest market sentiment and potential trends.

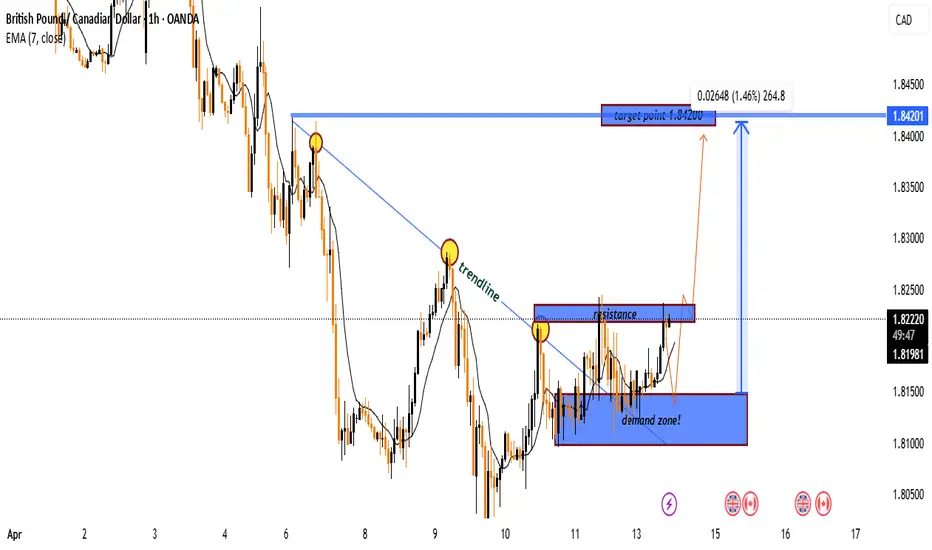
GBP/CAD Bullish Breakout Setup:Demand Zone Rejection with 1.84201. Trendline Breakout
🔻 Downtrend line (from earlier highs) was broken
➡️ Suggests momentum shift from bearish to bullish.
2. Demand Zone
📦 Demand Zone: 1.8130 - 1.8160
🟦 Strong buying interest here
🔁 Price bounced multiple times
💪 Bulls are defending this area!
3. Resistance Zone
🟥 Resistance near 1.8250
🔼 Price is currently testing this level
🚀 Break above = bullish confirmation
4. EMA (7)
📈 EMA7 = 1.81977
🟡 Price above EMA = short-term bullish momentum
5. Target Zone
🎯 Target Point = 1.8420
🔵 Move = +264.8 pips (1.46%)
📊 Bullish projection if breakout holds
6. Price Action
⏳ Price has been consolidating
🧱 Building pressure in a tight range
💥 Breakout candle forming – watch for volume!
Summary
✅ Bullish Setup forming
🟦 Support strong at demand zone
🔁 Testing resistance
🎯 Breakout may lead to a push toward 1.8420
"Gold Demand Zone Bounce – High R:R Long Setup!"📈 This is a bullish setup using a demand zone bounce strategy on the 15-minute timeframe.
Key Zones & Levels
🔵 Demand Zone:
The blue box is where price previously bounced strongly.
Buyers are likely to step in again here.
✳️ Entry Point:
3,292.38
Just above the demand zone – a safe place to catch the next bounce.
⛔ Stop Loss:
3,280.93
Below the demand zone to protect against a breakdown.
🎯 Target Point:
3,345.09
Near a previous resistance area.
Potential gain: +51.94 pts / 1.58%
Indicators
🟡 EMA (7):
Current value: 3,303.63
Price hovering around EMA = consolidation or setup for a bounce.
Risk-Reward Calculation
⚠️ Risk: 11.45 points
✅ Reward: 52.71 points
⭐ Risk-Reward Ratio: ~4.6:1
Very favorable!
Price Action Summary
📊 Strong uptrend into demand zone
🔁 Minor pullback = potential setup
✅ Ideal entry after bullish confirmation (e.g., bullish candle pattern)
Conclusion
This setup looks solid:
✅ Clear demand zone support
✅ High R:R ratio
✅ Clean target above
Just wait for a bullish signal inside the zone and ride it up!

"Silver on the Rise: RBR Zone Holds the Key to $33.49!"Key Zones:
🔵 RBR Zone (Rally-Base-Rally):
🔹 Acts as support
🔹 Price consolidating above it
🔹 If held, it could trigger a move up
📍 Support:
RBR Zone: ~$31.80–$32.10
Deeper support at $30.45 🛡️
🎯 Target Point: $33.49
Strong resistance zone
Previous high zone = profit-taking spot
📉 Downside Risk:
If price breaks below RBR zone and trendline
Could fall to $30.45 support zone
Trend Structure:
📈 Uptrend (Higher Highs + Higher Lows)
🧵 Trendline acting as dynamic support
🟡 Price bouncing from marked pivot zones
Scenarios:
🟢 Bullish Case:
✅ Hold RBR zone
✅ Bounce from trendline
🚀 Target = $33.49
🔴 Bearish Case:
❌ Break below RBR zone
⚠️ Risk drop to $30.45
Summary:
📊 Bias: Bullish above $32.00
📥 Entry Idea: Buy from RBR zone on confirmation
🎯 Target: $33.49
❌ Stop Loss: Below $31.50

"USD/CHF Bearish Setup: SBR + DBD Zone Rejection Trade"🔷 Key Zone:
SBR + DBD Zone 📦
Drop-Base-Drop supply zone
Support turned resistance
Strong rejection area
🔵 Entry Point:
📍 0.81519
Right at the resistance zone
EMA (7) also acting as dynamic resistance
❌ Stop Loss:
🔺 0.82231
Above the zone for safety
Covers potential fakeouts
🎯 Target Point (Take Profit):
✅ 0.78500
Clean horizontal support
Strong RR (Reward-to-Risk) ~ 4:1
📉 Potential Move: -294.6 pips (-3.61%)
📊 Indicators & Structure:
📈 EMA (7) is sloping down = bearish pressure
🔽 Clear downtrend into the zone
📦 Supply zone aligns with trend = high confluence
🧠 Smart Trading Tips:
Wait for confirmation (like rejection wicks or bearish engulfing)
Watch out for news (economic calendar icons shown)
Stick to the plan: entry ➡️ SL ➡️ TP

(XAU/USD) 15-Min Chart –Bullish Setup with RBR Zone& Breakout T🔷 Chart Structure
* 📊 Ascending Channel
↗️ Price is moving within an upward-sloping channel
• Higher Highs
• Higher Lows
* 🔍 Short-Term Trend: Bullish momentum is intact
🟦 Key Zones
* 🟦 RBR Zone (Rally-Base-Rally)
📌 Support area where buyers stepped in
🔄 Price bounced from this zone
* 🟥 Resistance Zone
🚫 Around 3,250 – sellers previously active here
👀 Watch for breakout confirmation
✅ Trade Setup
* 🎯 Entry Point: 3,226.38
* ⛔ Stop Loss: 3,216.30
* 🥅 Target: 3,267.00
* 💰 Potential Gain: 38.67 points (1.20%)
📊 Risk-Reward Ratio: ~1:3 — very favorable!
📍 Indicators
* 📉 EMA (7) — acts as short-term support
🟡 Price is consolidating near EMA — possible setup for next move.
📌 Outlook
* 🟢 Bullish Bias – As long as price stays above RBR zone
* 🔔 Breakout Alert – A break above resistance may lead to sharp upside move toward the target.

Database TradingMarket data is a broad category of information about the financial markets, consisting of essential details like price, bid/ask quotes, trading volume, trading period (high, low, open, or closed), etc.

Price Action Trading Price action trading is a strategy where trades are made solely based on an asset's price movements, without relying on indicators or external analysis.

"BTC/USD Short Setup: Supply Zone Rejection & 5% Drop Target!"BTC/USD 15-Min Chart Analysis
Trade Setup by EA_GOLD_MAN_COPY_TRADE
---
🔼 SUPPLY ZONE (Resistance)
🟣 Price Area: $83,427.80 – $84,313.06
This is where sellers might step in
Price is expected to reverse or slow down here
🔽 ENTRY POINT
🔵 Sell Entry: $83,427.80
Entering short trade just below the supply zone
Aiming to catch a reversal move down
⛔ STOP LOSS
🔴 Stop: $84,313.06
Placed above the supply zone
Limits risk in case of breakout upward
❗ Protects the trade from loss beyond this point
🎯 TARGET / TAKE PROFIT
🟣 Target: $79,071.05
Major support zone / demand area
Potential Drop: -$4,434.27 (-5.31%)
Big reward zone if price dumps from supply
📈 Trendline & Moving Averages
🔵 Blue = Likely 50 EMA
🔴 Red = Likely 200 EMA
Bullish momentum leading into the supply zone
Trendline supports the prior uptrend, now testing reversal
💡 Conclusion
✅ Trade Bias: Bearish (short)
⚖️ Risk-to-Reward: ~1:5 (Great!)
If price reacts at supply, this setup could pay big
But if it breaks up, stop loss keeps you safe

USD/JPY Bearish Trade Setup – SBR + DBD Zone Rejection📉 Trend Analysis:
🔴 Downtrend confirmed by lower highs and lower lows.
📉 Descending trendline indicates continuous bearish pressure.
🔹 Key Levels & Zones:
🔵 Resistance Zone (SBR + DBD) – 144.123 📍 (Sell Entry Point)
🟠 Stop Loss – 145.209 🚫 (Above resistance to avoid fake breakouts)
🟢 Target Point – 139.694 🎯 (Strong support area)
🏹 Expected Price Action:
🔸 Scenario:
🔺 Price moves up toward the resistance zone (🔵 SBR + DBD Zone)
🔻 Bears take control (Rejection expected)
⚡ Drop towards target at 139.694
📊 Trade Plan:
✅ Entry – Wait for rejection at 144.123 (🔵)
✅ Stop Loss – Keep at 145.209 (🛑🔺)
✅ Take Profit – Aim for 139.694 (✅🎯)
💡 Risk-Reward Ratio: Good (More reward than risk)

"Gold on Fire: Demand Zone Bounce with Bullish Target Ahead! "Key Zones & Levels:
Demand Zone 🔵
Area: 3099.36 – 3110
This is where buyers stepped in strongly before – price bounced up from here twice!
Strong support zone!
Resistance / Mini Consolidation ⚠️
Around 3125 – 3135
Price is hesitating here – needs to break this box for continuation.
Target Point 🎯
Level: 3168.17
Based on previous highs – this is the bullish target zone!
Stop Loss ❌
Level: 3099.36
Placed just below the demand zone to limit losses if price breaks down.
Trade Idea Summary:
Entry Zone: ✍️ 3110–3125
Stop Loss: ❌ 3099.36
Target: 🎯 3168.17
Risk-Reward Ratio: 5:1 ⭐️ (Great setup!)
What to Watch For:
✅ If price holds above demand and breaks the mini consolidation, expect bullish continuation.
❌ If price drops below the demand zone, setup is invalid – risk of further decline.

Candlesticks Pattern Candlestick patterns are graphical representations of price movements used in technical analysis to identify potential future price trends and reversals, based on the open, high, low, and close (OHLC) prices of a security over a specific period.

"WTI Crude Oil – Bullish Bounce from Demand Zone? "🔵 . Demand Zone:
⬇️ 60.53 – 59.71
This is the buy zone where bulls are likely to step in!
Price is currently testing this area. Watch closely!
🛑 . Stop Loss (Risk Zone):
📉 Below 59.66
If price falls below here, exit the trade – demand has failed.
🎯 . Target Point:
🚀 63.85
This is the take profit zone. A successful bounce could reach this level!
🟠 . EMA (9-period DEMA):
📉 Currently around 60.86
Price is slightly below EMA, showing short-term bearish pressure.
🟢 . Trade Idea Summary:
• Enter near the blue demand zone
• SL below 🔴 59.66
• TP at 🎯 63.85
• R:R ratio looks favorable (low risk, high reward)
Outlook:
As long as price holds above the demand zone, this setup remains bullish 📈
Let’s see if the bulls can push it to that 63.85 target! 🚀💰

Gold (XAU/USD) Breakout Setup – Bullish Reversal from RBR Zone!🔹 Trade Idea: Long (Buy) Setup
📈 Targeting a price rally from a demand zone!
---
🔵 .ENTRY ZONE (Buy Area)
🟦 Marked between 3,039.773 – 3,043.052
📍 Located in the RBS + RBR zone (Resistance becomes Support + Rally-Base-Rally)
💡 Price dipped here and bounced — showing bullish intent
🔻 .STOP LOSS
🚨 Placed at 3,014.537
🛡️ Protects you in case the price drops below the zone
✋ Risk is clearly defined here
🎯 .TARGET POINT (Take Profit)
🚀 Aiming for 3,115.910
💸 A high reward area if momentum continues
🔥 Great R:R ratio (~1:3) — solid risk/reward
📊 .Technical Confirmation
📌 Price has moved above the 9-period DEMA (3,043.052)
⚡ Signals bullish momentum
🕯️ Strong bullish candles forming after the bounce — confirming entry.
🔍 .Market Structure Notes
⬇️ Previous trend was down
🔄 Now forming a potential reversal
🧱 Support holding strong near 3,014–3,030
✅ Summary: 💥 Buy idea from demand zone
🔝 Targeting new highs
🛑 Stop loss tightly managed
⚖️ Clean setup with momentum on your side

BTC/USD 1H Chart Analysis – Bearish Setup with SBR Rejection🔵 Key Zones & Levels:
🔷 SBR Zone (Support ➡ Resistance):
Price Range: ~$81,000–$83,000
🛑 Stop Loss: $83,002.31 (Just above resistance)
Expecting sellers to step in here if price retests this level
🟠 Mid-Range Zone:
Current price is consolidating just below SBR zone
Could form a lower high before dropping
🟦 Target Zone (Support Area):
🎯 Target Price: ~$75,000
Previous demand area – price bounced hard from here before
🔁 Trade Plan:
📉 Bias: Bearish
📍 Entry: Near current price or after retest of SBR zone
🛑 Stop Loss: $83,002.31
🎯 Target: $75,000 (approx -8.33%)
✅ Summary:
Risk-Reward: Appears solid (R:R > 2:1)
🕵️♂️ Watch for: Fakeouts or rejections in the SBR zone
🔻 Potential Move: -6,804 points if plan plays out

"Gold Price Rejection Setup – Trendline + Resistance Combo"XAU/USD 1H Chart Analysis 🪙📉
🔹 Trendline 📐
* Descending trendline marked by 3 touches
* Shows consistent bearish pressure
* Price is respecting it—watch for rejections
🔹 Resistance Area ⛔
* Blue zone between $3,014 - $3,025
* Strong supply zone—price failed to break it before
* Potential reversal zone if price touches again
🔹 Entry Point 🎯
* Suggested short entry at $3,014.29
* Just under resistance + near trendline
* Great spot for catching a downward move
🔹 Stop Loss ⚠️
* Placed at $3,025.13
* Above resistance = smart protection
* Keeps risk under control if breakout happens
🔹 Target Point 💰
* Take-profit marked around $2,964.45
* Down at a key support level
* Clean risk-to-reward around 1:5 (sweet setup!)
🔹 Moving Average (DEMA 9) 📈
* Dynamic resistance (line hugging candles)
* If price closes below, confirms bearish move
Summary ✅
This setup is a classic trendline + resistance short. You're betting on price respecting resistance and heading lower.
Bias: Bearish 🔻
Entry: $3,014.29
SL: $3,025.13 🛑
TP: $2,964.45 ✅

MACD trading techniquesThe Moving Average Convergence Divergence (MACD) is a technical analysis indicator used to identify potential buy and sell signals by analyzing the relationship between two exponential moving averages (EMAs) of a security's price, typically a 12-period and a 26-period EMA.
