Database Trading AnalysisDatabase trading refers to the buying and selling of databases or data-related products, often for financial or commercial purposes, encompassing large datasets, data assets, or rights to access specific data.
Techincalanalysis

Basic to Advance Technical AnalysisTechnical analysis seeks to predict price movements by examining historical data, mainly price and volume. It helps traders and investors navigate the gap between intrinsic value and market price by leveraging techniques like statistical analysis and behavioral economics.

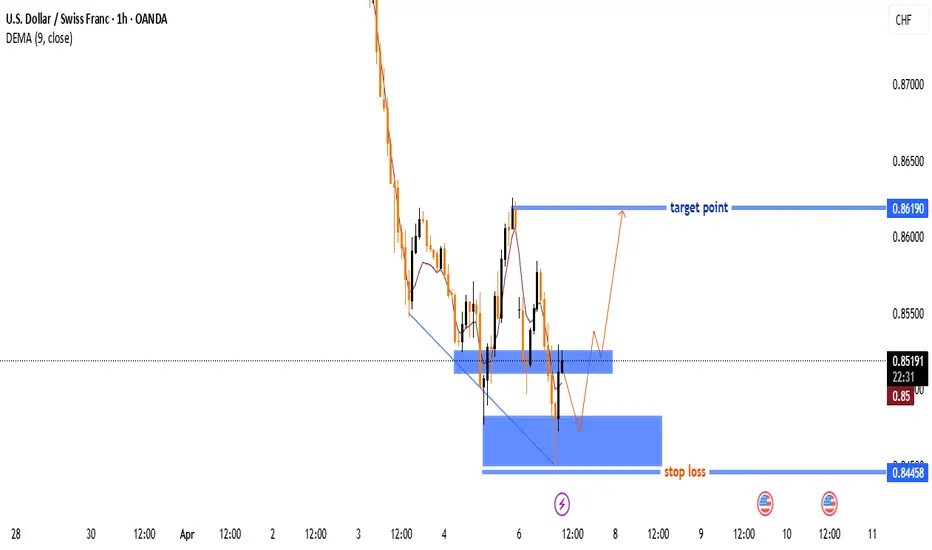
USD/CHF Trade Analysis: Potential Reversal & Bullish Setup🔻 Downtrend Phase: The price has been falling sharply, showing a strong bearish move before hitting support. 📉🔥
🟦 Support Zone (0.84458):
🔵 Key level where buyers may step in. If price holds, it could trigger a reversal. 🚀🔄
🟦 Resistance Zone (Mid-Level):
🟡 A minor barrier before price can continue higher. Expect some reaction here. ⚠️📊
🎯 Target Point (0.86190):
✅ Bullish target where price is expected to move if the support holds. 🎯💰📈
⚠️ Stop Loss (0.84458):
❌ If price breaks below this level, the trade setup is invalidated. 🚨🔻
📊 Trade Setup Summary:
✔️ Buy from support (if confirmed)
✔️ Stop Loss below 0.84458 ❌
✔️ Take Profit at 0.86190 🎯💵
🔥 Risk-Reward looks good! Watch for confirmation before entering! 🚀📊
Gold (XAU/USD) Bullish trend Demand Zone – Trend Analysis🔵 Demand Zone (Support Area):
This blue zone represents a strong buying area where buyers are expected to step in.
If the price touches this zone and bounces, it confirms bullish strength.
📉 Trend Line Break:
The previous trendline has been broken ⛔, signaling a possible retest before a move up.
🛑 Stop Loss (Risk Management):
Positioned at 3,108.52 🔴, meaning if the price drops below this, the trade setup becomes invalid.
🎯 Target Point (Take Profit Level):
3,167.77 ✅ is the potential profit zone if the price moves upward from the demand area.
🟠 Expected Price Movement:
The orange dotted line 🔶 suggests a likely move:
1. Price dips into the demand zone (🔵).
2. Bounces back up 🔄.
3. Breaks minor resistance 🟦.
4. Rallies to the target zone 🎯.
Overall, bullish movement 📈 is expected if the demand zone holds! 🚀

Divergence secrets of RSIRSI divergence signals potential trend reversals or continuations by highlighting a disconnect between price action and momentum, where the price makes a new high/low but the RSI doesn't, indicating a weakening trend

Gold Spot (XAU/USD) Price Analysis –Key Zones & Potential Movemt🔵 Key Price Levels:
Current price: 🟠 $3,130.99
DEMA (9): 🔵 $3,138.21
Target price: 🎯 $3,174.92
📌 Zones Identified:
🟢 Demand Zone (Support) ⬇️: Strong buying interest, potential bounce area. If price falls here, buyers may step in.
🟡 RBR Zone (Rally-Base-Rally) 🔄: A mid-level area where price could consolidate before moving up.
🔴 Supply Zone (Resistance) ⬆️: Sellers might emerge, causing a reversal or slowdown in price movement.
📈 Potential Price Action:
🔹 Scenario 1 (Bullish 🐂): A retrace to the RBR Zone 🟡 could lead to a bounce 📈 toward the Target 🎯 at $3,174.92.
🔹 Scenario 2 (Bearish 🐻): If price drops below the Demand Zone 🟢, it may signal a trend reversal 📉.
🔹 Breakout Confirmation: If price breaks above the Supply Zone 🔴, it may continue rallying 🚀 toward the target point.

Silver (XAG/USD) Price Analysis – Key Levels & Market Outlook🔍 Key Observations:
📊 Current Price: 34.19250 USD
📈 DEMA (9, close): 34.25605 USD
🎯 Target Price: 35.38940 - 35.5000 USD
🔵 Zones Identified:
🟦 Supply Zone: 34.50 - 34.80 USD (🔼 Selling pressure area)
🟦 RBS Zone: 34.00 - 34.20 USD (🔽 Potential bounce zone)
🟦 Lower RBS Zone: 32.80 - 33.20 USD (⬇️ Strong support)
📉 Market Scenarios:
✅ Bullish Case:
Price bounces off the RBS zone at 34.00 USD ➡️ Uptrend resumes 🚀
Target: 35.50 USD 🎯
❌ Bearish Case:
Breaks below 34.00 USD ❗
Next stop: 33.00 USD ⚠️
📢 Final Thoughts:
🟢 Buyers: Wait for a bounce at 34.00 USD before entering 📈
🔴 Sellers: Look for rejection at 34.50 - 34.80 USD or breakdown below 34.00 USD 📉
⚡ Key Level to Watch: 34.00 USD 👀 A hold = bullish 📊, a break = bearish ⚠️

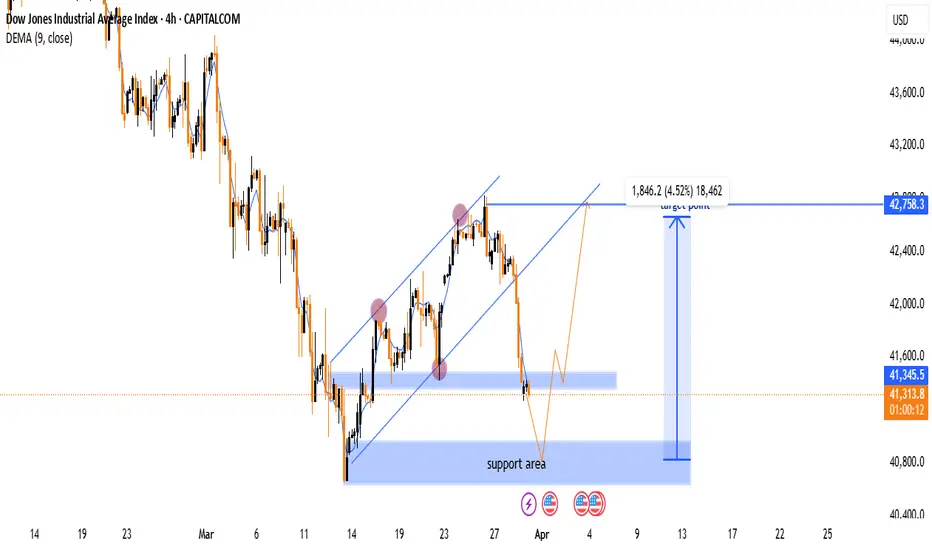
Dow Jones 4H Chart Analysis: Support Test & Potential Reversal 📉 Downtrend: The price was falling sharply before forming an upward channel.
📊 Channel Break: The price broke below the ascending channel 🚨.
🟦 Support Zone: The blue area marks a strong support region 📌.
🔵 Bounce Expected? If the price holds, a rebound could happen 📈.
🎯 Target: The projected upside target is 42,758.3 🚀.
⚠️ Risk: If the support fails, the price may drop further ⛔.
🔴 Watch for: A confirmed reversal near support or further breakdown!
Btc analysis 31st marchHello
It's a jayesh balar.
If you have a any "Questions"
Ask me in comment
If my analysis is helpful,
press booster bottom.
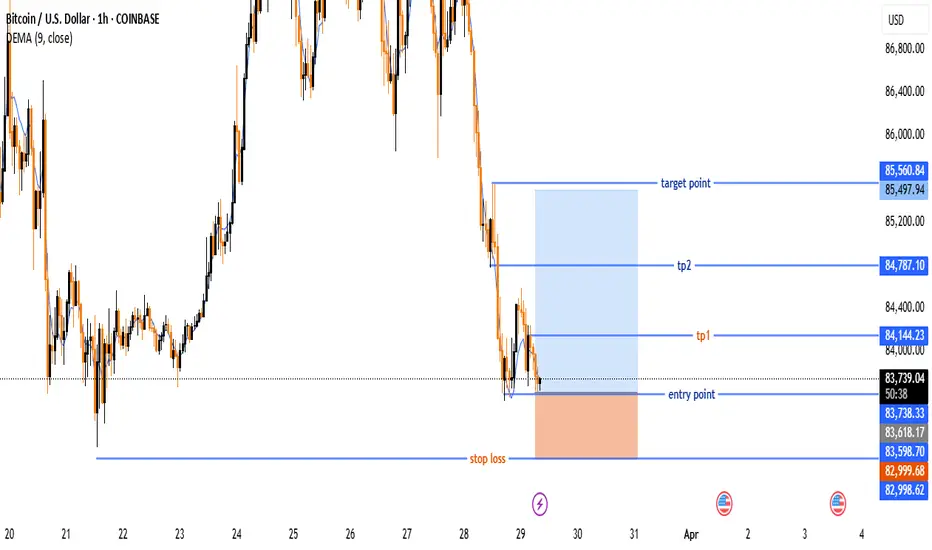
Bitcoin (BTC/USD) Trade Setup – Potential Reversal &Target Leves🔵 Entry Point:
🔹 Around $83,678.04 – The suggested buying zone.
🛑 Stop Loss:
🔻 $82,998.62 – The price level where the trade will be exited if it moves against the plan.
🎯 Target Points:
✅ TP1: $84,144.23 – First profit target.
✅ TP2: $84,787.10 – Second profit target.
🏆 Final Target: $85,560.84 – The ultimate goal for the trade.
📈 Technical Overview:
🔹 The price is at a support level, with a potential reversal to the upside.
🔹 Risk-Reward Ratio is favorable, with a clear uptrend target.
🔹 DEMA (9) at $83,776.52 indicates a possible trend shift.
Gold (XAU/USD) Bullish Outlook: Key Levels & Trade Setup📊 Gold (XAU/USD) 1H Chart Analysis 📈
🔹 Current Price & Trend:
📍 Price: 3,077.46 USD
📈 Uptrend in play (Higher Highs & Higher Lows)
📊 9-period DEMA: 3,078.47 USD (showing bullish momentum)
🔹 Key Levels:
📍 Demand Zone (Support) 📥: 🟦 3,030 - 3,040 USD (Potential Buy Area)
📍 Fair Value Gap (FVG) ⚡: 🟦 Price may retrace here before continuing up
📍 Resistance Zone (Short-term) 🚧: 🟦 3,085.15 USD
🎯 Target Price: 🔵 3,110.09 USD
🔹 📉 Possible Scenario:
1️⃣ Price retraces to the FVG zone 🟦 (Healthy pullback)
2️⃣ 📈 Bullish continuation toward the 3,110 target 🎯

Gold (XAU/USD) Bullish Breakout – Trade Setup & Key Levels🔍 Key Observations:
🔹 Trend Line Breakout:
📉⬇️ A downward trend line was broken, signaling a potential bullish reversal.
📈✅ The price has moved above the trend line, confirming the breakout.
🔹 Support & Resistance Zones:
🟦 Support Area: $3,000 - $3,010 (Buy Zone)
🟥 Resistance Area: $3,030 - $3,040 (Sell Pressure)
📊 Trade Setup:
✅ Buy Plan:
🔄 Wait for a pullback to the support zone (🟦 light blue area) before entering.
🎯 Target: $3,056.97 📈🏁
🛑 Stop Loss: $2,999.02 ❌🚨
📈 Indicators & Confirmation:
📊 DEMA (9-period) = $3,026.48 (near the current price, suggesting a neutral-to-bullish trend).
🔥 Conclusion:
🔵 Bullish Setup Active 🚀
⚠️ Wait for price reaction at support before entering.
❌ If price drops below $2,999, the setup is invalidated.
📌 Final Tip: Watch for a bullish candlestick pattern 📊 at support before executing the trade! 🎯

Bitcoin (BTC/USD) 4H Chart Analysis: Bullish Breakout Ahead?📈 Ascending Channel:
🔹 The price is moving upward within a parallel trend channel.
🔹 Blue arrows (🔵) indicate resistance points where the price struggled.
🔹 Red circles (🔴) highlight support areas where the price bounced.
🟦 Fair Value Gap (FVG) Zone:
🔸 The blue-shaded area (FVG zone) suggests a possible retracement before a bullish move.
🔸 If the price dips into this zone, it may find liquidity and bounce back up.
📊 Projected Price Movement:
⚡ Expected pullback → into FVG zone (🔽), then a bullish push (🚀) towards $90,686.72 🎯.
🟡 Yellow arrow shows the anticipated price path.
📉 Support & Resistance Levels:
✅ Support: Around $86,000 - $86,500 (FVG zone).
🚀 Target: $90,686.72 (next major resistance).
📌 Exponential Moving Average (DEMA - 9):
🔹 The blue line (DEMA 9) at $87,414.57 is acting as dynamic resistance.
🔹 A break above this could confirm further upside movement.
💡 Conclusion:
🔸 Bullish bias remains strong 📈.
🔸 Watch for a dip into the FVG zone before a potential rally 🚀.
🔸 If Bitcoin holds support, it may reach $90K+ soon 🎯🔥.

Advanced Technical ConceptOn the other hand, hidden divergence occurs when the price makes a lower low, but the RSI indicator makes a higher low, signaling a potential trend continuation. RSI Divergence occurs when the price movement and the RSI indicator move in opposite directions, signaling a potential reversal in the current trend.
Divergence within RSI through price movements is a powerful indication that there will be reversals in the market. There are two types of divergences: bullish divergences and bearish divergences. 1. Bullish divergence

Advanced Patterns Trading Chart patterns are visual representations of price movements used in technical analysis to predict future market behavior, categorized as continuation, reversal, or bilateral, and can signal potential trend continuation, reversal, or volatility.
Top Picks: The Most Successful, Profitable, and Reliable Chart Patterns
Head and Shoulders Pattern.
Double Tops and Double Bottom.
Cup and Handle.
Ascending/Descending Triangles.
Bullish and Bearish Flags.
Wedge Patterns (Rising/Falling Wedges)
Triple Tops and Triple Bottoms.
Symmetrical Triangles.

Advanced Swing Trading Strategy with Pcr Part-1So, an average put-call ratio of 0.7 for equities is considered a good basis for evaluating sentiment. In general: A rising put-call ratio, or a ratio greater than 0.7 or exceeding 1, means that equity traders are buying more puts than calls. It suggests that bearish sentiment is building in the market.
The Put-Call Ratio (PCR) is a popular technical indicator used by investors to assess market sentiment. It is calculated by dividing the volume or open interest of put options by call options over a specific time period. A higher PCR suggests bearish sentiment, while a lower PCR indicates bullish sentiment.

Divergence Trading With ProfessionalsDivergence in an uptrend occurs when price makes a higher high but the indicator does not. In a downtrend, divergence occurs when price makes a lower low, but the indicator does not. When divergence is spotted, there is a higher probability of a price retracement.
Divergence signals tend to be more accurate on the longer time frames. You get fewer false signals. This means fewer trades but if you structure your trade well, then your profit potential can be huge. Divergences on shorter time frames will occur more frequently but are less reliable.

USD/CHF 4H Analysis – Key Levels & Trade Setup🔍 Key Observations:
📌 Supply & Demand Zones:
🔴 Upper Supply Zone (~0.9000): 🔥 Strong resistance where sellers might enter.
🟠 Mid Supply Zone (~0.8850): ⚠️ Key resistance where price is testing.
🟢 Lower Demand Zone (~0.8750): ✅ Possible support where buyers could step in.
📊 Price Action:
🔼 Price is currently at 0.88230 📍 near resistance.
🔽 If rejected, it might drop ⬇️ toward 0.86531 🎯.
🔼 If buyers win, it could rise to 0.9000 🚀.
📉 Bearish Bias Expected:
❌ Rejection at 0.8850 → Drop to 0.86531 ⏳.
✅ If it breaks higher, look for 0.9000 🎯.
🔎 Final Thoughts:
⚡️ Watch for reactions at 0.8850 📍.
🔹 Bearish confirmation? Sell ➡️ 0.86531.
🔹 Bullish breakout? Buy ➡️ 0.9000.
🎯 Trade wisely! 💰📉📈

USD/JPY Breakout Trade Setup – Bullish Potential Ahead!📉 Trend Analysis:
The pair has been in a downtrend 📉 since early February, following the descending trendline.
Now, price is breaking out above the trendline 📈, indicating a potential reversal or bullish move.
📊 Trade Setup:
🔹 Entry: Around 149.731 (current price)
🔹 Take Profit Targets:
🎯 TP1: 150.170 (First resistance)
🎯 TP2: 151.028 (Stronger resistance)
🚀 Final Target: 152.309 - 152.319 (Main bullish goal)
🔹 Stop Loss: 148.567 - 148.549 (Below recent support) ❌
⚖ Risk-Reward Ratio:
✅ Good reward-to-risk setup since stop-loss is tight, but the upside potential is higher.

All Financial MarketIn India, there exists broadly two types of Financial Markets which are further classified : Money Market is a market that deals with short-term funds. The capital market is a market that deals with long-sighted funds. Lenders and borrowers can trade funds through the financial system.
Different types of financial markets include stock markets, bond markets, forex markets, and commodities markets. Stock markets facilitate the buying and selling of company shares, while bond markets deal with debt securities. Forex markets enable currency exchange, and commodities markets trade physical goods.29 Aug 2024

Bitcoin (BTC/USD) 4H Analysis: Bullish Breakout or Pullback? 🔍 Key Observations:
🔹 📈 Trendline Breakout: The descending trendline (white) has been broken, signaling a potential uptrend.
🔹 📍 Support & Resistance Zones:
🟢 Strong Support (~$80,349 - $82,000): 📉 If price drops, this zone could act as a bounce area. 🛑 Stop-loss is placed below.
🟡 Resistance (~$86,000 - $88,000): 🔄 Currently testing this level—either a breakout or a rejection could follow.
🔵 Next Target (~$94,000): 🚀 If Bitcoin pushes above resistance, this could be the next stop.
📊 Possible Price Action Scenarios:
✅ Bullish Path:
🟢 Breaks Above $86,000 → Targets $94,000 🚀
🔄 Small retest of support before continuing up 📈
❌ Bearish Path:
❌ Rejected at $86,000 → Pullback to $82,000 🔽
📉 If support fails, price may drop further
🎯 Conclusion:
🔥 Bullish Bias: 🟢 A breakout above $86,000 increases the chance of hitting $94,000+.
⚠️ Watch for retests! 🔄 A pullback before an upward move is possible.
🚀 Final Thought: If BTC **

Advanced Technical Analysis #DivergenceDivergence is when the price of an asset is moving in the opposite direction of a technical indicator, such as an oscillator, or is moving contrary to other data. Divergence warns that the current price trend may be weakening, and in some cases may lead to the price changing direction.
