Best Statergies to do Database trading ?9 data-driven strategies for improved trading decisions
Volatility graphs. Volatility surface mapping is one method that helps decide the best approach in any given market. ...
Moving averages and regression analysis. ...
Machine learning. ...
Computer simulations. ...
The Bollinger Bands. ...
AI investing. ...
Unconventional data. ...
Using new data.
A trader needs to collect three types of market data for algo trading; real-time data, delayed data, and historical data. Real-time data is used while a trader executes an order, it is taken into account at the time of the trade.
Techincalanalysis

How to Use chart patterns in technical analysis ?Setting Entry and Exit Points: Chart patterns enable day traders to set precise entry and exit points. For example, a trader might enter a long position when the price breaks above the upper trendline of a symmetrical triangle and set a stop-loss order below the pattern's lower trendline.
The 123 pattern reversal strategy is a three-swing price formation indicating a potential trend reversal. It consists of three price swings with three swing points, suggesting a change in market direction.

How to use technical analysis in trading ?How to perform technical analysis
Identifying the trend. This is the first step in technical analysis for traders because trading strategies can either follow the trend or go against the trend. ...
Drawing support and resistance levels. ...
Establishing entry and exit points. ...
Position sizing and risk management.
Technical analysis seeks to predict price movements by examining historical data, mainly price and volume. It helps traders and investors navigate the gap between intrinsic value and market price by leveraging techniques like statistical analysis and behavioral economics

Option chain pcr and its relevanceThe Put-Call Ratio (PCR) is a popular technical indicator used by investors to assess market sentiment. It is calculated by dividing the volume or open interest of put options by call options over a specific time period. A higher PCR suggests bearish sentiment, while a lower PCR indicates bullish sentiment.
The Put-Call Ratio (PCR) is a useful indicator to understand the market sentiment at any given time. A high PCR suggests a bearish market, while a low PCR signals bullish tendencies. It helps investors assess whether the market is leaning towards optimism or pessimism, which can shape investment strategies.

what is DATABASE trading and how to do it ?It provides real-time information about stock and market prices as well as historical trends for assets such as equities, fixed-income products, currencies and derivatives. Step 1: Establishing the Baseline. Start by understanding the macroeconomic context. ... Step 2: Analyzing the Surprise Factor.
Trading involves the buying and selling of financial assets, such as stocks, to earn profits based on the price fluctuations of these assets. There are different types of trading, and traders use various strategies, techniques, and tools to decide when to buy or sell different assets

how to pcr in the option chain analysis???PCR is computed by dividing open interest in a put contract on a particular day by open call interest on the very same day. Here PCR is computed by dividing the put trading volume by the call trading volume on a specific day. Here, Put volume indicates the total put options initiated over a specific time-frame.
The PCR ratio is calculated by dividing the total open interest of outstanding put options by the total open interest of outstanding call options for a specific security or market. The open interest represents the total number of options contracts that have not been exercised or expired.

How to use Option-Chain in stock market???An option chain has two sections: calls and puts. A call option gives the right to buy a stock while a put gives the right to sell a stock. The price of an options contract is called the premium, which is the upfront fee that an investor pays for purchasing the option.An option chain has two sections: calls and puts. A call option gives the right to buy a stock while a put gives the right to sell a stock. The price of an options contract is called the premium, which is the upfront fee that an investor pays for purchasing the option.

trent ltd"#TRENT - The Countdown Begins!
• Entry - 5300
Stop-Loss - 5000
Target - 6000
✦ Momentum building, ready for ignition!
Trent is forecast to grow earnings and revenue by 24% and 25.4% per annum respectively. EPS is expected to grow by 23.9% per annum. Return on equity is forecast to be 32.5% in 3 years.

How to trade profitabily in stock markets???Use strategies like scalping or momentum trading, aiming for small, consistent gains across several trades. Set realistic profit targets and strict stop-losses to limit risk. Always start with a small capital, trade with proper risk management, and avoid over-leveraging to protect your investments.
Scalping is one of the most popular strategies. It involves selling almost immediately after a trade becomes profitable. The price target is whatever figure means that you'll make money on the trade. Fading involves shorting stocks after rapid moves upward.

Schneider Electric Infrastructure Ltd.#schneider double bottom pattern formed
target - 800 £
entry - 630 £
stop loss - 590 £
time frame - 2 months
technicals - bullish
this is not any financial advise

Tata consumer products ltdTata Consumer Products Ltd. has an average target of 1152.17. The consensus estimate represents an upside of 12.83% from the last price of 1021.20. View 22 reports from 7 analysts offering long-term price targets for Tata Consumer Products Ltd..
For the quarter, Revenue from operations grew by 9% (8% in constant currency) as compared to corresponding quarter of the previous year, with strong performance in India business, which grew 10%. Profit before exceptional items and tax at Rs 509 Crores is higher by12%.

How to use RSI in technical analysis ???To use the RSI indicator, check if the value is above 70 to show an asset is overbought, or below 30 to show it is oversold. Traders can use these signals to find possible trading opportunities.
Low RSI levels, typically below 30 (red line), indicate oversold conditions—generating a potential buy signal. Conversely, high RSI levels, typically above 70 (green line), indicate overbought conditions—generating a potential sell signal
Successful trades often occur when the RSI crosses above 30 (indicating a buy signal) or below 70 (indicating a sell signal). Adjusting the RSI period to 9 can make it more sensitive to price changes and be suitable for more active trading strategies

Gold price today (February 11): Shocking increaseThe global gold price has seen a strong increase, with spot gold reaching $2,908.3 per ounce, up $47.1, and gold futures climbing to $2,936.9 per ounce, an increase of $49.3. This surge is primarily driven by the demand for safe-haven assets amid concerns over new tariffs announced by U.S. President Donald Trump, which have raised fears of a trade war and inflation. Trump unveiled plans to impose an additional 25% tariff on imported steel and aluminum, while also forecasting the announcement of reciprocal tariffs this week. Experts believe these tariffs could worsen inflation in the U.S., and investors are awaiting the release of the CPI and PPI data to assess the impact. If inflation decreases, gold prices could continue to rise; conversely, if inflation increases, bond yields could rise, applying pressure on gold.
From a technical perspective, gold is currently trending within a rising price channel, with significant support at $2,899 per ounce, which is expected to help maintain its upward momentum. Experts predict that, with the current upward trend, gold could quickly reach a new record high of $3,000 per ounce in the near future.

Tech Mahindra Ltd.#TECHM on a breakout.
Entry: 1160
SL: 1120
Target: 1315/ 1425/1570/1700/1800
Check BIO for any help.
Comment stocks below for review.
Happy Trading!!!
Tech Mahindra is forecast to grow earnings and revenue by 23.9% and 7.7% per annum respectively. EPS is expected to grow by 23.8% per annum. Return on equity is forecast to be 29.3% in 3 years

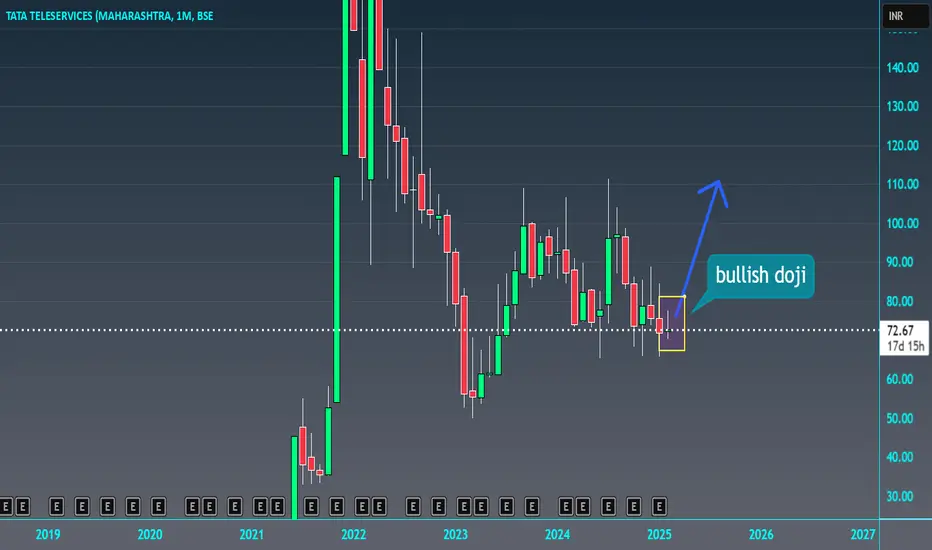
Tata Teleservices (Maharashtra) Ltd#TTML PERFECT REVERSAL CANDIDATE
TARGET - 82
ENTRY - 72
STOP LOSS - 70
TIME FRAME - MONTHLY
TECHNICALS - BULLISH DOJI CANDLE FORMED
THIS IS NOT ANY FINANCIAL ADVISE
As on 7th Feb 2025 TTML SHARE Price closed @ 72.04 and we RECOMMEND Strong Sell for LONG-TERM with Stoploss of 80.87 & Sell for SHORT-TERM with Stoploss of 76.08 we also expect STOCK to react on Following IMPORTANT LEVELS.
Mahamaya Steel Industries Ltd#MAHASTEEL
Daily chart..
Resistance at 225
Support at 180
Keep on Radar..
Shri Ramanand Agrawal
The Company has been promoted by Shri Ramanand Agrawal and his family members. Agrawal family is a well-known industrialist family from Raipur. The Company came out with a public issue in the year 1994 which was oversubscribed. MSIL is a profit making and dividend paying Company.

Database TradingTrading data is a sub-category of financial market data. It provides real-time information about stock and market prices as well as historical trends for assets such as equities, fixed-income products, currencies and derivatives.
In our analysis, we found Webull and Fidelity to be the best trading platforms for beginners, and Interactive Brokers and tastytrade to be the best options for advanced or active traders.

BTC in clear down TrendBTC making lower highs and lower lows shows in clear down trend for last few days

#TATA Consumer ltdTata Consumer
Structure break+ trend continuation are the sign of bullish reversal.
Perfect chart
1107/1234
Im waiting for entry point
as of February 6, 2025, Tata Consumer Products Limited (TATACONSUM) is trading at ₹1,069.85.
echnical indicators suggest a bullish trend for the stock.nalysts have set a median target price of ₹1,190.32 over the next 12 months, indicating potential upside.citeturn0search3
he company has demonstrated consistent financial performance, with a consolidated total income of ₹4,495.16 crore for the quarter ending December 31, 2024, reflecting a 5.51% increase from the previous quarter and a 16.35% rise compared to the same quarter the previous year.
given these factors, the stock's outlook appears positive.
*Please note that this information is for educational purposes only and should not be considered financial advice. Always consult with a qualified financial advisor before making investment decisions.*

Pansari Developers ltdpansari jackpot share
target - 250
entry - 210
stop loss - 190
time frame - weeks
technicals - bullish
this is not any financial advise

#SHARDACROP ltd
#SHARDACROP is taking support from its previous consolidation zone.
today good green candle with volume showing it may move up in next few sessions.
Sharda Cropchem Limited is an Indian company specializing in the marketing and distribution of a wide range of agrochemicals, including formulations and generic active ingredients. Their core competencies encompass identifying generic molecules, preparing dossiers, obtaining registrations, and distributing products in the fungicide, herbicide, and insecticide segments.
SHARDACROPCHEM.COM
In addition to agrochemicals, Sharda Cropchem supplies various conveyor belts, V-belts, and industrial chemicals. These products are primarily utilized in mining projects, steel plants, quarries, grain silos, cement manufacturing facilities, ports, and tunneling projects. The company serves markets across Europe, NAFTA, Latin America, and other regions worldwide.

What is RSI and How it is usefull in trading??The **Relative Strength Index (RSI)** is a momentum oscillator that measures the speed and change of price movements, ranging from 0 to 100. It helps traders identify overbought or oversold conditions:
- **RSI above 70**: Overbought, potential price reversal or pullback.
- **RSI below 30**: Oversold, potential price rebound or reversal.
### Key Uses in Trading:
1. **Overbought/Oversold Conditions**: Buy when RSI is below 30, and sell when above 70.
2. **Divergence**:
- **Bullish Divergence**: Price makes new lows, but RSI makes higher lows (buy signal).
- **Bearish Divergence**: Price makes new highs, but RSI makes lower highs (sell signal).
3. **Trend Confirmation**: RSI above 50 suggests a bullish trend, below 50 indicates a bearish trend.
4. **Entry/Exit Signals**: RSI crossing above 30 (from oversold) can signal a buying opportunity, while crossing below 70 (from overbought) can signal a selling opportunity.
### Best Used With:
- Other indicators (e.g., moving averages, support/resistance) to confirm signals.
RSI helps traders spot potential reversals, confirm trends, and make informed entry/exit decisions.

How to use ADX in trading ???The ADX identifies a strong trend when the ADX is over 25 and a weak trend when the ADX is below 20. Crossovers of the -DI and +DI lines can be used to generate trade signals. For example, if the +DI line crosses above the -DI line and the ADX is above 20, or ideally above 25, then that is a potential signal to buy.
The traditional setting for the ADX indicator is 14 time periods, but analysts have commonly used the ADX with settings as low as 7 or as high as 30. Lower settings will make the average directional index respond more quickly to price movement but tend to generate more false signals.
Many trading strategies like Linda Raschke's Holy Grail and Jeff Cooper's 5 Day Momentum Method use the ADX indicator to identify strong trends. However, day trading with the ADX indicator is not common. The reason is while the ADX indicator is good at identifying strong trends, it is a lagging indicator.
