Brian – Gold game plan for the US sessionBrian – Gold game plan for the US session
Gold’s rally yesterday shook a lot of traders out of position – the move was slow, steady and unforgiving, making it hard both to get in and to get out. For now, the short-term trend is clearer on H1, while H4 is still in transition.
Fundamental view – the Fed is confusing everyone
Fed expectations for December have been on a roller-coaster:
The market went from pricing a 25 bp cut in December at over 90%,
Then collapsed those odds to below 30%,
And has now swung sharply back again – all within about a month.
That kind of violent repricing in rate expectations usually creates two things for gold:
underlying support as soon as the market believes in easier policy again, and
choppy two-way volatility around each new data print or Fed comment.
So the macro backdrop still leans supportive for gold, but you do not want to ignore intraday whipsaws.
Technical view – H1 bullish, H4 testing the top of structure
On the H4 chart:Price is trading above the rising medium-term trendline from late October, keeping the broader structure constructive as long as 4,000 holds.
We are now pushing up towards the descending trendline and a H4 supply/FVG band between roughly 4,160 and 4,200.
Higher up sits a larger FVG / resistance block around 4,280–4,330 – if price ever accepts above the current downtrend line, that zone becomes a realistic upside magnet.
On H1:Structure is clearly bullish with higher highs and higher lows after yesterday’s impulsive move.
The current leg is extended, so I prefer to buy dips into support or a clean retest, rather than chase at the top of the candle.
Core bias: still prefer buys with the trend. Shorts are tactical, only at clear reaction zones.
Key levels
Resistance / sell zones
4,167–4,169: short-term reaction zone at the descending trendline and FVG
4,200–4,220: upper part of the same supply area
4,280–4,330: major H4 FVG / supply above
Support / buy zones
4,110–4,113: intraday support and potential retest area
4,080–4,070: minor support from recent consolidation
4,040–4,020: deeper pullback zone
4,000: key structural support; a break here would damage the bullish case
3,884: level that would confirm a medium-term bearish shift if price breaks and holds below
Trade scenarios (reference only, not financial advice)
Scenario 1 – Primary long: buy the dip into 4,110
Idea: stay with the bullish H1 structure, use the first decent pullback to get a better entry.
Entry: 4,110–4,113
Stop: 4,105
Targets: 4,125 → 4,140 → 4,180 → 4,200
I want to see price pull back into this zone after a push higher, ideally with a rejection wick or bullish candle confirming buyers are still in control.
Scenario 2 – Tactical short: fade the trendline at 4,167–4,169
Idea: counter-trend scalp from a clean confluence of resistance and FVG.
Entry: 4,167–4,169
Stop: 4,175
Targets: 4,155 → 4,140 → 4,120 → 4,105
This is not a swing short – it is a tactical trade against the intraday trend. Size should be smaller, and I would look to lock in profit or move to breakeven quickly if price reacts in our favour.
Scenario 3 – Breakout long if the trendline gives way
If gold pushes through the descending trendline and holds above the 4,170–4,180 zone:
I will shift back to a breakout-continuation mindset, looking to buy pullbacks above the broken trendline.
The next upside magnets then become 4,220 first and eventually the 4,280–4,330 FVG.
As long as 4,000 holds, I respect the upside and prefer to position with the trend, not against it. If we ever see a daily close below 4,000 and then 3,884, the whole story flips and I’ll start treating rallies as selling opportunities.
Trade the structure in front of you, not the headline noise. Manage risk around the shifting Fed expectations, and let the levels do the heavy lifting.
If this breakdown helps with your game plan, follow Brian for more gold updates during the US session and drop your own view in the comments so we can compare scenarios.
Techincalanalysis

XAU/USD: Gold Uptrend - Buy at 4,090 & 4,044 USD📊 Market Structure
Gold is maintaining an upward structure after creating a series of bullish BoS from the Demand zone. Currently, the price is technically pulling back to discount zones, where the BUY side has more advantages.
Above, the 4,206 USD zone is confirmed as OB Bearish , acting as strong resistance and a potential reversal point for the SELL side.
Below, the discount zones including Fibo–Buy 4,090 and OB Bullish 4,044–4,047 USD are reasonable places to wait for BUY to continue following the main trend.
💎 Key Technical Zones
• Fibo–Buy Zone: 4,085 – 4,095 → priority BUY zone
• FVG Reaction Zone: around 4,095 – 4,105 → signal present → BUY immediately
• OB Bullish: 4,044 – 4,047 → deep, safe BUY zone
• OB Bearish: 4,206 → strong SELL zone
• Partial resistance for SELL scalp: 4,169 – 4,186 – 4,206 – 4,237
🎯 Trading Plan – BUY (Main Priority)
1️⃣ Main BUY – Fibo–Buy 4,090
• Entry: 4,085 – 4,095
• SL: below 4,060
• TP1: 4,169
• TP2: 4,186
• TP3: 4,206 / 4,237
→ This is the most beautiful discount zone according to structure + fibo + trendline.
2️⃣ BUY on Reaction – FVG
If the price only touches FVG 4,095–4,105 and then shows a strong rejection candle:
• BUY immediately when there is a signal
• Target remains: 4,169 → 4,186 → 4,206 → 4,237
3️⃣ Defensive BUY – OB Bullish 4,044
• Entry: 4,044 – 4,047
• SL: 4,020
• TP1: 4,095
• TP2: 4,169
• TP3: 4,206
→ This is the “last bottom” zone before the uptrend is threatened.
🎯 Trading Plan – SELL SCALP (Not the Main Trend)
Zones where SELL can react when a reversal candle appears:
• 4,169 USD
• 4,186 USD
• 4,206 USD (OB Bearish)
• 4,237 USD (Supply)
Entry SELL: when there is a clear rejection (H1 long wick / engulfing)
SL: above the zone 10–15 USD
TP: back to 4,186 → 4,169 → 4,128
→ These are counter-trend scalp orders, only for flexible traders.
🧠 Vincent’s View
The main trend is still up, adjustments down to FVG – Fibo – OB Bullish are all beautiful BUY opportunities.
The BUY side dominates as long as 4,044 is not broken – SELL is only secondary, BUY remains the main play.
“Buy at discount, sell at reaction — that’s how the market moves.”
⏰ Timeframe: 1H
✍️ Analysis by: Captain Vincent

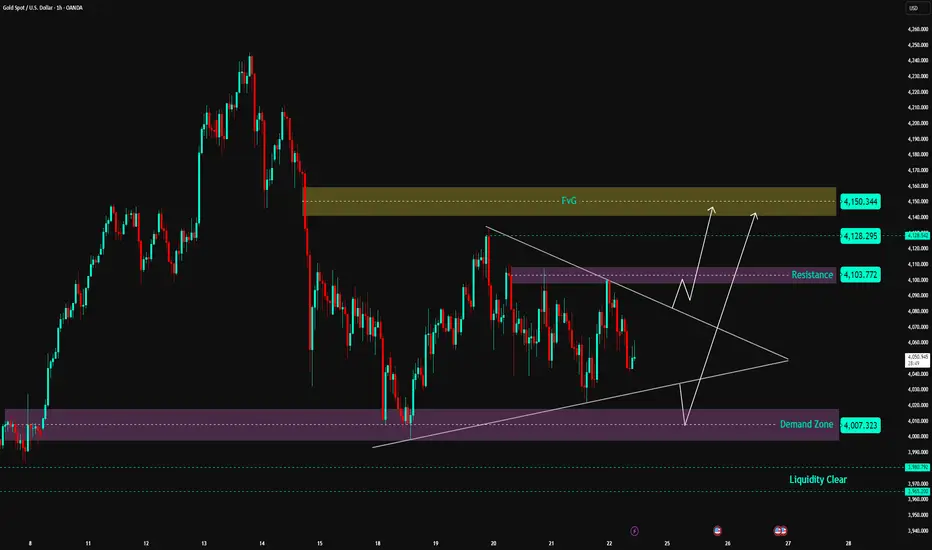
Gold Set to Explode from Triangle Pattern—Act Now!📊 Market Structure
Gold is entering a tight accumulation phase within a Symmetrical Triangle pattern – indicating compression before a strong breakout.
On the downside, the price is still supported by the Demand Zone 4,007 – 4,020 USD , which is the main support area for the medium-term uptrend structure.
On the upside, the Resistance Zone 4,103 – 4,110 USD continuously exerts pressure, causing price rejection.
Currently, gold is trading right in the middle of the compression triangle → the market is preparing to choose a direction.
Looking at the wave structure, the trend slightly leans towards a break up to sweep liquidity in the high area.
💎 Key Technical Zones
• ⭐ FVG Supply Zone: 4,128 – 4,150 USD → expected strong reaction area if price breaks up
• 🟣 Resistance Zone: 4,103 – 4,110 USD → decisive area for direction
• 🟪 Demand Zone: 4,007 – 4,020 USD → strong base maintaining structure
• 🟦 Liquidity Clear: 3,980 USD → risk area if price collapses the triangle
🎯 Trading Plan – Two Possible Scenarios
1️⃣ BUY – Wait for Breakout from Triangle (priority scenario)
If the price breaks the resistance zone 4,103 – 4,110 with a strong H1 closing candle:
• Entry: 4,112 – 4,115
• SL: 4,095
• TP1: 4,128
• TP2: 4,145
• TP3: 4,150 (reach FVG)
→ This is a trend-following setup, with a high probability of sweeping liquidity above after the break.
2️⃣ BUY – Retest Demand Zone 4,007 – 4,020
If the price continues to follow the triangle pattern and falls to the trendline + demand zone:
• Entry: 4,010 – 4,017
• SL: 3,990
• TP1: 4,103
• TP2: 4,128
• TP3: 4,150
→ This is a very strong confluence area between Demand Zone + Trendline + pattern base.
❌ SELL? When is it valid?
Currently, selling is not prioritized, as the price is still above the Demand Zone and the larger structure still favors an uptrend.
Selling is only valid if the price:
• Breaks strongly below 4,007 USD
→ At this point, the market turns bearish, with a distant target of 3,980 USD.
🧠 Vincent’s View
Gold is under strong compression. When the triangle pattern is broken, the move will be extremely fast and decisive.
The current trend leans towards breaking up and heading straight into the FVG area 4,128 – 4,150 USD.
Just be patient and wait for the confirmation candle — don’t predict, react to the market.
⚡ “Breakout is born from pressure — patience profits.”
⏰ Timeframe: 1H
📅 Update: 24/11/2025
✍️ Analysis by: Captain Vincent
Brian – Gold Money Flow Map for the US Session TodayBrian – Gold Money Flow Map for the US Session Today
Technical analysis – trendline, FVG, and two clear scenarios
On H4, gold is still maintaining a medium-term uptrend line drawn from the end of October. The decline in the Asian session this morning was not strong enough to break the structure; the price touched the trendline and then bounced up, indicating that the sellers have not yet "crushed" this support area.
Current structure: The price is accumulating around the 4,050–4,080 area in a sideways candle cluster, lying on the uptrend line and above the 4,000 support.
Above, the 4,120–4,170 area is an FVG + important supply zone; higher is a larger FVG around 4,280–4,330 – if "filled," it is a potential area for a strong profit-taking move.
Below, the 4,000 mark is a key support; losing this mark, the price could quickly slide to the 3,884 area – marked on the chart as the level confirming a medium-term downtrend if breached.
Until 4,000 is broken, I consider this an accumulation area with a high possibility of "fake breaks" on both sides – so prioritize trading according to the trendline, not guessing tops and bottoms in the noise area.
Key levels
Resistance / sell zone: 4,100–4,110: buy confirmation zone, if rejected will become short-term supply
4,170–4,173: FVG / supply, medium-term short zone
4,280–4,330: large FVG above
Support: 4,048–4,050: trendline + intraday breakout zone
4,022–4,005: next support if the price slides off 4,040
4,000: psychological and structural support
3,884: final support; breaking down will confirm a medium-term downtrend
Trade scenarios (for reference, not investment advice)
1. Sell break intraday – follow the trend if the trendline breaks
Entry: sell when the price breaks the short trend at 4,048–4,050
SL: 4,056
TP: 4,040 → 4,022 → 4,005
Idea: if the price breaks below the current accumulation cluster and short trendline, I want to follow the initial selling force, targeting the adjacent support area 4,022–4,005. When the order goes right, SL can be moved to BE around 4,040.
2. Sell “premium” – short at the upper FVG zone
Entry: 4,170–4,173
SL: 4,178
TP: 4,160 → 4,145 → 4,122 → 4,100
This is a price zone I consider "beautiful" for medium-term trading if the market gives a deep retracement. FVG + H4 resistance converge; if the price is strongly rejected here, the TPs are successively the lower demand zone and the current range bottom.
3. Buy only after clean breakout – do not rush to catch the bottom
I am only interested in buy orders when the market structure truly confirms:
Trigger: H1/H2 candle closes clearly above 4,100
Entry: buy right around 4,100 after breakout
SL: 4,092
TP: medium-term towards the 4,145 → 4,170 → 4,230+ depending on momentum
This scenario considers 4,100 as the "exit door" from the current accumulation area. If this area holds as new support, buyers will have a clearer advantage and the money flow could push the price up to gradually fill the upper FVGs.

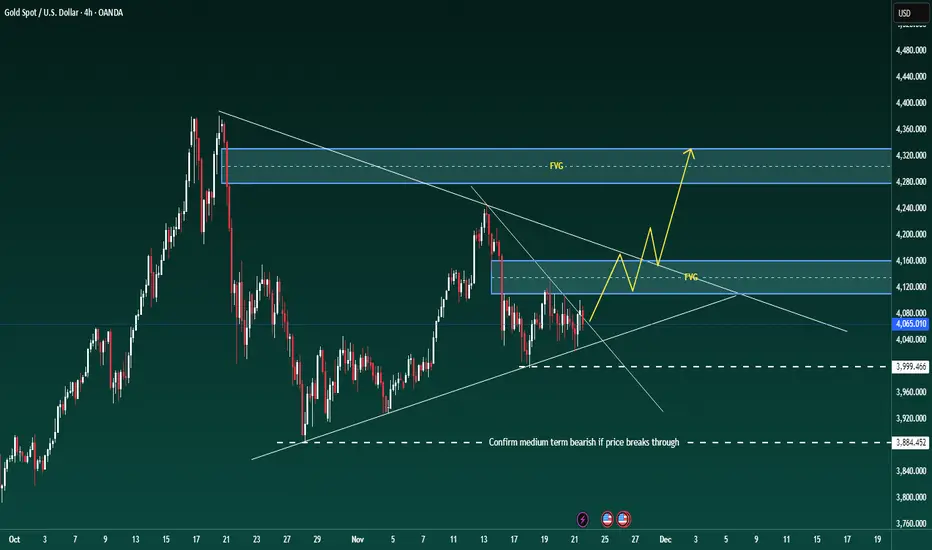
LiamTrading – XAUUSD H4 | Gold accumulates on the trendlineLiamTrading – XAUUSD H4 | Gold accumulates on the trendline, waiting to break the structure for a breakout
After testing the upward trendline twice, gold bounced up and then moved sideways around the 4065 area. On H4, this price zone has accumulated for almost a week – indicating that the selling force is not liquid enough to push the price down deeply, while there is still plenty of price gap above according to Fibonacci. My preferred scenario: gold continues to "compress" within the triangle, then breaks out to create a new wave.
Macro – Fed context
Fed member Collins emphasized that there is still reason to be cautious about cutting rates in the December meeting. She stated:
This is a complex phase, and it's not unusual for internal disagreements within the Fed.
The Fed must balance between the two goals of employment and inflation, which are moving in opposite directions.
This makes it difficult for the market to clearly price the interest rate scenario, so gold continues to choose to accumulate around important technical zones instead of breaking out in one direction.
Technical Analysis – Trendline, Fibonacci, Volume Profile
The current H4 structure is a triangle model with:
A downward sloping trendline from the old peak 42xx.
An upward sloping trendline from the late October low, acting as dynamic support.
Zone 4060–4070: the "balance" price zone last week – where the price moved sideways the longest, serving as a reference point for the short-term trend.
Key levels: 4132: near resistance, coinciding with the VAH area of the current Volume Profile.
4171: higher resistance, near the Fibonacci 1.0 area of the recovery wave.
4242: Fibonacci extension confluence zone (1.618) + historical resistance – where strong profit-taking is likely.
4347: 2.618 expansion zone – reference target if the peak is successfully broken.
4022 and 3997: important support close to the lower trendline – main buy zone if there is a liquidity sweep.
When the price decisively breaks out of one of the trendlines, the new trend on H4 will be clearer; the trading plan will follow this breakout direction.
Risk management and invalidation
H4 closes below 3997: the triangle structure is broken downward, fully prioritizing sell orders to lower zones – at that point, medium-term buy orders should not be held.
H4 closes above 4245 with good volume: considered a successful triangle peak breakout, discard all sell orders in this area and focus on buying according to the new trend.
Which scenario are you leaning towards for next week: breaking up to test 4242–4347 or sweeping down to 4022–3997 before bouncing back? Leave a comment and follow the LiamTrading channel on TradingView for daily XAUUSD updates.

XAUUSD – ACCUMULATION TRIANGLE ON D1💛 XAUUSD – ACCUMULATION TRIANGLE ON D1, AWAITING A NEW BREAKOUT THIS WEEK 🎯
🌤 Overview of the New Week
Hello everyone, Lana here 💬
Gold, after a very strong rise from the 3,500 region to above 4,400, is entering a "resting" phase on the D1 frame: the price continuously tests the upward trendline but has not yet broken it to confirm a downtrend.
The market is clearly waiting for a real breakout before forming a new medium-term wave.
Next week, we have CPI and PPI – important inflation data that could act as a catalyst to push gold out of the current accumulation zone.
💹 Technical Analysis (Daily Triangle)
On the D1 frame, when connecting the descending peaks and ascending bottoms, gold is in a narrowing triangle pattern.
The upward trendline below is still maintained, indicating that the medium-term trend has not reversed.
Below are important zones:
≈ 3,890: if the price closes below this area, it could confirm medium-term weakening.
Fibonacci & psychological resistance zone 3,800–3,900: strong support, confluence with old price structure.
POC Volume Profile around 3,650: if a deep decline scenario occurs, this will be the next price attraction zone.
Above, the old peak zone around 4,300–4,400 remains a large liquidity zone, a natural target if gold breaks the upper edge of the triangle.
In summary: the more compressed the triangle, the stronger the breakout – the direction will depend heavily on CPI/PPI data & Fed expectations.
🎯 Reference Trading Plan (Medium-Term)
💖 Scenario 1 – Maintain Uptrend (priority when the trendline is not broken)
Observe the reaction at the D1 upward trendline (area around 4,000).
If the price continuously bounces from the trendline and stays above the 3,890 area, you can:
Prioritize buying according to the trend at support retests on H4–H1.
Medium-term targets: 4,150 → 4,250 → 4,300–4,400 if the triangle breaks upwards.
💢 Scenario 2 – Triangle Breaks, Shifts to Medium-Term Decline
If D1 closes below 3,890:
Consider this a signal confirming medium-term weakening.
Prioritize selling at newly formed resistance zones.
Step-by-step targets: 3,800 → 3,700 (POC) → 3,500 (strong previous support).
In both scenarios, specific entry points should be refined on smaller frames (H4, H1) based on price action/OB/FVG.
⚠️ Note News & Risk Management
Next week's CPI & PPI could be the "final blow," pushing gold out of the triangle – volatility can be wide and fast, spreads may widen.
Last week's NFP news hardly created big waves for gold after the US government shutdown, indicating the market is holding strength waiting for more important data.
🌷 Conclusion & Interaction with LanaM2
Gold on D1 is in the final stage of the accumulation triangle – this is a time where patient observation is as important as a beautiful entry point 💛
Next week, I will continue to update daily details on smaller frames so everyone can have more specific entry points.

Gold is compressed; next week’s US data will pick a side.Gold is being compressed, the upcoming US data week will determine which side is squeezed.
Good evening everyone, Brian here with a view on XAUUSD on the H2 and H4 frames for the upcoming week.
Fundamental Analysis – a "tailor-made" week for the USD
Next week is packed with US data, meaning gold will react more to numbers than narratives:
Core PPI, PPI, and Retail Sales
Initial Unemployment Claims
Prelim GDP q/q
Core PCE Price Index m/m – the Fed's preferred inflation measure
If inflation and growth come out weak, the market will lean more towards the slow growth / easing policy narrative. This usually puts pressure on the USD and supports gold, especially when real yields gradually decrease.
Conversely, stronger-than-expected data will strengthen the USD, increase yields, and create short-term downward pressure on gold. In such a context, price and liquidity areas around news release times will be more important than usual – typically, fading emotional spikes back to structural areas is safer than chasing the initial move.
Technical Analysis – triangle, FVG, and key support areas
On the H4 frame, gold is still trading within a broad triangle structure. The previous decline has stalled, with prices continuously reacting at the upward support line and around 4,000, but there has yet to be a clear breakout from the pattern.
When zooming into H1–H2:
The price has broken a short-term downtrend line and closed strongly above – this is an early signal that selling pressure in this move is weakening.
The nearest support is around 4050–4040, deeper is the 4000–3998 support band (marked on the chart as important support). As long as it holds above 4,000, the structure remains positive.
Above, we have a very important confluence area around 4135–4160 including:
Fibo 0.382 of the most recent main decline
An old fair value gap (FVG) and resistance block
Chart note: "Gold will go strong if it passes this price range" – aligns with my view: if the price accepts above this area, the potential for a stronger upward move will open up.
Around 4100 is an area prone to "large liquidity response" – expect strong profit-taking and position restructuring if the price returns to this area.
Currently, I consider the market to be accumulating above 4,000 in a corrective pattern, with a slight upward bias as long as 4,000 is maintained.
Key Price Areas
Resistance:
4100 – first liquidity area
4135–4160 – Fibo 0.382 + FVG + strong resistance
Support:
4050–4040 – nearest intraday support
4000–3998 – large frame support; if broken, the picture changes
3940 area – stronger support if 4k is breached
Trading Scenarios for Next Week
(All are for reference only, not investment advice.)
Scenario 1 – Buy when price corrects above 4,000 (foundation for the next upward wave)
Idea: follow the forming upward bias as the price respects the triangle support and the 4,000 mark.
Entry area: 4050–4040 or any clean retest of the broken downtrend line on smaller frames
Cautious position addition area: 4025–4005 if there is a deep sweep to 4,000 with a strong bounce reaction
Stop loss: below 3990–3988 depending on risk appetite
Targets:
First: 4100 (liquidity area)
Second: 4135–4140 (lower edge of FVG/resistance)
Extended: 4155–4160 if a strong continuation move appears
Signals to wait for: wick rejections from support, bullish engulfing candles, or clear intraday structural phase shifts to higher highs and lows.
Scenario 2 – Break & Retest Long above 4135–4140
If the price doesn't give a deep correction and runs straight up:
Condition: H2/H4 candle closes clearly above 4135–4140 and holds on retest
Entry: when price pulls back in a controlled manner to the 4135–4140 area, turning this area from resistance to support
SL: below 4120
TP: 4180 → 4200+ depending on momentum strength
This is the "gold goes strong" scenario as noted on the chart – viewing the FVG/0.382 area as a launchpad for a larger impulsive upward wave.
Scenario 3 – Bearish scenario if 4,000 is broken
If fundamentals and flows turn against gold, decisively pushing the price below 4,000, the bullish view needs to be set aside.
Condition: daily candle closes clearly below 4000–3998
Plan: wait for the price to retrace up to retest 4000–4020 from below
Entry: short when rejection signals appear at that retest area
TP: 3960 → 3940, then reassess the structure
When below 4,000, the triangle will break down, and the market is likely to hunt deeper liquidity areas before potentially forming a new medium-term upward wave.
In summary: as long as 4,000 holds, I prioritize the buy scenario on corrections, respecting the upward potential to 4135–4160 and beyond. If there is a decisive break below 4,000, the picture will reverse – then retracements up will be opportunities to look for shorts.
Trade according to what the structure shows, not what I hope for. Manage risk tightly around next week's data points and let the major price areas "do the heavy lifting."
If this perspective helps you plan better, don't forget to follow Brian for weekly gold analysis and share your scenarios in the comments to compare.
Bitcoin is in a clean daily downtrend right nowBitcoin is in a clean daily downtrend right now – every bounce is just providing fuel for the next leg until the structure says otherwise.
Good evening traders, Brian here with a higher-timeframe look at BTCUSD.
Fundamental analysis
Bitcoin has been under sustained pressure even as some funds continue to accumulate spot positions. A few key points:
Macro uncertainty and tighter dollar liquidity are weighing on high-beta assets. While gold has held up relatively well, the performance gap between BTC and XAU has been widening in recent weeks, highlighting a clear risk-off tone towards crypto.
On-chain and fund flows suggest that a number of crypto investors are actually de-risking and pulling capital out, which reduces market depth and makes downside moves more violent when liquidity is thin.
Narrative is still mixed: long-term holders and some institutions are happy to buy lower, but in the short term the order flow is dominated by forced selling, deleveraging and risk reduction.
Bottom line: the macro backdrop does not yet justify an aggressive “buy the dip” approach on BTC. Trend-following shorts remain safer than trying to call the bottom.
Technical analysis
Daily structure is clearly bearish:
We have a confirmed market structure shift on the left of the chart, with the prior higher-low support broken and a series of decisive lower lows since then.
The main bullish trendline from earlier in the year has given way, and price is now travelling within a steep descending leg.
BTC recently tagged the 1.618 Fibonacci extension of the last major swing, aligning with a prior liquidity pocket. That produced a sharp intraday bounce, but so far it looks like a reaction inside a downtrend, not a full reversal.
Around 75.4k we have an important daily support zone. If this level is broken and accepted below, it opens the door to a deeper flush towards the next large support band lower on the chart.
Overhead, there is a clean imbalance/FVG and prior distribution area around 108k, with an intermediate resistance block around 96–97k and a nearer supply zone around 88k. These are prime locations to look for fresh shorts if price retraces.
For now my bias is simple: look to sell rallies into premium levels; any longs are tactical, short-term trades off key support only.
Key levels
Resistance / short zones:
88,000 – first reaction zone, “pay attention to the reaction”
96,500–97,200 – main short entry area for medium-term positions
108,000 – higher FVG / major daily supply
Support / long-only intraday zones:
75,400 – key support + 1.618 Fib/liquidity zone
74,000–72,000 – deeper support if 75.4k fails
Trade scenarios (for reference, not financial advice)
1. Short the first meaningful pullback – 88k area
Entry: 88,000
Stop: 90,000 (above local structure)
Targets: 82,000 → 78,000 → 75,500
Idea: treat 88k as the first supply zone in a downtrend. If price bounces from current levels and stalls here, I’m looking for rejection (wick rejections, failed break, or a clear shift in intraday structure) to join the trend. Once price moves in favour, I would look to pull the stop to breakeven and let the position run.
2. Core swing short – 96.5k–97.2k zone
Entry: 96,500–97,200
Stop: 99,000
Targets: 88,000 → 82,000 → 75,500
This is my preferred “medium-term” sell area. It aligns with a more significant daily supply block and offers better risk–reward if the larger bearish leg continues. Any squeeze into this region after a series of lower lows is, in my view, a controlled opportunity to reload shorts.
3. Tactical long only at deep support
Entry: 75,400–74,800
Stop: 73,800
Targets: 82,000 → 88,000
Here I would only consider a short-term long if we see a clean liquidity sweep into the 1.618 extension and strong rejection (long lower wicks, aggressive buy-back). The idea is simply to trade the bounce back into resistance, not to fight the higher-timeframe downtrend.
If BTC loses 75.4k and starts closing below it on the daily, I would become much more cautious on any long exposure and focus almost entirely on short setups towards the lower “important support” zone on the chart.
Trade with the trend, respect your risk, and don’t get trapped trying to be a hero at the bottom of a falling market.
If this BTC breakdown adds value to your plan, make sure you follow Brian for more daily BTC and gold analysis, and share your own view in the comments so we can compare scenarios.

XAUUSD–FRIDAY BEFORE PMI: MAINTAINING HEAD AND SHOULDERS PATTERN💛 XAUUSD – FRIDAY BEFORE PMI: MAINTAINING HEAD AND SHOULDERS PATTERN, WAITING TO BREAK RANGE 4132–3998 🎯
🌤 1. Overview
Hello everyone, it's Lana here again 💬
Today is the last Friday of the week, the market is waiting for PMI and preparing to enter a phase with a lot of important data in December.
Meanwhile, BTC has been rising faster than XAU in recent weeks, indicating that speculative money is leaning towards crypto, while gold is temporarily moving sideways accumulating.
The US Department of Labor will release the November employment report on December 16, which is 6 days after the December Fed meeting. In other words, the Fed is in a "blackout" state regarding labor data for nearly another month – this forces the market to price in advance, making gold's volatility range wide but lacking a clear trend.
💹 2. Technical Analysis – Range & Head and Shoulders Pattern
On the H3/H4 frame, gold is fluctuating within the large range of 4132 – 3998.
The price wave is gradually narrowing towards the end of the triangle, represented by:
Lower highs,
Higher lows,
→ When one of the two boundaries is broken, a new trend is likely to explode in the direction of the breakout.
The inverse Head – Shoulders – Head pattern has not been broken:
Left shoulder – Head – Right shoulder are all above the rising trendline.
For the final wave of the pattern to follow the rhythm, the price needs to confirm surpassing 4109:
When closing a candle above 4109, the short-term uptrend is confirmed,
At that point, gold can aim for higher liquidity areas such as 4132 → 4145 → 4200.
Conversely, if gold breaks 3998, this will be both:
breaking the range bottom,
and negating the Head and Shoulders pattern,
→ opening the possibility of a deeper decline to the 3960–3920 area.
🎯 3. Reference Trading Scenarios
💖 BUY Scenario – following the pattern & range bottom support
1️⃣ Buy at support 3998–4000
Entry: 3998–4000
SL: below 3990 (depending on risk management)
TP: 4025 → 4040 → 4078
2️⃣ Buy when confirmed above 4109
Condition: Price closes a candle above 4109, confirming the Head and Shoulders pattern is maintained.
Entry: around 4100–4105
SL: 4090
TP: 4132 → 4145 → 4200
💢 SELL Scenario – trading the upper boundary of the range
Sell: 4130–4132
SL: 4138
TP: 4110 → 4095 → 4070 → 4045
Selling should only be considered as scalping against resistance within the range, not the main trend if the Head and Shoulders pattern is still valid.
⚠️ 4. Notes & Risk Management
Range 4132–3998 is still controlling the market:
Above 4109 → prioritize Buy according to the short-term uptrend.
Below 3998 → consider shifting bias to Sell following the breakout.
PMI, Fed expectations, and upcoming employment data may trigger unexpected volatility, therefore:
🌷Gold is at the intersection of technical patterns and macro stories 💛
Be patient and wait for reactions at 3998 and 4109, as these are the two key points that determine whether we enter a new upward wave or a deeper decline.
💛 Like – 💬 Comment – 🔔 Follow LanaM2 to follow gold with me every day ✨

Brian here with the gold outlook for November 20thGood morning everyone, Brian here with the gold outlook for November 20th. The ABC correction phase of gold is nearly complete, and the market is preparing to enter a new wave phase amidst a flurry of USD data today.
Fundamental Analysis
Today's focus remains on the US labor data: NFP (or revisions), Unemployment Rate, and Initial Jobless Claims.
If the data shows a cooling labor market, expectations for the Fed to soon pivot to a rate-cutting cycle will rise, weakening real yields, putting pressure on the USD, and supporting gold prices.
Conversely, "too good" data will strengthen the dollar, allowing for a short-term repricing move, potentially dragging gold down to lower liquidity zones before recovering.
US session liquidity may be thin before the news release, making it prone to spikes due to algorithms and large flows simultaneously adjusting positions.
Overall, the macro backdrop still favors "buying the dip" for gold, but you must accept strong volatility around news time.
Technical Analysis
On the chart, gold has completed an ABC corrective wave within a descending channel, part of a larger uptrend.
The current descending channel only serves as a corrective leg after the previous upward wave; prices are trading above the "mean" area of the bullish structure, indicating the larger market structure remains bullish.
Below is the liquidity zone / demand zone 4013–4015, coinciding with the previous low and the lower channel boundary – if there's another stop-hunt to this area, it is still considered an opportunity to join the upward move, as long as 4008 is not breached.
Above, the 4086–4100 cluster is the decision zone: breaking and holding above here will confirm exiting the corrective channel, triggering an impulsive leg towards resistances 4132–4146 and further to 4187.
In summary, the main bias remains bullish, prioritizing buy strategies at support zones or after breakout confirmation.
Key Price Levels
Resistance: 4086 – 4100 – 4110 – 4132 – 4146
Support: 4040 – 4030 – 4015
Trading Scenarios
Buy Scenario 1 – Continuation Breakout
Entry: 4086
SL: 4078
TP: 4100 – 4120 – 4140
Prioritize when price breaks up and retests 4086–4100 as a new support zone, confirming exit from the descending channel.
Buy Scenario 2 – Deep Liquidity Sweep
Entry: 4015–4013
SL: 4008
TP: 4030 – 4045 – 4070
Watch for strong price reactions at the demand zone, with pin bars or engulfing candles signaling order flow returning to buyers.
Sell Scenario – Sell Reaction at Strong Resistance
Entry: 4144–4146
SL: 4151
TP: 4132 – 4120 – 4100
Short-term sell strategy, leveraging the high supply zone if price rises straight up without sufficient accumulation.
The medium-term upside target if the bullish wave develops as expected remains the 4187 area.
What do you think of this scenario? Remember to follow Brian for daily gold insights and comment your views below to join the discussion.

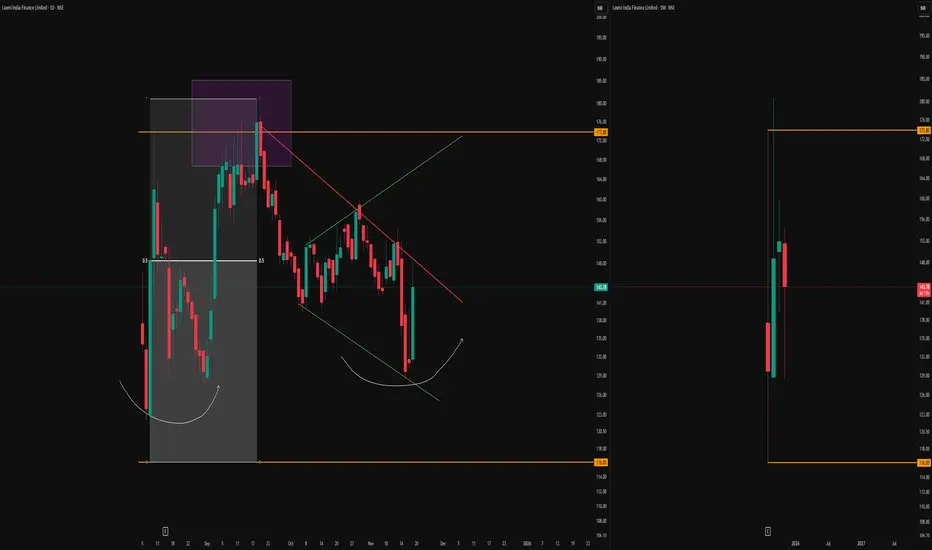
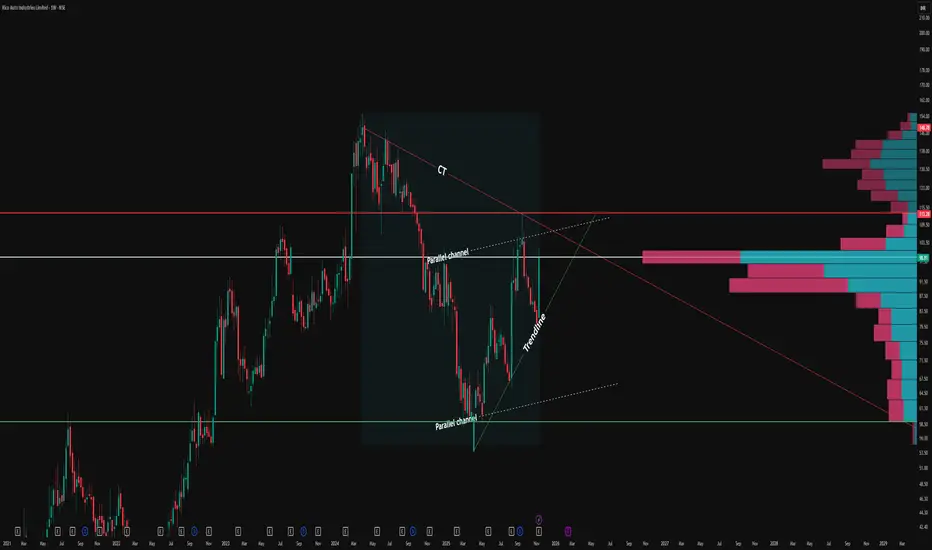
Multi-Timeframe Structure and Supply Observations-Green Broadening Pattern
A distinct broadening pattern is forming, mapped out by the green lines on the daily chart. This structure highlights expanding volatility, which often captures both swing highs and lows as price oscillates between opposing boundaries.
-Monthly High-Low Anchors
The orange horizontal lines represent the high and low of the first monthly candle, visible on the right—these serve as crucial long-term reference levels.
-Purple Box and Monthly Supply Manipulation
Up near the orange monthly resistance, the purple box marks a period of price interaction and ‘manipulation’ around the top supply. This box encapsulates a classic area where aggressive sellers and liquidity seekers converge, sometimes engineering fakeouts or squeezes before the real direction is chosen.
-Equilibrium and Rounded Higher Lows
Within the broadening pattern, a clear equilibrium zone is formed (represented by the midline drawn through the structure). This acts as a median for price oscillations and often becomes a pivot for both upward and downward moves. The two semi-circular white arcs on the left chart illustrate the emergence of higher lows
-Context from Monthly Timeframe
On the right, the monthly chart remains essential for framing all of the above
This analysis is solely observational and intended for educational purposes. No forecasts or trade signals are provided. Please exercise full discretion and undertake your own due diligence before making any trading decisions.
Consolidation happening in BBTC (Bombay burmah trading)1. is having consolidation pattern between 1750 - 2100 levels
2. One can watch for breakout above 2100 with good Risk : Reward
3. stock has give strong results attracting buyers and accumulation seen at 1850 levels
with strong buyer coming taking stock to 2050 levels in single day
4. stock may test its all time high if breaches 2400 levels

Leela Palaces Hotels & Resorts Ltd – Inverted Head & ShouldersLeela Palaces has formed a clean Inverted Head & Shoulders pattern on the 75-minute timeframe, signalling a potential trend reversal after weeks of sideways movement.
Price has now broken above the neckline zone (~₹443–₹445) with a strong bullish candle, supported by improving volume — indicating buyers stepping back in.
A sustained move above the neckline could push the stock toward the measured target near ₹473–₹475, which aligns with previous swing supply.
🎯 Key Levels
CMP: ₹445.60 (+1.76%)
Neckline Zone: ₹443 – ₹445
Pattern Target: ₹472 – ₹475
Support Zone: ₹430 – ₹433
Stop-Loss: Below ₹430 (75-min close basis)
📈 Technical View
Clear Inverted H&S structure with shoulders at ₹428 & ₹435, and head at ~₹420.
EMA alignment turning positive (bullish slope developing).
Breakout candle above neckline confirms strength.
Volume improving during the breakout → added confirmation.
Immediate resistance now becomes support; a retest of ₹443–₹445 may offer opportunities.
🧠 View
Leela Palaces is breaking out of a well-formed Inverted Head & Shoulders pattern. If the price holds above the neckline, the stock may move towards the ₹473–₹475 zone. Watch for retest entries and volume continuation.

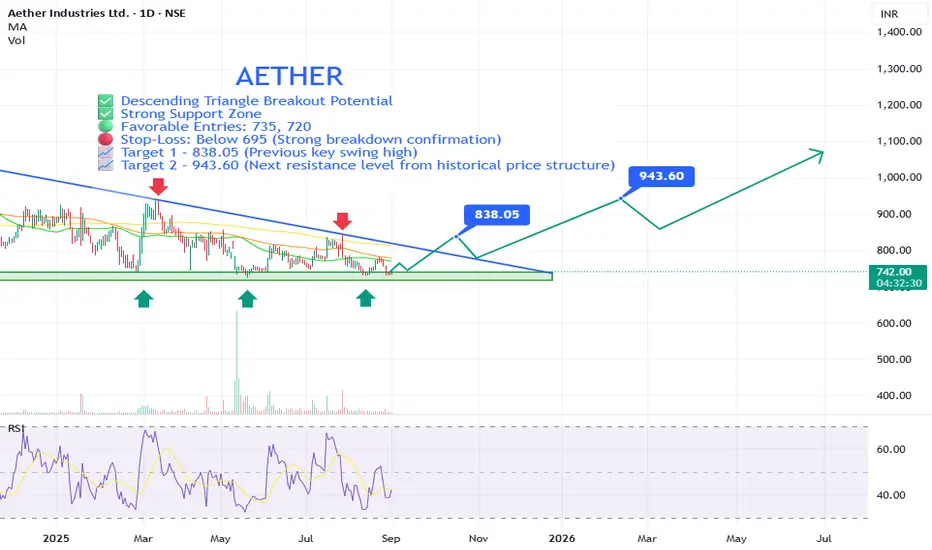
AETHER Bullish Reversal Setup with Strong Risk-Reward PotentialAether Industries Ltd is showing signs of a potential trend reversal from a well-established support zone, supported by a descending triangle breakout pattern and improving technical indicators. This setup suggests a strong risk-reward opportunity for swing traders and positional investors.
⚡ Key Technical Points:
🔵 Descending Triangle Breakout Potential: The price is nearing a breakout from a long-term descending triangle. A breakout above the trendline (~₹778–₹790) could trigger a strong uptrend.
🟢 Strong Support Zone: ₹700–₹720 has held as solid support multiple times (as marked by green arrows), indicating strong demand at these levels.
🟩 Bullish Divergence on RSI: Relative Strength Index (RSI) is showing higher lows while price remains flat or lower, indicating bullish divergence—a sign of potential reversal.
🟢 Favorable Entries: 735, 720
🔴 Stop-Loss: Below 695 (Strong breakdown confirmation)
📈 Target 1 – 838.05 (Previous key swing high)
📈 Target 2 – 943.60 (Next resistance level from historical price structure)
✅ Why This Is a Technically Strong Setup:
✅ Multiple Support Bounces: 700–720 zone has been tested at least 4 times in the last year, showing strength.
✅ Volume-Based Reactions: While volume is low now, past spikes at support zones suggest institutional interest.
✅ Clear Risk Management: Stop-loss is tight (~6–7%) with targets offering 1.5–3x risk-reward potential.
✅ Potential Trend Reversal: Break above descending trendline and moving averages could signal a shift to bullish structure.
✅ Long Base Formation: The stock has been consolidating for over a year—long base formations often lead to explosive moves.
📢 Disclaimer: This is not financial advice. Always do your own research or consult with a professional before making investment decisions.
How Counter Trendlines and Parallel Channels Reveal Price StructThe CT (Counter Trendline) as the prime technical feature. The red CT line distinctly marks recurring lower high rejections, shaping significant supply pockets and creating low-liquidity price zones at every inflection point.
Each touch validates the CT’s relevance, highlighting how price is repeatedly capped at these lower highs before reversing downward.
Overlaying this, a hidden parallel channel (dotted white lines) frames the swing movement. The channel not only encapsulates price but also serves as a running test of trend strength: each upper boundary touch confirms resistance, while bottoms act as support.
Notably, more hits at the upper parallel line than the base typically signal rising underlying bullish energy, especially when accompanied by the green trendline’s upward momentum.
No breakout, no prediction—just objective structure. The parallel channel and trendlines, when mapped carefully, elevate clarity on price balancers, guidance zones, and the ongoing duel between support and rejection.
Observe how these formations reveal crowd psychology and liquidity placement without forcing a directional view.
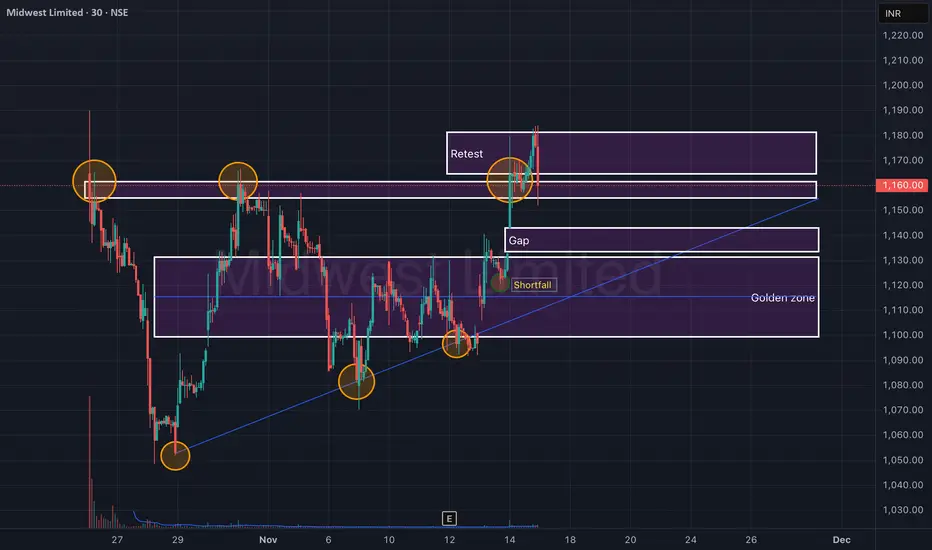
Midwest Ltd – Retest Confirmation After Breakout (30-Min)Midwest Ltd has shown a clean breakout–retest structure on the 30-minute timeframe, respecting both the trendline support and supply zones. The price successfully reclaimed the ₹1,140–₹1,150 range after a short pullback, confirming a bullish retest setup.
The chart highlights how historical rejections (orange circles) have turned into support retests, strengthening the validity of the breakout. If momentum sustains above ₹1,165, a continuation move toward ₹1,180+ could unfold.
🎯 Key Levels:
CMP: ₹1,160 (+3.95%)
Immediate Resistance (Retest Zone): ₹1,165 – ₹1,180
Support / Gap Zone: ₹1,130 – ₹1,145
Golden Zone (Major Support): ₹1,090 – ₹1,115
Stop-Loss: Below ₹1,120 (on 30-min closing basis)
📊 Technical View:
Ascending structure forming higher lows along trendline support.
Gap zone retested successfully, showing demand absorption.
Shortfall recovery followed by a sharp volume rise on breakout.
Sustaining above ₹1,165 may lead to a new swing leg toward ₹1,200.
🧠 View:
Midwest Ltd is showing a textbook breakout–retest structure. Sustaining above ₹1,165 with volume confirmation could trigger a quick 3–4% upside, while ₹1,115 remains the key demand zone.
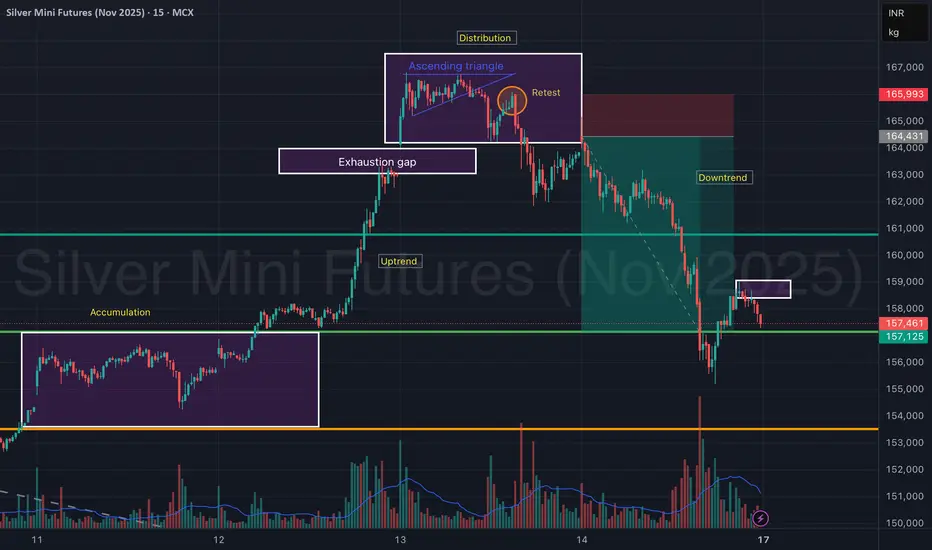
Silver Mini Futures (Nov 2025) – Accumulation to Distribution Silver Mini Futures on the 15-min chart clearly showcases a complete market cycle structure — transitioning from accumulation → uptrend → distribution → downtrend, providing an excellent study in price behavior and volume confirmation.
The move began with accumulation around ₹1,55,000, followed by a strong uptrend breakout, leading to a sharp rally. However, as price entered the ascending triangle near the ₹1,66,000 zone, momentum weakened, signaling distribution.
An exhaustion gap and a failed retest confirmed a reversal, leading to a steep downtrend, which remains active after a minor pullback.
📊 Phase Breakdown:
Accumulation Phase: ₹1,54,800 – ₹1,55,800
Sideways base formation with increasing volume at lows.
Uptrend Phase: Breakout above ₹1,56,000 triggered momentum.
Distribution Phase: Formed an ascending triangle with weak breakout follow-through.
Retest failure at ₹1,65,000 signaled exhaustion.
Downtrend Phase: Sharp decline with heavy volume, currently finding support near ₹1,57,000.
🎯 Key Technical Zones:
Resistance: ₹1,64,400 – ₹1,66,000 (supply zone)
Immediate Resistance (Retest Box): ₹1,58,200 – ₹1,58,800
Support Zone: ₹1,56,800 – ₹1,57,100
Major Support: ₹1,54,500
🧠 View:
Silver Mini Futures is currently in a downtrend continuation phase after a distribution top. A minor retest near ₹1,58,800 could invite short opportunities, while only a sustained move above ₹1,60,000 may signal trend reversal strength.
LiamTrading – XAUUSD H1 | Two scenarios for the new weekLiamTrading – XAUUSD H1 | Two scenarios for the new week: wait for reactions at 4100 & Fibonacci zone – prioritise bullish trades when the market recovers
Gold is completing a technical rebound after a sharp drop, and H1 is showing two clear scenarios for the new week. The medium-term trend remains a corrective decline, but on H1, the price is in a rebound phase, so bullish trades will be prioritised – as long as the lower liquidity zones are maintained.
The key this week lies at 4100, where FVG, Fibonacci, and liquidity converge – this is the decisive point to see if gold will bounce back or continue to decline deeply.
🔍 Technical Analysis (Fibonacci • Trendline • Liquidity • Volume Zone)
Fibonacci H1: The price may rebound to Fib 0.5 (~4140–4150) – a zone with high liquidity & likely to show a bearish reaction.
Fib 0.382 (~4120–4130) is currently the first short-term resistance.
Price Structure: The medium-term downtrend is still present, but H1 is forming a rebound wave → prioritise buying when the price pulls back at the support zone.
The descending trendline is still controlling the market. If it breaks the trendline + holds above 4130–4150 → the uptrend is confirmed stronger.
Important liquidity zones:
4100: liquidity confluence + previous bullish resistance → strong reaction zone.
4085 and 4060: liquidity bottoms – if breached, it will trigger a deep decline scenario.
4032: FVG + Fibonacci bottom – the "break or hold" zone for buyers.
Key resistance this week: 4161 – 4187 – 4138 – 4111
📈 TRADING SCENARIOS FOR THE NEW WEEK
Scenario 1 – Bullish trade (priority)
Logic: Gold is rebounding; if it holds 4100 and pulls back strongly → target is the upper Fibonacci zone.
Entry: 4100–4111
SL: 4090
TP: 4138 → 4161 → 4187
Suggestion: Wait for strong signals like pin bar or engulfing H1 to confirm the rebound bottom.
Scenario 2 – Bearish trade (when the market fails to hold the bottom)
Logic: If gold breaks the H1 bottom and retests 4100 without holding → the medium-term downtrend continues to activate.
Entry: 4100–4108 (retest after break)
SL: 4120
TP: 4085 → 4060 → 4032
Suggestion: Only enter when H1 closes below 4100.
🌍 Macro Analysis – Fed causes market noise
According to the latest data from CME Watch:
54.1% chance the Fed maintains rates at 375–400 bps
45.9% chance the Fed cuts rates
The ratio is almost balanced → the market is very indecisive, creating unpredictable volatility ahead of the 10/12 meeting.
In this environment, gold often reacts strongly to unexpected news, so prioritise trading at liquidity zones – wait for clear confirmation.
⚠️ Invalidation Conditions
Price closes below 4060 → fully prioritise bearish trades.
Price closes above 4161 → strong bullish trade activated, discard all sell setups.
What scenario are you preparing for the new week?
Please comment & hit Follow on LiamTrading channel to receive the earliest analysis every day!

XAUUSD – H4 SCENARIO FOR THE WEEK 17–21/11 💛 XAUUSD – H4 SCENARIO FOR THE WEEK 17–21/11 🎯
🌤 1. Overview
Hello everyone, it's Lana here again 💬
The new week begins with a narrowing trading range on the H4 chart, signalling that gold is preparing for a more significant move. The current medium-term trend needs to break the descending trendline above to confirm the return of the buyers.
💹 Technical Analysis
📉 The end-of-week downtrend is entering a technical rebound phase and is likely to continue declining towards the 4000 trendline – a confluence with a strong liquidity zone.
🟣 Key price levels to watch include: 4138 – 4200 – 4212 – 4037. These are liquidity concentration points, expected to have a clear reaction according to market sentiment.
🔹 Traders can use Fibonacci retracement to spot selling entry points, combined with confirmation signals on smaller time frames (M15–M30).
🌐 Macro Context
The financial market is facing difficulties as US tax policies change continuously, putting pressure on both Gold and Bitcoin.
The end of the year is also a characteristic phase of the economic slowdown cycle, where the market tends to adjust more strongly.
🎯 Reference Trading Scenario (Reference Trading View)
Priority is given to selling according to the technical rebound, especially when the price enters the confluence Fibo + liquidity zones.
Buying is only considered when the price reacts strongly at the 4000 trendline or the 4037 zone.
🌷 6. Conclusion with LanaM2
Gold is in a zone preparing for a big move 💛
Be patient and wait for reactions at important liquidity zones to have a better and safer entry point.
If you find it useful, please 💛 Like – 💬 Comment – 🔔 Follow LanaM2 to receive daily gold analysis! ✨

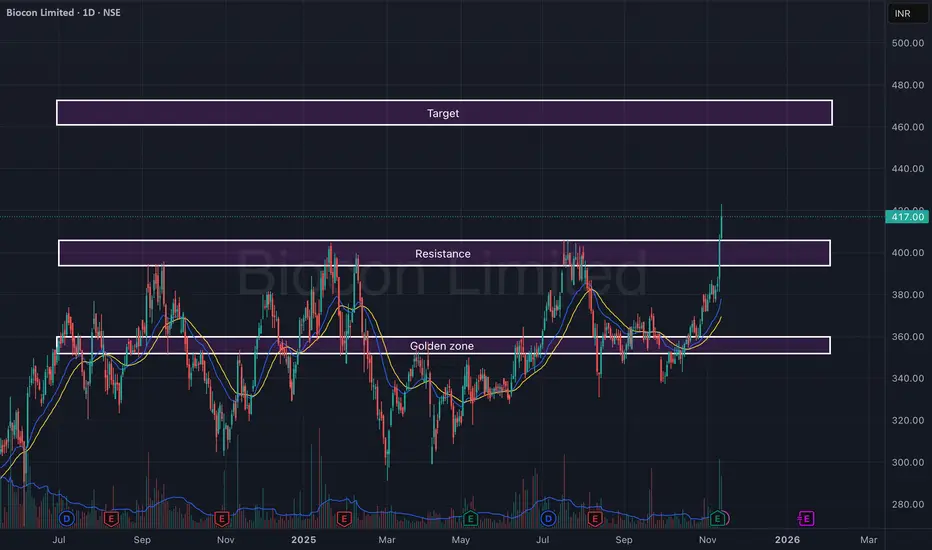
Biocon Ltd – Breakout from Resistance with Strong Volume SurgeBiocon has delivered a powerful breakout above its key resistance zone of ₹395–₹405, backed by a sharp volume expansion and strong follow-through candles. After months of consolidation within the golden zone (₹355–₹370), the stock has finally regained momentum, suggesting a potential trend reversal.
The structure now favors continuation toward the upper target zone, with EMAs aligning positively and momentum indicators supporting strength.
🎯 Key Levels:
CMP: ₹417.00 (+2.73%)
Golden Zone (Base Support): ₹355 – ₹370
Resistance (Now Support): ₹395 – ₹405
Target Zone: ₹460 – ₹475
Stop-Loss: ₹385 (on daily close basis)
📊 Technical View:
Resistance breakout with strong bullish candle and high volume.
EMA crossover (20 > 50) confirms short-term bullish trend.
Sustaining above ₹405 may lead to a momentum rally toward ₹460+.
Golden zone remains a reliable base for any pullback opportunities.
🧠 View:
Biocon has confirmed a breakout after a prolonged consolidation phase. Sustained momentum above ₹405 could lead to a steady move toward ₹470 levels in the short to medium term.
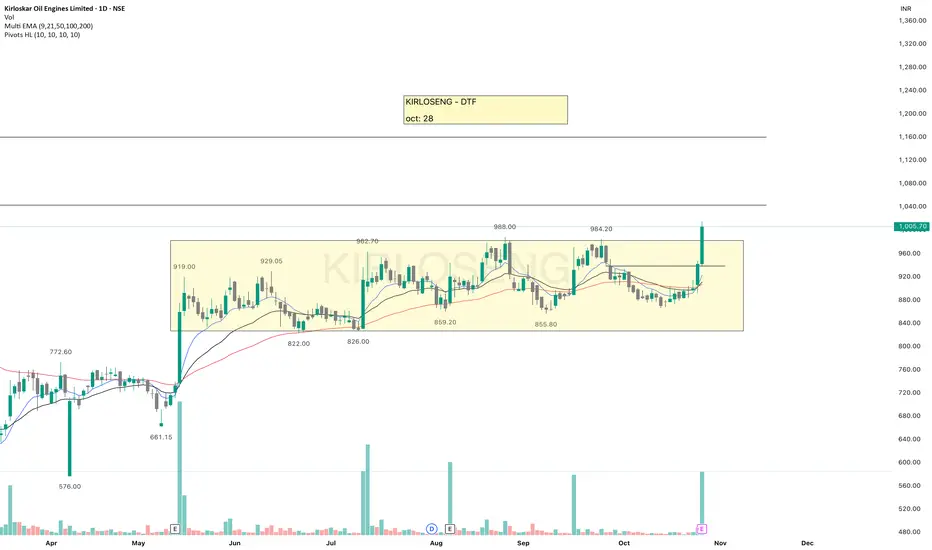
KIRLOSENGKIRLOSENG - The stock has given a breakout after consolidating in a range for over 5 months.
Volume is strong, and EMAs are aligning well, but a follow-up candle is needed for confirmation.
Market structure looks bullish but price seems slightly stretched so waiting for a small retracement would be ideal.
1040 is a nearby resistance.
Keep it on your watchlist for paper trading.
✅ If you like my analysis, please follow me here as a token of appreciation :)
in.tradingview.com/u/SatpalS/
📌 For learning and educational purposes only, not a recommendation. Please consult your financial advisor before investing.
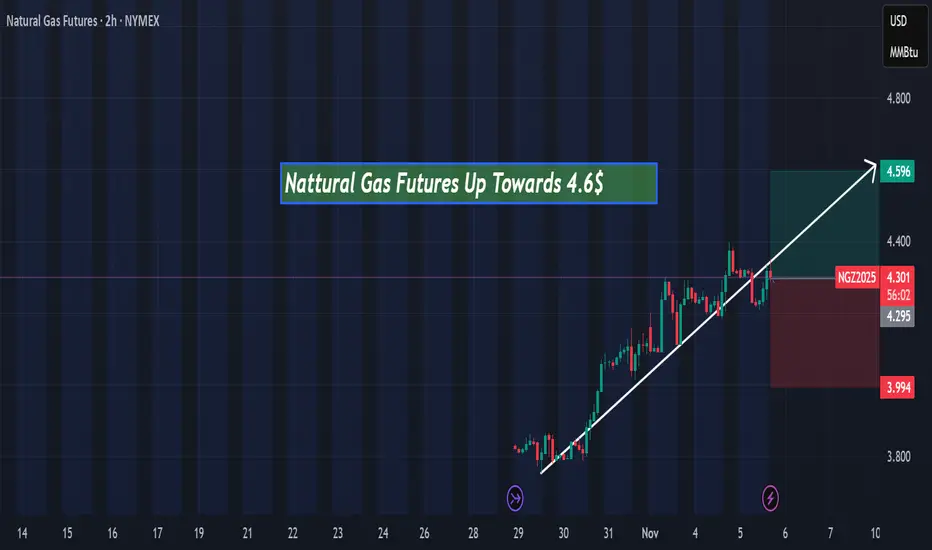
Natural Gas Futures Up towards 4.6$Hi everyone, today Natural Gas Futures is expected to rise toward $4.60 in the next few hours according to my technical analysis.
NUVAMANUVAMA looks good, overall structure is bullish.
EMAs are aligned, it has sustained the recent resistance breakout, now there is probability of an upside move.
There is another resistance nearby 7868.
Keep it in your watchlist.
✅ If you like my analysis, please follow me here as a token of appreciation :)
in.tradingview.com/u/SatpalS/
📌 For learning and educational purposes only, not a recommendation. Please consult your financial advisor before investing.
