TITAGARH RAIL SYSTEMS STOCKNSE:TITAGARH Stock take support from C point.
Buy sustain above the 915 rupees.
First Target is 970 to 980 rupees.
Second Target is 1035 to 1045 rupees.
Third Target is 1080 to 1090 rupees.
stoploss below 860 rupees at least one day candle closed.
Techincalanalysis

WIPRO - SWING TRADE - 23rd December #stocksWIPRO (1W TF)
Swing Trade Analysis given on 23rd December, 2023 (Saturday)
Pattern: RECTANGLE BOX BREAKOUT
- Breakout of Resistance - Done ✓
- Volume Spike near Breakout - Done ✓
- Retracement & Consolidation - In Progress
#stocks #swingtrade #chartanalysis #priceaction #traderyte #wipro

Momentum swing idea|Vidhi Specialty Food Ingredients LtdVidhi Specialty Food Ingredients Ltd
Vidhi Specialty Food Ingredients Limited, incorporated in 1994, is a leading manufacturer of Superior Synthetic and Natural Food Grade Colours. The company is Asia’s 2nd largest food colour manufacture
Fundamental :Strong
Market Cap ₹ 2,367 Cr. Current Price ₹ 474 Stock P/E 67.9
ROCE 17.6 % ROE 16.2 % Debt to equity 0.15
Promoter holding 64.3 % Quick ratio 2.08 Current ratio 3.00
Piotroski score 6.00
Profit Var 3Yrs 3.57 % Sales growth 3Years 21.6 %
Return on assets 11.1 %
This stock is already in momentum zone also look at reversal up move momentum.
if its continue we have to keep watch it closely.
although food colour business is in trend since long time.
keep in radar.
Note: I am not SEBI registered financial Adviser. I solely present my views on chart .I do not charge any kind of service. This is not buy sell recommendation.
If you like my ideas than like boost and follow me for more ideas.
Thanks and comment freely

Momentum swing idea| Rallis India LtdRallis India Ltd
Rallis India, a Tata Group company Group Co., has a history of over 150 years. The company is into manufacturing of Agrochemicals and is present across the value chain of agriculture inputs - from seeds to organic plant growth nutrients. Rallis is also in the business of contract manufacturing for global corporations.
Market Cap ₹ 5,597 Cr. Current Price ₹ 288 Stock P/E 56.4
ROCE 7.77 % ROE 5.37 %
Debt to equity 0.07 Promoter holding 55.1 %
Quick ratio 0.96 Current ratio 1.69 Piotroski score 6.00
Profit Var 3Yrs -19.6 % Sales growth 3Years 9.63 %
Return on assets 3.25 %
This stock is in momentum right now. also good fundamental.
keep in radar .
Note: I am not SEBI registered financial Adviser. I solely present my views on chart .I do not charge any kind of service. This is not buy sell recommendation.
If you like my ideas than like boost and follow me for more ideas.
Thanks and comment freely

PNB - SWING TRADE - 30th November #stocksPNB (1D TF)
Swing Trade Analysis given on 30th November, 2023 (Friday)
Pattern: ASCENDING TRIANGLE
- Neckline Breakout - Done ✓
- Retracement + Consolidation- Done ✓
- Pullback Candle - In Progress
#stocks #swingtrade #chartanalysis #priceaction #traderyte #pnb

Momentum Swing idea| K P R Mill Ltd K P R Mill Ltd
K.P.R. Mill is engaged in one of the largest vertically integrated apparel manufacturing Companies in India.
Market Cap ₹ 27,314 Cr. Current Price ₹ 799 Stock P/E 34.1
ROCE 24.4 % ROE 23.4 %
Debt to equity 0.21 Promoter holding 73.8 %
Quick ratio 2.33 Current ratio 3.99 Piotroski score 5.00
Profit Var 3Yrs 29.5 % Sales growth 3Years 22.6 %
Return on assets 15.4 %
This stock has good fundamental with weekly in momentum RSI above 55 .
this is debt free company. Keep in radar
Note: I am not SEBI registered financial Adviser. I solely present my views on chart .I do not charge any kind of service. This is not buy sell recommendation.
If you like my ideas than like boost and follow me for more ideas.
Thanks and comment freely

Momentum Swing Idea| ICICI Prudential Life Insurance Company Ltd ICICI Prudential Life Insurance Company Ltd
ICICI Prudential Life Insurance Company Ltd carries on business of providing life insurance, pensions and health insurance products to individuals and groups.
Market Cap ₹ 83,099 Cr. Current Price ₹ 577
Stock P/E 91.1 ROCE 10.0 % ROE 8.45 %
Debt to equity 0.11 Promoter holding 73.3 %
Quick ratio 1.10 Current ratio 1.10 Piotroski score 5.00
Profit Var 3Yrs -8.65 % Sales growth 3Years 33.0 %
Return on assets 0.33 %
This in in momentum stock with brand recognition. This purely chart pattern analysis.
Rsi above 55. keep in radar.
Note: I am not SEBI registered financial Adviser. I solely present my views on chart .I do not charge any kind of service. This is not buy sell recommendation.
If you like my ideas than like boost and follow me for more ideas.
Thanks and comment freely

Momentum Swing Idea| Large Cap chemical StockTata Chemicals Ltd
Incorporated in 1939, Tata Chemicals Ltd manufactures and exports basic chemistry and specialty products
Financial : strong
Market Cap ₹ 30,007 Cr. Current Price ₹ 1,178
Stock P/E 17.3 ROCE 11.6 % ROE 12.0 % Debt to equity 0.28
Promoter holding 38.0 % Quick ratio 0.79 Current ratio 1.22
Piotroski score 9.00 Profit Var 3Yrs -30.9 % Sales growth 3Years 17.5 %
Pledged percentage 0.00 % Return on assets 6.93 %
this stock from large cap with well known trusted brand . also in momentum with huge volume.
please read this chart and make some sense.
Note: I am not SEBI registered financial Adviser. I solely present my views on chart .I do not charge any kind of service. This is not buy sell recommendation.
If you like my ideas than like boost and follow me for more ideas.
Thanks and comment freely

DEVYANI INTERNATIONAL LTD STOCKNSE:DEVYANI Stock take support from C point.
Buy sustain above the 158 rupees.
First Target is 165 to 170 rupees.
Second Target is 175 to 180 rupees.
stoploss below trend line at least one day candle closed.

FASP levels for Nifty 06/03/2024The FASP for Nifty is listed for 06-03-2024. You can add this levels to your trade setup for better results. This should not be the only indicator but an additional tool to increase your winning possibilities.
What is Fibolysis Anchor SupRes Points(FASP)?
It is a unique level arrived by using Fibonacci Retracement , Fibonacci Extension , Standard Pivot levels under various Timeframes. It is an extensively analyzed level to draw the support and resistance levels for the next day. You can use these levels along with your trade setup to increase your winning odds.
Validity of the levels: 1 Day
How to use these levels?
The three levels on both sides are usually easily achievable. The Targets above are bit difficult to achieve in a single trading session. I use this fact to write intraday positions and to buy options.
Color Coding: Green is regular support and buying area, Red is strong exit area
Disclaimer: This is shared in the interest of educational purpose and for knowledge enhancement. Kindly refer it in the same light. I am not responsible for any profits or loss incurred based on this information.

FASP levels for Bank Nifty 06/03/2024The FASP for BankNifty is listed for 06-03-2024. You can add this levels to your trade setup for better results. This should not be the only indicator but an additional tool to increase your winning possibilities.
What is Fibolysis Anchor SupRes Points(FASP)?
It is a unique level arrived by using Fibonacci Retracement , Fibonacci Extension , Standard Pivot levels under various Timeframes. It is an extensively analyzed level to draw the support and resistance levels for the next day. You can use these levels along with your trade setup to increase your winning odds.
Validity of the levels: 1 Day
How to use these levels?
The three levels on both sides are usually easily achievable. The Targets above are bit difficult to achieve in a single trading session. I use this fact to write intraday positions and to buy options.
Color Coding: Green is regular support and buying area, Red is strong exit area
Disclaimer: This is shared in the interest of educational purpose and for knowledge enhancement. Kindly refer it in the same light. I am not responsible for any profits or loss incurred based on this information.

Tata Motors Limited - Breakout Setup, Move is ON...#TATAMOTORS trading above Resistance of 941
Next Resistance is at 1483
Support is at 600
Here are previous charts:
Chart is self explanatory. Levels of breakout, possible up-moves (where stock may find resistances) and support (close below which, setup will be invalidated) are clearly defined.
Disclaimer: This is for demonstration and educational purpose only. This is not buying or selling recommendations. I am not SEBI registered. Please consult your financial advisor before taking any trade.

AUDUSD Technical AnalysisThe Fed left interest rates unchanged as expected at the last meeting while dropping the tightening bias in the statement but adding a slight pushback against a March rate cut.
The US CPI beat expectations for the second consecutive month with the disinflationary trend reversing.
The US PPI beat expectations across the board by a big margin.
The US Jobless Claims beat expectations with the data remaining steady.
The latest US PMIs increased further from the prior month with the Manufacturing PMI beating expectations and the Services PMI missing.
The US Retail Sales missed expectations across the board by a big margin.
The market now expects the first rate cut in June.
AUD
The RBA left interest rates unchanged as expected with the central bank maintaining the usual tightening bias and data-dependent language. The recent Monthly CPI report missed expectations across the board which was a welcome development for the RBA.
The latest labor market report missed expectations by a big margin. The wage price index surprised to the upside as wage growth in Australia remains strong. The latest Australian PMIs showed the Manufacturing PMI falling back into contraction while the Services PMI jumped back into expansion. The market expects the first rate cut in August.
AUDUSD Technical Analysis 1-Day Timeframe
On the daily chart, we can see that AUDUSD broke above the key resistance level where we had also the red 21 moving average for confluence and extended the rally to new highs. The buyers are targeting the next resistance at 0.6623 but the momentum seems to be waning a bit. The sellers, on the other hand, will likely wait for the price to reach the 0.6620 level before piling in for new shorts or looking for some key breakouts on the lower timeframes.
AUDUSD Technical Analysis 4-hour Timeframe
On the 4-hour chart, we can see that the price has been diverging with the MACD recently. This is generally a sign of weakening momentum often followed by pullbacks or reversals. In this case, we got pullbacks into the red 21 moving average where the buyers kept on stepping in to target the 0.6620 level. The moving average and the black trendline will now be key levels for the sellers as they will need to break through them to gain more conviction for a bearish trend and target new lows.
AUDUSD Technical Analysis 1-hour Timeframe
Timeframe On the 1-hour chart, we can see that we have a resistance zone around the 0.6580 level which the buyers will need to break to increase the bullish bets into the 0.6620 level. There is no important data till next Tuesday, so the market will likely be driven by the technicals until then.
follow us for more trading ideas.

Graphite. Breakout stockInverse head and shoulder Break out and retest confirmation on weekly chart. W pattern on daily chart.
Buy price: 630
Follow base Trent line as stop loss.

TataTech consolidating and waiting for breakout.Trading in range on hourly chart. Range getting thinner. Accumulation being done. Investment opportunity above 1172 with a stop loss of 1135.

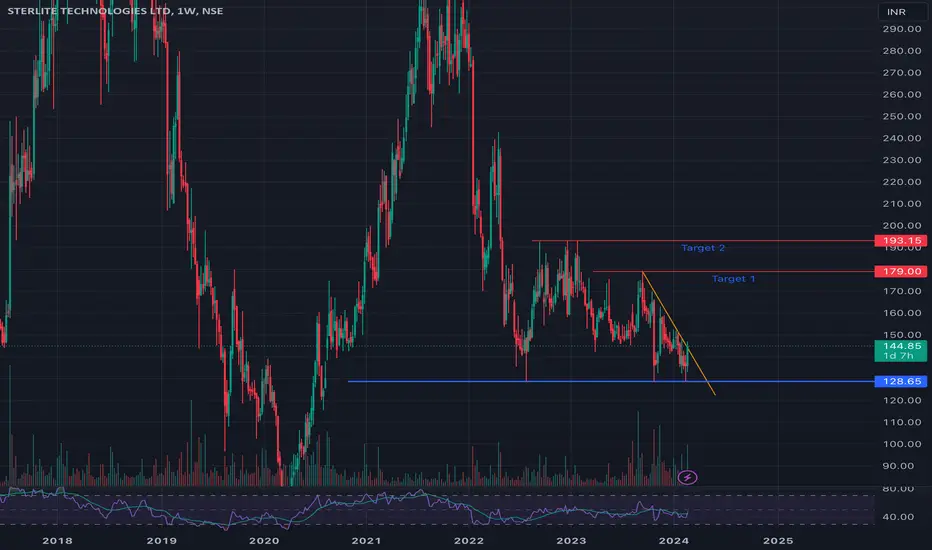
STLTECH Looking for breakoutTaking support at 128 on monthly chart. Breaking trendline at 144 on Daily and Weekly chart. Allow weekly candle to complete. Wait for retest and buy at breakout.
Insider Bar Formation / Mother Candle40 points Inside Bar 1160 to 1110
Any side breakout closing can get a TG of 37-40 points, wait for
Keep RR 1:2, Resistance 1200 & Support 1080

SPARC - Short TermOn Technical Indicators this stock shows bullish trend. While on the Weekly Chart the Stock has shown the break out of flag pattern. Buy @ 378.60, SL @ 360 & Tgt @ 423

Snowman Logistics - Short TermThis Logistics company has formed cup and handle formation on weekly charts. Technical Indicators show strength for the short run. Buy @ 74.40 with SL @ 62.58 and Tgt @ 93.24

Technical Analysis for Dish TV (DISHTV):Stock Name: Dish TV
Chart Pattern: Ascending Triangle pattern
Breakout: Confirmed breakout in the weekly timeframe
Volume: Volume is good, supporting the breakout
Stop Loss: ₹3.90
Target: ₹16
Risk-Reward Ratio: 1:4
Long-term Target: ₹16 within 6-12 months

see it is easy never make it tough for your mindWe can see there is the same scenario like gold long we can wait patiently and buy theabove 189.267 and then target the zone 189.530 so wait and watch

Bajaj Auto Ltd - Long Setup, Move is ON...#BAJAJ_AUTO trading above Resistance of 6186
Next Resistance is at 7865
Support is at 4506
Here are previous charts:
Chart is self explanatory. Levels of breakout, possible up-moves (where stock may find resistances) and support (close below which, setup will be invalidated) are clearly defined.
Disclaimer: This is for demonstration and educational purpose only. This is not buying or selling recommendations. I am not SEBI registered. Please consult your financial advisor before taking any trade.

MOMENTUM SWING IDEA 15 FEB 24Balaxi Pharmaceuticals Ltd| MOMENTUM SWING IDEA 15 FEB 24
Balaxi Pharmaceuticals Ltd is an IPR-based pharmaceutical Company engaged in producing, stocking, selling, and supplying branded and generic medicines
Financial: strong
Market Cap =₹ 639 Cr. ROCE = 38.5 % ROE = 32.2 %
Debt to equity = 0.12 Promoter holding = 71.2 %
Quick ratio = 1.40 Current ratio = 2.93
Profit Var 3Yrs = 96.0 % Sales growth 3Years =94.6 % Return on assets = 22.1 %
This is pharma sector stock with strong fundamental. Pharma sector is in momentum so I select this stock to ride. Rsi is also showing positive trend. lets see how market recognize it.
Note: I am not SEBI registered financial Adviser. I solely present my views on chart .I do not charge any kind of service. This is not buy sell recommendation.
If you like my ideas than like boost and follow me for more ideas.
Thanks and comment freely
