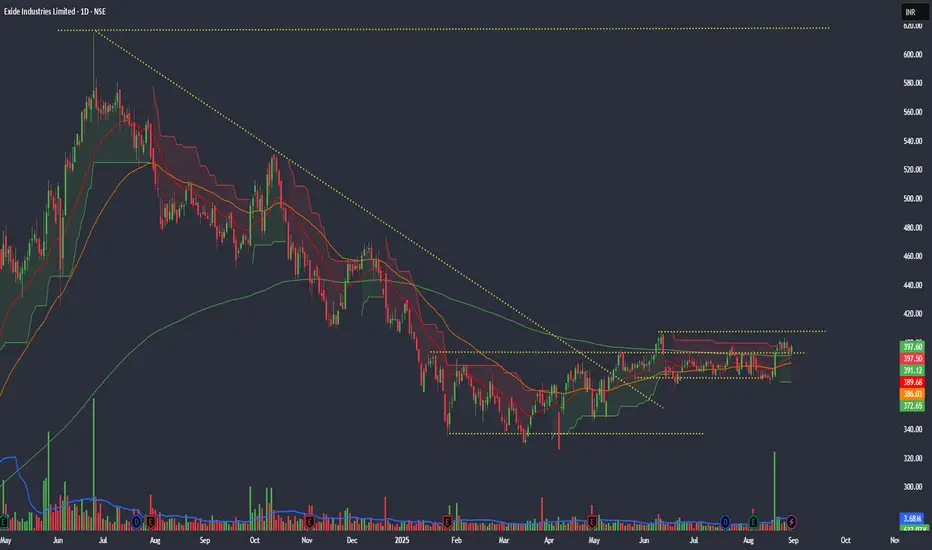
Exide Industries Ltd (EXIDEIND) – Breakout MomentumPrice Action
CMP: ₹396–400 (Aug 29, 2025)
Stock is consolidating near highs after strong rally.
Trading above 20 / 50 / 200 EMAs → confirms bullish structure.
Resistance: ₹405–410 (breakout zone)
Support: ₹389 → ₹385 → ₹365 (weekly base)
Upside Targets:
🎯 T1 = ₹430
🎯 T2 = ₹475
🎯 T3 = ₹535 (extended swing target)
Invalidation: Close below ₹385 → caution; below ₹365 → setup weakens.
Indicators & Momentum
RSI (14): ~62 → bullish, not extreme yet.
ADX: Strength building → supports continuation.
MFI: Above 70 → strong money inflow, but watch overbought.
MACD: Mixed; short-term pauses possible.
🧭 Trading View Bias
Bias: Bullish above ₹389
Short-Term: ₹405 → ₹430
Medium-Term: ₹475 → ₹535
Caution: Sustained close below ₹385 shifts bias neutral.
Disclaimer: This is a technical analysis for educational purposes only—not financial advice. Always perform your own due diligence before trading.
Techincalanalysis
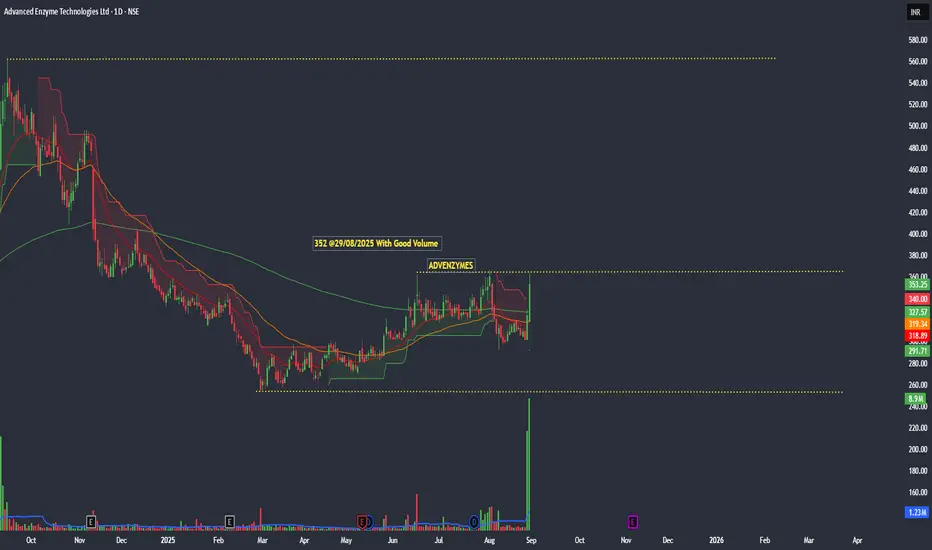
Advanced Enzyme Technologies Ltd_ Short-termAdvanced Enzyme Technologies Ltd (ADVENZYMES) – Technical Analysis
Current Price: ₹355–356 (as of Aug 29, 2025)
Stock has rallied +18% in 2 sessions, showing strong momentum.
Price has broken above key resistance at ₹336 (pivot), turning it into support.
📈 Indicators & Momentum
Moving Averages (MA20/50/200): Price is trading above all major EMAs, confirming bullish trend.
RSI (14): ~68 → approaching overbought zone, but still has room to push higher.
ADX (14): >30 → trend strength is strong and valid.
Volume: Delivery volume spiked 7.5x above average, confirming institutional interest.
🧭 Chart Structure
Breakout above ₹336 pivot signals start of a fresh uptrend.
A daily close above ₹380 may open the path toward ₹410 – ₹455 zone.
Watch for consolidation near ₹350–₹360 before next leg.
⚡ Trading View
Bias: Bullish as long as price stays above ₹336.
Short-Term Target: ₹380 → ₹410
Medium-Term Target: ₹455
Invalidation: Close below ₹336 pivot may weaken trend.
Disclaimer: This is a technical analysis study for educational purposes only — not investment advice. Always do your own research before trading.
Gold Trading Scenario – Friday OutlookGold Trading Scenario – Friday Outlook
Hello traders,
Fridays are often challenging for forex traders. As the week closes, bankers wrap up their positions, creating unpredictable market moves. This is especially tricky for those who rely on timing-based strategies, so it’s important to watch the smaller fluctuations closely today.
Looking at the current gold structure, the uptrend remains intact. Buying pressure is strong enough to push towards the next projected levels. Technical indicators continue to support a bullish view, with MACD showing steady momentum as both volume and moving averages remain positive.
From an Elliott Wave perspective, gold is moving in **wave 5**, which is typically an extended wave. This allows us to maintain a bullish outlook unless price breaks below **3386** and confirms with at least one candle close on the M15 timeframe or higher. In that case, the scenario would be invalidated. Until then, buying around this level with a stop-loss just below the key support zone (about 1 dollar lower) remains the preferred approach.
Selling opportunities are not yet ideal, but for those looking at short setups, the **3450 zone** should be monitored as a major resistance. In the shorter term, **3430** can act as a reaction level for temporary sells.
Fridays also tend to bring more news-driven traps, so be extra cautious. It’s a day that can really test less experienced traders.
This is my view for today’s session – use it as reference, and trade with discipline.
---
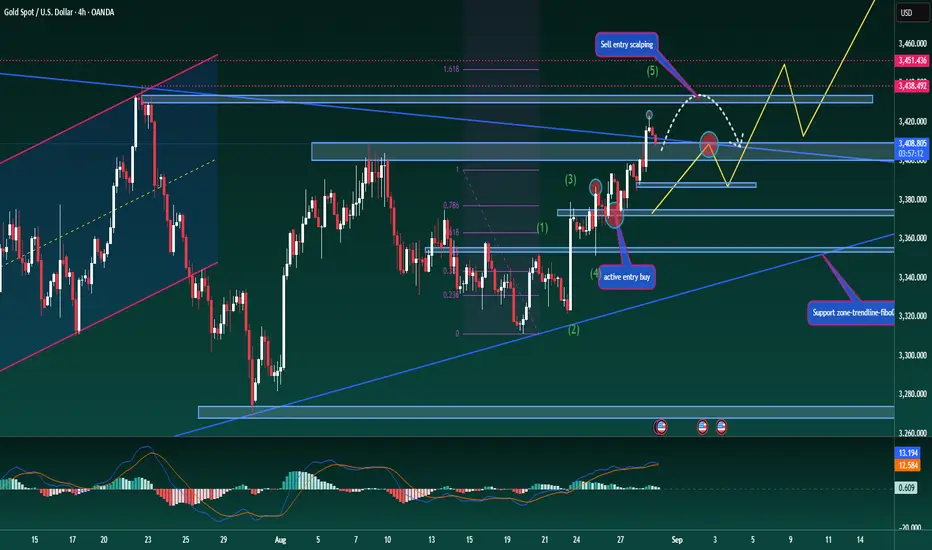
XAUUSD – Medium-Term Trading ScenarioXAUUSD – Medium-Term Trading Scenario
Hello traders,
Gold is moving into the final stage of its flag pattern. Medium-term traders are now waiting for a clear breakout confirmation, as that will set the direction for the next medium- to long-term opportunities. Once price confirms the break, the strategy is to enter immediately in the direction of the move.
Meanwhile, short-term and day traders continue to trade within the flag, looking for scalping opportunities.
From my perspective, the probability of gold breaking to the upside and continuing the main bullish trend is fairly high after such a long consolidation. To optimise entries, buying near the lower boundary of the trendline makes sense, with stop-losses placed immediately if the pattern breaks down. The key area to watch is Fibonacci retracement 0.5 at 3354, which acts as both dynamic and static support, as well as a strong Fibonacci level. This zone offers a reliable long-term buy opportunity.
Another potential early buy entry sits around 3372, where the previous candle showed strong bullish momentum. Positions here can be taken with tighter stops placed just below the nearest support.
This bullish scenario would only fail if price breaks below the lower trendline and closes firmly underneath it, which would confirm a reversal.
Wishing you success with this setup. If you share the same outlook, leave your thoughts in the comments so we can exchange ideas.

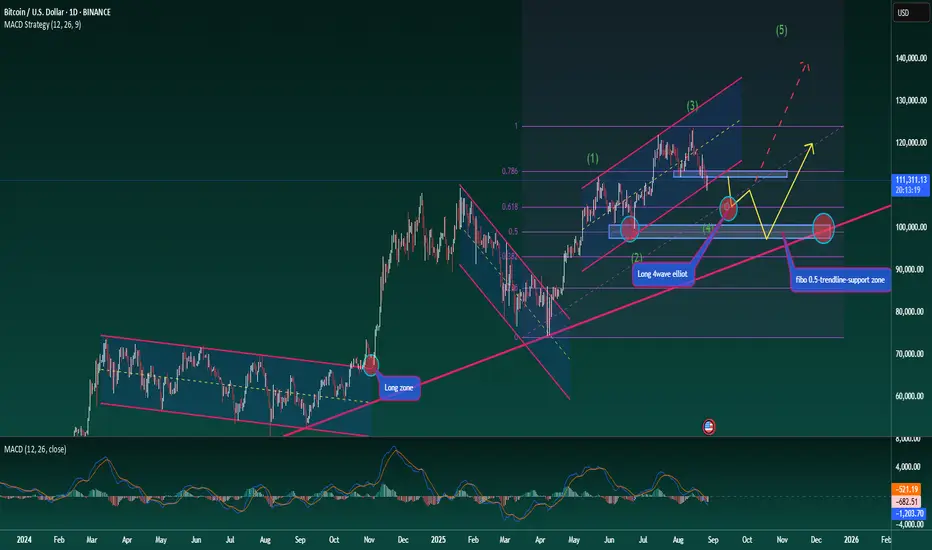
Bitcoin – Long-Term View with Elliott Wave StructureBitcoin – Long-Term View with Elliott Wave Structure
Hello traders,
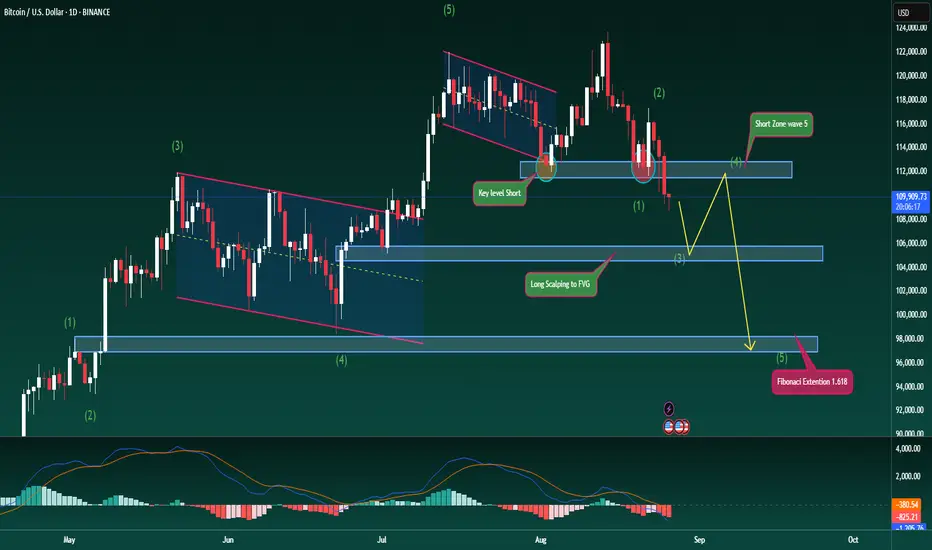
Let’s take a medium- to long-term look at BTC. The broader trend is clearly bullish, but for any uptrend to be sustainable, healthy corrections are necessary. At present, BTC is moving through a corrective phase, identified as wave 4 in the Elliott Wave structure.
To gauge how far this correction may extend before wave 5 begins, we can apply Fibonacci Retracement. Two key levels stand out: 0.618 and 0.5.
At 0.618, we see a strong support zone, but it may not yet be the decisive level for confirming the wave count. If BTC reacts positively here and rallies into wave 5, the Elliott structure remains clean and valid.
At 0.5, the level aligns with an ideal Fibonacci retracement ratio and also shows up as an important structural support on the chart. A break below this could trigger deeper downside, as highlighted by the ascending trendline.
Long-Term Trading Plan
Entry 1: Around Fibonacci 0.618 at 105k
Entry 2: Around Fibonacci 0.5 at 99k
This outlook fits a medium-term plan, but if the second zone (99k) provides a strong reaction, it could also become the base for a longer-term bullish structure.
Stay disciplined, monitor these levels closely, and trade with proper risk management.
What’s your view on BTC’s long-term structure? Share your thoughts in the comments.
Gold Scenario – Tracking the Medium-Term UptrendGold Scenario – Tracking the Medium-Term Uptrend
Hello traders,
Gold continues to follow the expected scenario. Price reacted at the Fibonacci 1.618 resistance, effectively completing the liquidity test. At present, the 3368 zone is a good area to look for buying opportunities.
The previous Elliott cycle has already completed its ABC waves, and gold now appears to be forming a new Elliott structure. Currently, price is likely in wave 3 of the uptrend, reacting at the H4 descending trendline with a mild pullback, before completing wave 5 with a breakout move from the channel and confirming the flag pattern on H4.
Strategy: Buy around 3368 with a strict stop-loss just below the previous swing low.
Target: 3410 is a reasonable profit level. After that, expect wave 4 to form and look for short opportunities from there.
The MACD remains supportive, trading above its average levels and confirming bullish momentum. At this stage, it’s all about timing entries correctly.
This is my personal outlook on gold in the short to medium term. Use it as reference and don’t forget to share your views in the comments so we can learn from each other.

Bitcoin Trend Reversal – Elliott Wave in PlayBitcoin Trend Reversal – Elliott Wave in Play
Hello traders,
Today we look at a fresh scenario for BTC as price has broken decisively below a major support zone, showing clear short-side strength. This could mark the beginning of a medium-term downtrend, signalling a shift in market structure.
The 112k level has been fully taken out after two strong rejections earlier, and now the market looks ready to seek lower levels, potentially targeting 97k–98k based on Fibonacci Extension.
From an Elliott Wave perspective, BTC is currently in wave 3 of the down cycle, and has not yet reached the reaction point for wave 4. I expect the 105k zone to act as support for this leg down. From there, price could bounce into wave 4 before completing wave 5 lower towards 97k, or even 95k. This would provide a solid area to plan medium-term long entries afterwards.
The MACD also supports the bearish view, with both volume and moving averages trending below, signalling strong downside momentum.
I’ve marked the key price levels on the chart for clarity. Please use this scenario as reference and manage risk carefully with your trades.
What’s your outlook for BTC here? Share your thoughts in the comments so we can discuss together.
Bitcoin – Trading Plan Update Bitcoin – Trading Plan Update
Hello traders,
The BTC scenario has played out well, with price reacting strongly at 110.4k and bouncing higher. This level has cleared much of the short-side liquidity, while the H4 candle could not close below the 111.8k support. As a result, long entries around 110k can still be expected to target higher levels, at least towards 115.5k.
The primary focus remains on the long side as long as price does not confirm a sustained bearish move. Long positions will remain valid until price breaks decisively below 110k.
For traders who already closed longs or missed the earlier entry, wait for a retest of the FVG zone near 111.5k. If price reacts higher, fresh longs around 113k can be considered.
Short-term selling opportunities may also appear near 115.5k and 117.2k, where price could face resistance.
My BTC strategies are still aligning well with current price action. That said, this is my personal outlook based on my trading method. Please trade responsibly, stick to your own plan, and manage risk carefully.
What’s your view on BTC right now? Share your thoughts in the comments below.
Gold – Weekly Opening Update Gold – Weekly Opening Update
Hello traders,
Gold is holding firm after last week’s strong rally. As mentioned in my earlier analysis, gold has completed an ABC Elliott Wave structure beautifully, with wave C pushing higher and meeting the original target perfectly.
As the new week begins, the market has opened quietly, with price consolidating around 3368. At this stage, gold is in an accumulation phase, and traders are waiting for a clear confirmation before taking fresh positions.
Gold has formed a minor resistance at 3359. If price breaks below this level, it could act as a short-term sell confirmation, with possible entries around 3366.
On the other hand, if gold holds steady or breaks above last week’s resistance high, the bias will shift to long-term buying opportunities.
Even if a sell plays out after breaking 3359, the next strong buy zone sits around 3345, aligned with the ascending trendline.
Since price is still within the flag pattern, trading is expected to remain focused on the market’s major liquidity zones. On the D1 chart, the structure continues to favour the upside bias. Any selling setups should be kept to short scalping plays for better risk control and higher accuracy.
This is my personal outlook for Monday’s session. Trade carefully and manage your account with discipline.
What’s your view on gold to start the week? Share your thoughts in the comments so we can learn together

NIFTY50NIFTY - all key EMAs are getting aligned at daily time frame.
It is at a support area and may give reversal from here.
In case it breaks this support then next support zone is 24670. No Trading Zone is clear.

Bitcoin – Medium-Term OutlookBitcoin – Medium-Term Outlook
Hello traders,
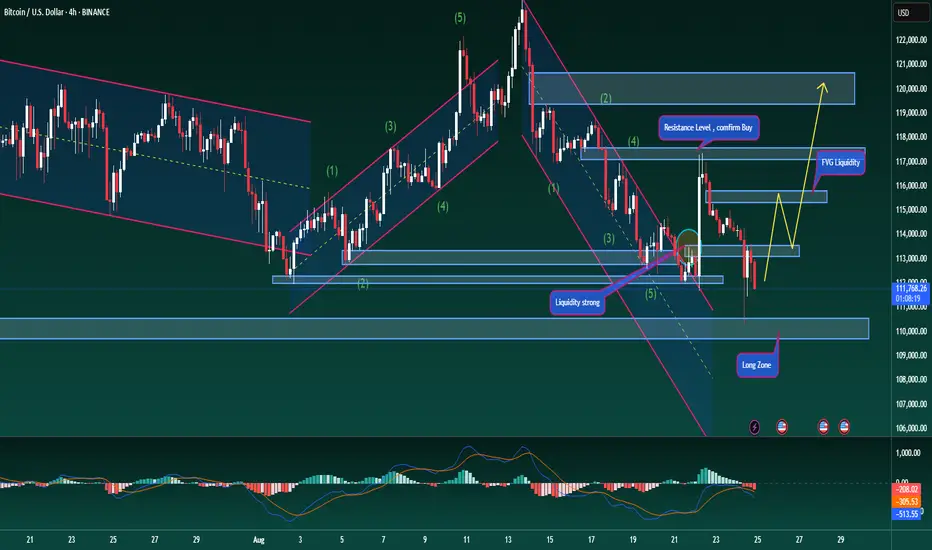
BTC recently made a strong breakout move, reacting precisely at the 117k level as expected. Currently, price is in a corrective phase, clearing the liquidity from last Friday’s bullish candle. The sharp rejection at 117k suggests we need to reassess the medium-term outlook.
The primary scenario remains bullish. The 113.4k zone is a key area to look for long entries, as buyers dominated this level earlier and liquidity from short traders still sits here. From a psychological perspective, we could see shorts exiting the market, fuelling a rally towards 115.7k. A confirmed break above 117k would strengthen the long-term bullish trend, opening the door for further long opportunities.
On the flip side, a reaction lower from 115.7k could present a short entry for the medium term. If support at 111.7k breaks, BTC may extend down to 110k, where strong historical rejections suggest a solid zone for fresh long positions in both medium and long-term outlooks.
This outlook is based on key support/resistance levels and major liquidity zones. Always trade with discipline and manage risk carefully to protect your account.
What’s your view on BTC here? Share your thoughts in the comments so we can trade smarter together.

Gold Daily Chart – Final Week of AugustGold Daily Chart – Final Week of August
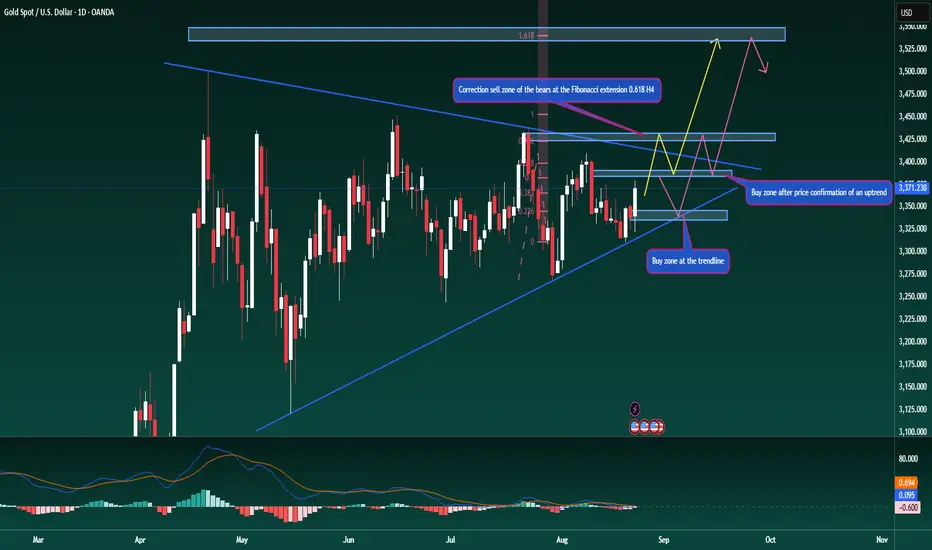
Hello traders, let’s discuss the gold outlook for the coming week.
Gold has continued its strong bounce after touching the ascending trendline on the D1 chart, in line with the outlook shared earlier. This move also makes the triangle pattern more valid. For the week ahead, price is likely to trade within the 3330–3410 range, about 80 dollars of movement.
While the long-term expectation is for gold to push towards new ATH levels, a confirmed breakout from this triangle is required first. After such a breakout, a short pullback is possible before the next leg higher (as shown on my chart).
On the H4 chart, Friday’s rally allows us to draw a Fibonacci Extension, pointing towards 3390 and 3430 as higher levels to watch. These zones could act as short-term selling opportunities, based on profit-taking sentiment from buyers.
On the daily timeframe, if the breakout from the triangle plays out, gold could extend as high as 3540, creating a new ATH – this is the long-term scenario. On the downside, if price pulls back, the ascending trendline around 3341 remains a key area to look for new buying opportunities.
Also note, this is the last week of August. On Friday, there could be a liquidity grab to rebalance gold’s value and settle large institutional flows, so caution is advised.
This is my personal outlook for XAUUSD for the week ahead. I hope it helps in building your own trading plan.
Share your thoughts in the comments so we can learn from each other.
Bitcoin Trend – Breakout from the Downward ChannelBitcoin Trend – Breakout from the Downward Channel
Hello traders,
BTC has broken out of its descending channel with a very strong candle, moving exactly as expected in the corrective rally. At present, price is reacting around 117k, which confirms a shift in structure. For the medium term, the primary trend should now be considered bullish. Traders can look for pullbacks around 114.5k – 113k to add fresh long positions.
From an Elliott Wave perspective, BTC is moving within the final ABC structure. The current move is wave B, and we will be looking to position long once wave C completes.
Target for this long scenario: 120k – 121k, where a mild correction may occur as liquidity is taken.
This is my personal outlook on Bitcoin. Always follow price closely and manage your account carefully to stay safe.
What’s your view on BTC’s breakout? Share your thoughts in the comments so we can trade better together.
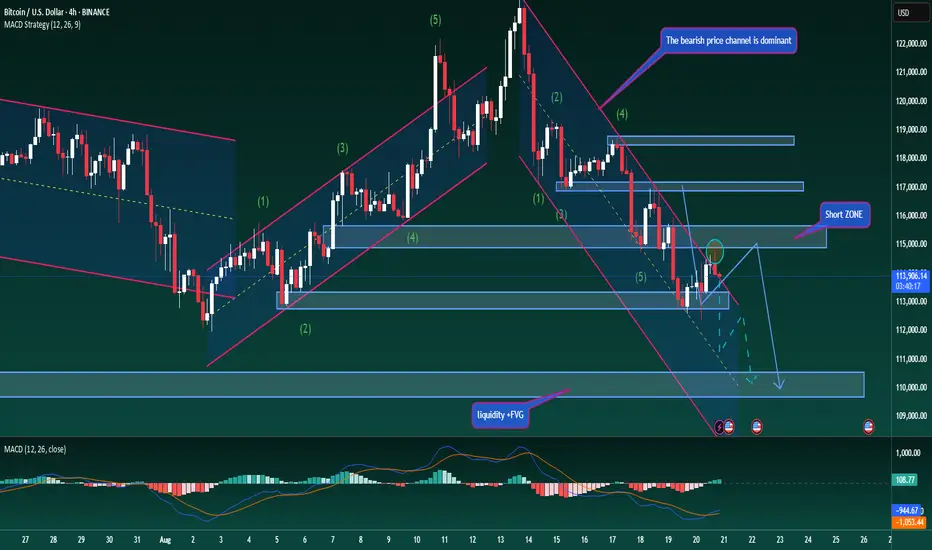
Bitcoin – Medium-Term Outlook for Long/Short TradersBitcoin – Medium-Term Outlook for Long/Short Traders
Hello traders,
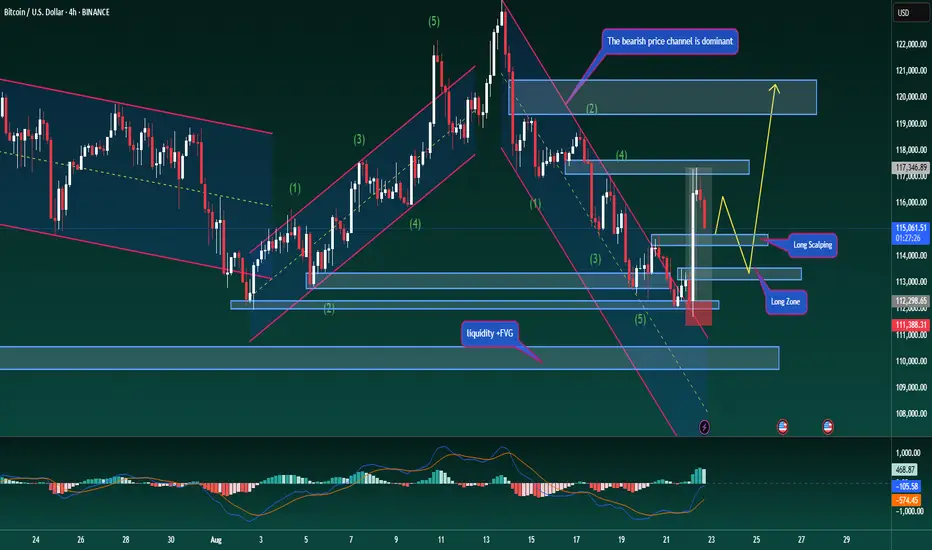
BTC continues to move within the descending channel – something we can all clearly see. Recently, price bounced strongly after touching the solid support zone near 112k, and now it is only about 2k away from the target level for a potential swing long entry.
If BTC manages to break above the 114.8k resistance, it could signal a short-term reversal, pushing towards 117.5k before resuming the broader downtrend. This scenario could act as a potential trap for those holding long-term short positions.
We also see early signs of structure changing: the trendline has already shown signs of breaking, with price trading above the descending channel. At the same time, MACD is showing rising volume and its averages are starting to curve upward. Together, these factors support the case for a short-term corrective rally.
Strategy: Consider long entries near the current zone, with the option to DCA if price breaks above 114.8k.
Please note this is my personal view — always manage risk and follow your own plan.
What’s your take on this setup? Share your thoughts in the comments so we can discuss further.
Gold – Medium-Term Buy StrategyGold – Medium-Term Buy Strategy
Hello traders,
Gold continues to move within wave B under Elliott Wave structure. I expect price to retest the trendline once more, with the strong support around 3325 — which already triggered a sharp bounce yesterday — likely to play a key role before wave C begins.
According to Elliott theory, wave C is often the strongest, and in this case, it could extend towards the 339x region. This offers a swing buy opportunity with a reasonable target of 30–40 dollars.
The MACD also supports this outlook, with volume holding above the average line and the MACD (green) remaining on top.
Key Resistance: 3348–3352, must be broken to open the way towards 339x.
Key Support: 3313, if broken, the scenario shifts and longer-term selling pressure could return.
Buy Zone: Around 3327, with profit potential of 40–60 dollars.
This is my personal outlook for gold this week. I hope it helps you align your trading plan.
What do you think about gold’s direction here? Share your views in the comments below.

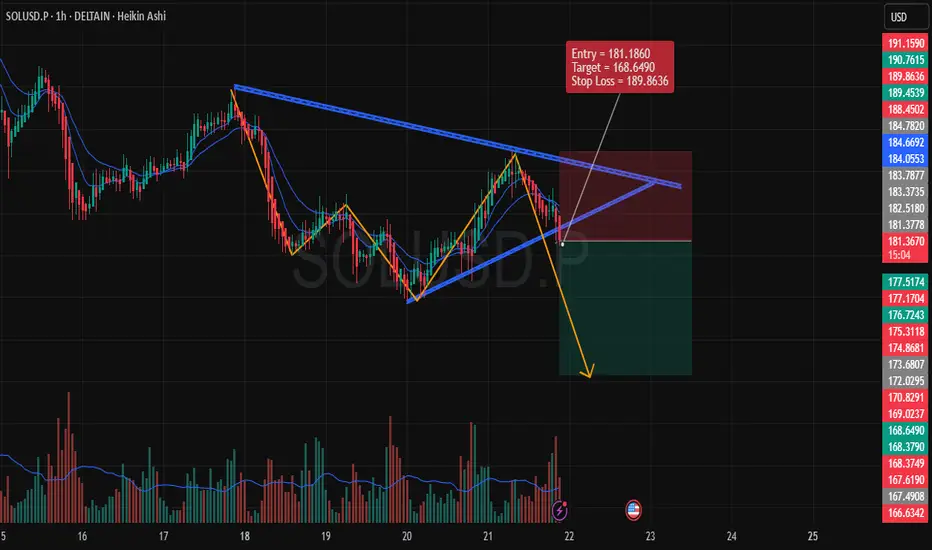
Bearish Setup on SOLUSD (1-Hour Time Frame)Entry Price: 181.1860
Target: 168.6490
Stop Loss (SL): 189.8636
1. Chart Analysis
We are observing a descending triangle pattern formation, which generally signals a bearish continuation once the price breaks downward.
The price action has already shown signs of rejection at the upper boundary of the pattern, reinforcing the possibility of a breakout to the downside.
2. Indicators & Confirmation
Volume Analysis: Noticeable spike in volume during the recent downward movement, which indicates strong selling pressure. This is crucial for confirming the potential bearish trend.
EMA Confluence: The price is below the 9 and 20 EMAs, which are crucial indicators of the current market trend. The EMAs are acting as dynamic resistance, further supporting the bearish scenario.
3. Risk Management
The stop loss is placed above the most recent significant high at 189.8636. This placement ensures that we protect against any false breakouts or short-term price reversals.
The target at 168.6490 is derived based on previous support levels and a measured move from the triangle pattern. This target is realistic given the market structure.
4. Price Action
The price action shows lower highs and lower lows, a typical characteristic of a downtrend. If this pattern holds, the next logical price move is to break downward through the support of the triangle.
5. Conclusion
Overall, this setup provides a solid bearish opportunity, backed by technical patterns and strong momentum indicators. The risk-to-reward ratio is favorable, making it a well-structured trade.
Gold Outlook After FOMC NewsGold Outlook After FOMC News
The recent FOMC meeting did not bring any new policy measures to support the economy. Chair Powell stated that conditions remain stable, and interest rates were kept unchanged. As a result, markets stayed quiet, with expectations now shifting towards September for potential updates.
On the charts, gold completed wave A after reacting strongly to the trendline on the daily timeframe. I expect the market to now form an ABC corrective structure, which would complete a medium-term Elliott cycle. The recent rally also broke above the descending trendline on H4, confirming that the bullish momentum could be more sustainable.
Currently, price is showing a mild pullback since the Asian session. A retracement of around 40–50% on the recent H4 candle would be a healthy move, and it could retest the broken descending trendline. If confirmed, this would establish a stronger bullish Dow structure, opening room for a longer cycle, at least until wave C completes.
The H4 chart also supports this view, with MACD averages pointing upward and trading volume showing steady growth.
Buy Zone: Around 3334 on the H4 candle, in line with the trend for holding medium- to long-term positions.
Sell Zone: Around 3365, once wave C completes and a new cycle begins.
Gold is now showing clearer technical direction. I hope this scenario helps traders align with the market trend. Wishing you all successful trades.
#XAUUSD #Gold #TechnicalAnalysis #PriceAction #ElliottWave #Fibonacci #MACD #CommodityTrading #FOMC

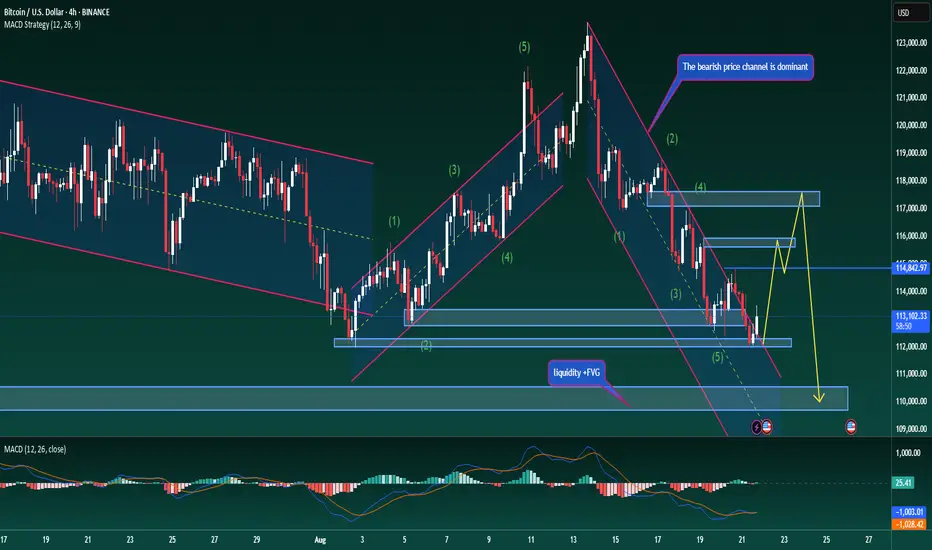
Bitcoin – Continuing to Follow the Bearish StructureBitcoin – Continuing to Follow the Bearish Structure
BTC has continued to follow the earlier analysis, with price moving back towards the 115,000 zone and resuming its downward waves. The descending channel remains intact and is guiding price action, with the next target area expected near 110,000.
To reach this level, BTC may form another Dow-style downward leg, closely tracking the trendline within the channel. That said, traders should be cautious — MACD is showing rising volume and the moving average is beginning to turn upward, which could be an early warning sign against aggressive short positions.
In trading, following the main trend is always the priority. Going against the market should only be considered when there is clear evidence of large liquidity zones or strong trader sentiment at key levels. Otherwise, trading in line with the prevailing trend remains the safer approach.
For BTC, the strategy is to keep following the descending channel and look for entries at trendline touches. Short-term scalping opportunities may arise around 112,600 and 111,800. The medium-term short entered near 115,000 remains active, with targets set towards 110,000. This zone will also be watched closely as a potential buying area, and decisions can then be made on whether to hold positions for the longer term.
This is my trading outlook for BTC. I hope the scenarios are useful, and I’d love to hear your views in the comments.
#BTCUSD #Bitcoin #CryptoAnalysis #TechnicalAnalysis #PriceAction #Trendline #DowTheory #MACD #CryptoTrading #SwingTrading
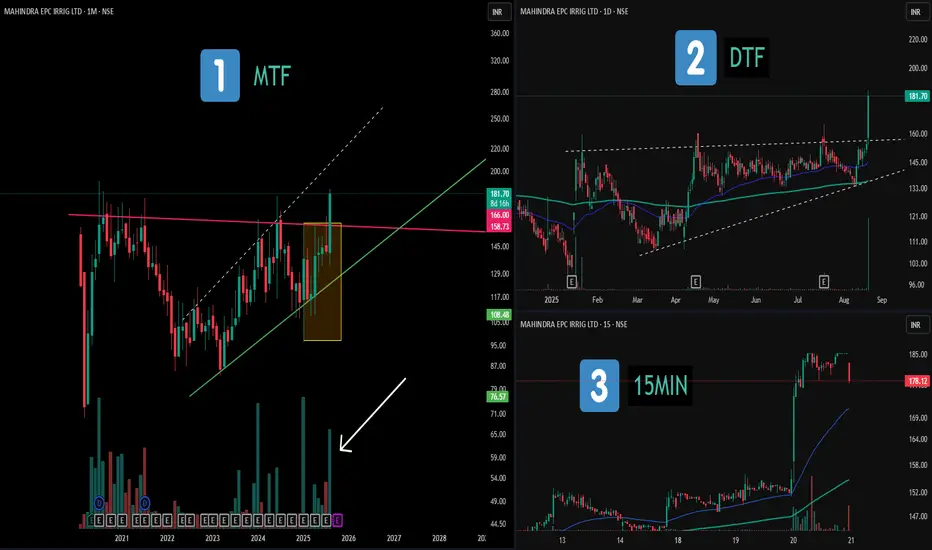
Multi-Timeframe Study: Consolidations and Patterns📝 Description:
1️⃣ MTF (Monthly) – Displays a broad consolidation structure with a hidden broadening formation and notable volume clusters marked in recent candles.
2️⃣ DTF (Daily) – Highlights an ascending triangle structure, with clear range boundaries and price compression before expansion.
3️⃣ 15MIN (Intraday) – Shows that the maximum price movement and volume activity occurred on a single candle, illustrating how momentum often concentrates in short bursts.
This chart setup serves as an educational view across multiple timeframes, showing how higher- and lower-TF structures can align.
⚠️ Disclaimer:
This post is purely for educational and structural analysis purposes. Not financial advice.
Bitcoin Update – Price Action Still on TrackBitcoin Update – Price Action Still on Track
Yesterday’s scenario has played out accurately, with BTC continuing to respect the descending channel. Each time price touched the upper trendline, it quickly turned lower, and now it is reacting around the midline of the channel, near the 113,000 zone — exactly the level highlighted earlier as an area to watch.
With this corrective move, I expect BTC could retest the 115,000 area before resuming its broader downtrend. The next downside target remains around 110,000, as larger timeframe structures usually require a corrective pullback before continuing the main trend — something Dow Theory traders will clearly recognise.
Today also coincides with discussions on interest rate policy, which could bring higher volatility as investors take a more cautious stance across global financial markets. However, FOMC outcomes often have limited impact on Bitcoin, given its relative independence from traditional macroeconomic drivers compared to gold or forex markets.
In the short term, traders may consider long opportunities near the 113,000 area with a tight stop just below the recent support, aiming for a corrective move towards 115,000 before the main downtrend resumes.
Strong trading comes from patience and discipline. Stick with the defined scenario rather than reacting emotionally to intraday swings.
Wishing you successful trades. What’s your view on Bitcoin’s price action here? Share your thoughts below.
#BTCUSD #Bitcoin #CryptoAnalysis #TechnicalAnalysis #PriceAction #Trendline #CryptoTrading #SwingTrading

Gold Update – Asian Session Ahead of FOMCGold Update – Asian Session Ahead of FOMC
After yesterday’s sharp decline below 3312, gold found strong support and is now consolidating sideways, building liquidity for the next move. From the current outlook, a short-term rebound is likely before the broader downtrend continues.
Looking at structure, the descending channel remains intact with price respecting the trendline, and yesterday’s break out of the triangle formation reinforced the bearish bias.
From an Elliott Wave perspective, the market may now be forming wave 4. If this rebound carries price back towards the 3325–3330 zone, it will retest a strong resistance area that has repeatedly capped price before. Should that happen, wave 5 could begin — and by theory, it is often the strongest leg.
Fibonacci projections highlight the next support near 3295. If tonight’s FOMC meeting delivers a hawkish outcome in favour of the US dollar, gold could even extend lower towards 3280.
For short-term trading, buyers may consider positions near 3316 with a tight stop just below the recent low, aiming to capture the corrective move of wave 4. On the flip side, if price reacts around 3325–3330, this may provide an opportunity to sell into the expected wave 5, with potential targets extending 40–50 dollars lower if momentum strengthens.
A sustainable trend always alternates between retracements and impulses. Patience in waiting for the right wave often leads to more effective trades than rushing to pick tops or bottoms.
Do you think the FOMC this month will announce a positive interest rate outlook? Share your thoughts in the comments.
#XAUUSD #Gold #TechnicalAnalysis #PriceAction #Fibonacci #ElliottWave #MACD #ForexIndia #CommodityTrading #FOMC

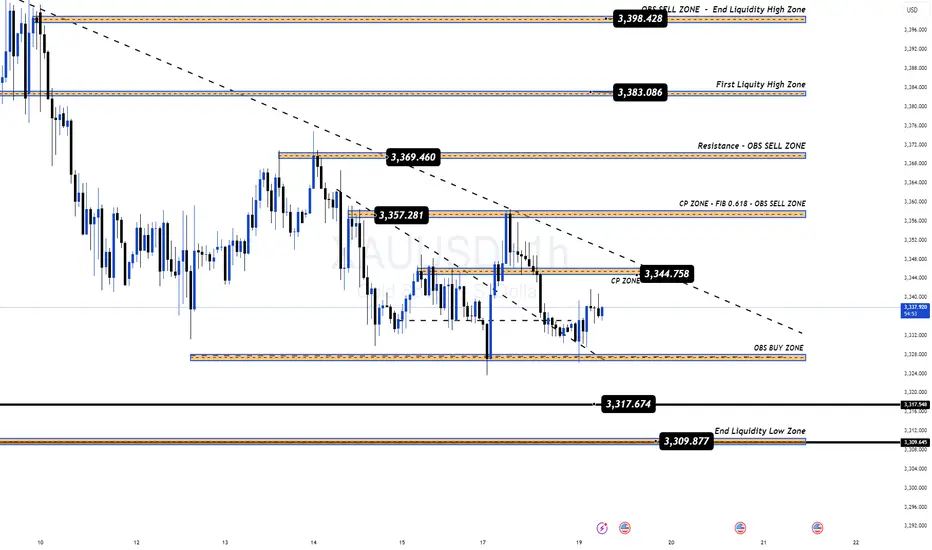
🇮🇳 Gold Under Pressure | Key Levels to Watch TodayGold continues to move in line with our weekly outlook. Despite strong rebounds from liquidity zones, the market still faces heavy selling pressure, unable to break out of the 335x – 336x resistance area.
With no major news events scheduled today, price action is expected to remain within range, making KeyLevels the most important zones to trade from.
📌 Trading Bias Today
Priority remains on SELL setups at upper resistance zones. Adjust entries slightly for better risk–reward.
For BUY positions, wait for deeper entries to avoid liquidity sweeps around 333x – 332x, which have been tested multiple times recently.
🔑 Key Market Levels
Resistance: 3346 – 3357 – 3370 – 3383
Support: 3324 – 3316 – 3309
📌 Trading Plan for India Traders
✅ BUY Zone: 3316 – 3314
SL: 3310
TP: 3320 – 3324 – 3328 – 3332 – 3336 – 3340 – 3350 – 3360+
✅ SELL Zone: 3356 – 3358
SL: 3362
TP: 3352 – 3348 – 3344 – 3340 – 3330 – 3320
⚠️ Summary
Gold remains inside a bearish channel, waiting for a clear breakout. Until major news like the FOMC hits, expect sideways price action within today’s KeyLevels.
👉 Watch reactions closely around 333x – 336x for the next potential move.
Stay disciplined, trade the levels, and let the market show its hand.
ELGIEQUIP (ELGI EQUIPMENTS)ELGIEUIP has re-tested the breakout and looking good, moving above 20-50ema.
Keep an eye on it.
✅ If you like my analysis, please follow me as a token of appreciation :)
in.tradingview.com/u/SatpalS/
📌 For learning and educational purposes only, not a recommendation. Please consult your financial advisor before investing.
