TECH MAHINDRA (1W) – Approaching Major Resistance Zone 🟢 Simple Chart Explanation:
• TECHM is moving in a clear long-term uptrend
• Price is consistently respecting the rising trendline (green line)
• Higher highs & higher lows show buyers are in control
• Currently, price is near a strong weekly resistance zone
📌 Important Levels to Watch:
• Major Resistance: ₹1,800–₹1,840
• Immediate Support: ₹1,650–₹1,680
• Trend Support: Rising trendline
• Invalidation: Weekly close below ₹1,600
💡 Price Action Insight:
• Strong recovery from trendline support
• Momentum is positive but price is at supply zone
• Break & hold above resistance = fresh upside potential
• Rejection from resistance = possible consolidation or pullback
📈 Bias:
• Bullish as long as trendline holds
• Watch for weekly close behavior near resistance
⸻
⚠️ Disclaimer
This analysis is only for educational purposes.
I am not a SEBI-registered investment advisor.
This is not a buy or sell recommendation.
Stock market trading & investing involve risk.
Please do your own research or consult a SEBI-registered advisor before making any decision.
⸻
❤️ If this helped, LIKE & SAVE the chart for future reference
(Weekly levels are powerful when saved 📌)
TECHM

Tech Mahindra - Weekly Long On the weekly chart of Tech Mahindra, the recent candles show strong bullish behavior. After spending many months in a wide range, price has formed a rounded base and is now printing higher highs with solid green candles near the earlier resistance zone around 1,750. The latest candle closes near the high, showing that buyers are in control and sellers are not able to push price down. This kind of structure often appears at the start of a new medium-term uptrend.
The trend is clearly shifting upward. From the April 2025 low, the stock has made a series of higher lows and is now moving in a smooth rising arc. The previous supply zone from December 2024 has been tested again and price is holding above it. This change from resistance to support is a classic sign of trend reversal. As long as price stays above the rising trend path, the bias remains positive.
RSI is above 70 and has crossed and sustained above 60, which signals strong momentum. This shows that the stock has moved from a neutral phase into a bullish phase. In trending markets, RSI can stay in the upper zone for a long time, so this strength supports continuation rather than immediate weakness.
Volumes are rising during the recent upward move. The breakout candles are accompanied by higher volume compared to the previous weeks, which confirms genuine participation. When price rises with expanding volume, it reflects accumulation by stronger hands and improves the reliability of the move.
A safer entry can be on a weekly close above 1,770–1,780, or on a pullback towards 1,680–1,700 if price respects this zone as support. This allows better risk control. The stop loss can be placed below 1,600 on a closing basis, which lies below the recent swing low and trend support. The first target comes near 1,950, which is the next major supply area. If the trend remains strong, a higher target in the 2,200–2,280 zone is possible over the medium term.
This analysis is for educational purposes only. It is not a buy or sell recommendation. Stock market investments involve risk, and prices can move unpredictably. Always do your own research and consult a qualified financial advisor before making any trading or investment decision.

TECHM - STWP Equity Snapshot________________________________________
📊 STWP Equity Snapshot – Tech Mahindra
(Educational | Chart-Based Interpretation)
________________________________________
📌 Market Structure (Simple View)
Price has moved up strongly from a well-defined support area
Recent candles show active buying
Price is now near an earlier resistance zone
👉 Strength is visible, but price is at an important decision area
________________________________________
📌 Intraday Reference Levels (Structure-based)
Reference Price Zone: 1681
Risk Reference (If price weakens): 1548
Observed Upside Zones: 1840 → 1945
These are reaction zones, not predictions.
________________________________________
📌 Swing Reference Levels
(Hybrid Model | Observational)
Reference Price Zone: 1681
Risk Reference (If support breaks): 1482
Higher Range Zones (If strength sustains): 2078 → 2375
These levels reflect the bigger structure, not short-term noise.
________________________________________
🔑 Key Levels – Daily Timeframe
Support Areas: 1620 | 1570 | 1539
Resistance Areas: 1701 | 1731 | 1782
These are zones where price has paused or reacted earlier.
________________________________________
📊 What the Chart is Saying (Very Simple)
Trend is recovering, not fully trending yet
Momentum is strong recently, but near resistance
Volume supports the recent up move
Price may pause or consolidate before the next move
________________________________________
📈 Final Outlook (Condition-Based)
Momentum: Moderate
Trend: Range to Recovery
Risk: High (near resistance)
Volume: High
________________________________________
💡 STWP Learning Note
Strong candles look exciting, but discipline matters more.
Let price accept above resistance before assuming continuation.
________________________________________
⚠️ Disclaimer
This post is shared only for educational and informational purposes.
It is not investment advice or a recommendation.
Please consult a SEBI-registered financial advisor before making any financial decision.
________________________________________
📘 STWP Approach
Observe price. Respect risk.
Let structure guide decisions — not emotions.
🚀 Stay Calm. Stay Clean. Trade With Patience.
________________________________________

Tech Mahindra Ltd – Breakout Trade IdeaTech Mahindra has very closed to broken out of a downward sloping trendline, signaling a potential trend reversal. The breakout is supported by increasing Put writing and Call unwinding at the 1600 strike, indicating strong support and bullish positioning in the derivatives segment.
Additionally, positive last quarter results strengthen the overall bullish outlook.
Trade Setup
Buy: ₹1605 (Current Market Price)
Targets: ₹1700 – ₹1750
Stop Loss: ₹1560 (Closing basis)
View: Bullish above ₹1600
Risk–Reward: Favorable


At Support - Weekly Chart - TECHM📊 Script: TECHM
📊 Industry: IT - Software (Computers - Software & Consulting)
Key highlights: 💡⚡
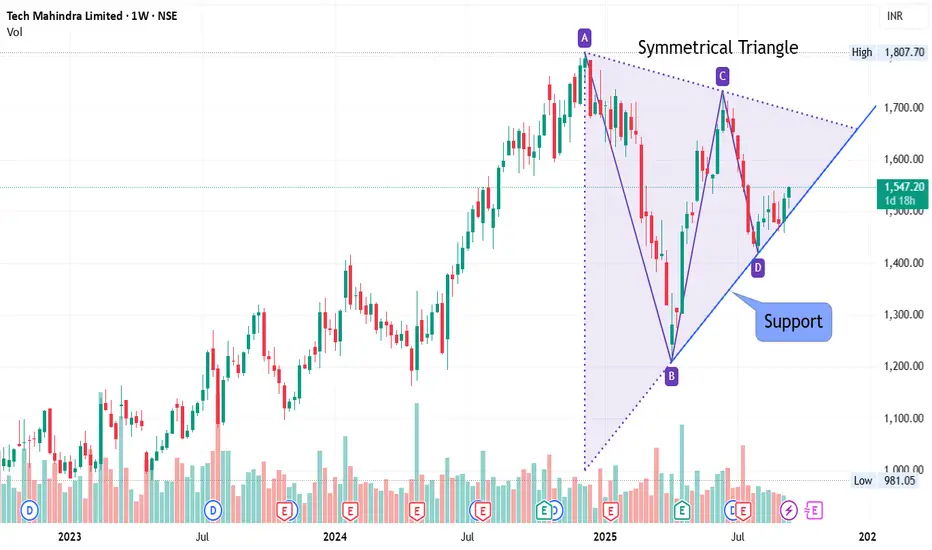
📈On Weekly Chart Script is forming symmetrical triangle and trading near support line.
📈 Script is trading at upper band of BB.
📈 MACD and Double Moving Averages are giving Crossover
📈 Right now RSI is around 58.
📈 One can go for Swing Trade.
⏱️ C.M.P 📑💰- 1547
🟢 Target 🎯🏆 - 1612 / 1655
⚠️ Stoploss ☠️🚫 - 1499
⚠️ Important: Always maintain your Risk & Reward Ratio.
✅Like and follow to never miss a new idea!✅
Disclaimer: I am not SEBI Registered Advisor. My posts are purely for training and educational purposes.
Eat🍜 Sleep😴 TradingView📈 Repeat 🔁
Happy learning with trading. Cheers!🥂
TechM Trade AlertTechnical Analysis:
Trading Above 20 EMA : good for short term
Trading Above 200 EMA : goof for Positional as well
Take reversal from support few days back with good volume
After Breakout from channel take support of channel as well
Good Volume
Trading Setup
Buy if dont go negative on open at cmp
Target would be :1750-1800-1850
short Term SL would be : 1675
For Positional trade SL would be : 1630

Techm #intraday ideas Techm huge sell off activates below 1760
if opens gapdown then will reverse first and again will get sold.
Breakout is one closing above1790 in hourly tf and break of high of candle close.
consult your advisor before trading.

Tech M - Bearish1650 - 1670 strong resistance area
Stock getting pushed once again from same levels
Can fall on every rise
Expecting 1610-1600 levels to be touched again

TECHM - Ichimoku Breakout📈 Stock Name - Tech Mahindra Limited
🌐 Ichimoku Cloud Setup:
1️⃣ Today's close is above the Conversion Line.
2️⃣ Future Kumo is Turning Bullish.
3️⃣ Chikou span is slanting upwards.
All these parameters are shouting BULLISH at the Current Market Price and even more bullishness anticipated AFTER crossing 1643.
🚨Disclaimer: This is not a Buy or Sell recommendation. It's for educational purposes and a guiding light to learn trading in the market.
#CloudTrading
#IchimokuCloud
#IchimokuFollowers
#Ichimokuexpert
Excited about this analysis? Share your thoughts in the comments below!
👍 Like, Share, and Subscribe for daily market insights! 🚀
#StockAnalysis #MarketWatch #TradingEducation #ichimoku #midcap #smallcap #TECHM

TECHM - CUP AND HANDLE PATTERN DAILY CHART The stock has formed CUP & HANDLE pattern
on the DAILY chart.
One can enter above 1589 with a strict
Stoploss of 1531
Target 1 - 1629
Target 2 - 1670
Target 3 - 1700
Target 4 - 2150
#SWINGTRADE
#FUNDAMENTALLY STRONG STOCK
What is your view please comment it down and also boost the idea this help to motivate us. All views shared on this channel are my personal opinion and is shared for educational purpose and should not be considered advise of any nature.

A Clear DownsideA Clear downside it doesn't have potential of upside so it show in the downside due to very high PE and mutual funds slow dump the stock to individual to make a profit. there is recession going on UK so this stock kind of week and it will touch 1100 to 1000 will be on mid-april or may month possibility to touch.

TECHM | Swing Trade📊 DETAILS
Sector: IT Services & Consulting
Mkt Cap: 129,441 cr
Tech Mahindra Ltd provides comprehensive range of IT services, including IT enabled service, application development and maintenance, consulting and enterprise business solutions, etc. to a diversified base of corporate customers in a wide range of industries.
TTM PE : 35.97 (High PE)
Sector PE : 36.64
Beta : 1.08
📚 INSIGHTS
Mid-range performer
Stock with medium financial performance with average price momentum and valuation. These stocks may be affordable and are showing some investors interest.
5.33% away from 52 week high
Outperformer - Tech Mahindra up by 1.58% v/s NIFTY 50 up by 0.77% in last 1 month
📈 FINANCIALS
Piotroski Score of 5/9 indicates Average Financials
Disclaimer: This analysis is for educational purposes only, and I'm not a SEBI registered analyst.
If you found this analysis helpful, I encourage you to like and share it. Your observations and comments are also welcomed below. Your support, likes, follows, and comments motivate me to consistently share valuable insights with you.
🔍 More Analysis & Trade Setups 🔍
For more technical analysis and trade setups, make sure to follow me on TradingView: www.tradingview.com

Short Term Buy TECHMStock was under long term Consolidation at low levels which means under Accumulation,
#TechM #Brokeout the range, retest done and now it will resume its trend.
Pure #TechnicalAnalysis #DowTheory #WyckoffTheory

TECH MAHINDRA - WAIT FOR THE BEST BUY#TECHM #Trending #Stocks #trading
Tech Mahindra - Weekly uptrend line got broken out - Expect stock will reach 1062 levels and if that also will break it will go to its yearly support below 1000. Wait for the good price action for Long Investment.

NIFTY IT Retesting its 50 EMA levels IT is retesting its 50 EMA area
wil it sustain is the question
Majority of counters like TECHM, PERSISTENT, HCLTECH, NAUKRI etc witnessed a downmove in the week gine by
with result on the way, woul be fun to watch what IT has in store

TechM BreakoutThe area around 1155 (yellow horizontal line) is an important resistance on daily timeframe
It was broken on 5 july with higher than average volume
The next immediate resistance was 1199 (pink horizontal line) , which is now broken again with a good higher than average volume
On a 2 hrly time frame , inverted H&S pattern has also been formed (neckline is blue line on the chart)
The next immediate resistance are marked as white horizontal lines
SL keep below shoulder 1160
Conservative Tgt around 1266
can increase trgt towards next resistance of 1284 and further based on candle and momentum
The rise in ATR on breakout also provides confirmation

Breakout In TECHMBreakout In TECHM. Target Open till 1260. After consolidating from last around 10 month, now TECHM is expecting to go up.
CMP = 1178-1180
SL = 1162
Target 1220 , 1260.
Holding time 2-4 Weeks.
DISCLAIMER: WE ARE NOT ADVISORS. WE ARE NOT REGISTERED. THE IDEAS ARE MERELY PERSONAL OPINIONS. PLEASE CONSULT YOUR FINANCIAL ADVISORS BEFORE INVESTING.

TECHM Swing Buy TradeBreakout on daily timeframe via trend line.
TECHM ready for a mid term swing buy trade.
Please refer the chart for the respective SL and Targets.
Plan trade as per proper Risk Reward ratio.
Note: This information is for entertainment purpose only and please do your own research and consult your financial advisor prior to taking any action.
If you like this Idea, Please do like my ideas and share it with your friends. To further connect check my bio.
Please boost my ideas and send cheers as it acts as a motivation to keep posting my analysis.
Thank you

TechM - CashExpecting TechM will break the resistance and will make new High.
I am buying TechM at current level and hoping a target of 1270-1280 with a small stoploss at 1088.

TECHM 2200 ?we can see a wave 1 - 500 to 1800 , in this wave we can see a good retracement of .618 and price is also taking support on a major trendline. AB=CD can be form
a good consolidation or a pennant pattern also can be seen .
if we sit in this trade on the sl of 900 we can definately seen a return of 100% in this script

TECHM - CASHWe will trade the range of Tech Mahindra.
Expecting a target of 1150-1160 with a stop loss of 1040-1030.

TECHM long indication on chartsTECHM long indication on charts
Gave a good support and currently near the support levels. If gives good upmove with volume then we can see 1220 + levels in near term.
No recommendations, just my view based on charts.
