TECH MAHINDRA (1W) – Approaching Major Resistance Zone 🟢 Simple Chart Explanation:
• TECHM is moving in a clear long-term uptrend
• Price is consistently respecting the rising trendline (green line)
• Higher highs & higher lows show buyers are in control
• Currently, price is near a strong weekly resistance zone
📌 Important Levels to Watch:
• Major Resistance: ₹1,800–₹1,840
• Immediate Support: ₹1,650–₹1,680
• Trend Support: Rising trendline
• Invalidation: Weekly close below ₹1,600
💡 Price Action Insight:
• Strong recovery from trendline support
• Momentum is positive but price is at supply zone
• Break & hold above resistance = fresh upside potential
• Rejection from resistance = possible consolidation or pullback
📈 Bias:
• Bullish as long as trendline holds
• Watch for weekly close behavior near resistance
⸻
⚠️ Disclaimer
This analysis is only for educational purposes.
I am not a SEBI-registered investment advisor.
This is not a buy or sell recommendation.
Stock market trading & investing involve risk.
Please do your own research or consult a SEBI-registered advisor before making any decision.
⸻
❤️ If this helped, LIKE & SAVE the chart for future reference
(Weekly levels are powerful when saved 📌)
Techmahindra

Tech Mahindra - Weekly Long On the weekly chart of Tech Mahindra, the recent candles show strong bullish behavior. After spending many months in a wide range, price has formed a rounded base and is now printing higher highs with solid green candles near the earlier resistance zone around 1,750. The latest candle closes near the high, showing that buyers are in control and sellers are not able to push price down. This kind of structure often appears at the start of a new medium-term uptrend.
The trend is clearly shifting upward. From the April 2025 low, the stock has made a series of higher lows and is now moving in a smooth rising arc. The previous supply zone from December 2024 has been tested again and price is holding above it. This change from resistance to support is a classic sign of trend reversal. As long as price stays above the rising trend path, the bias remains positive.
RSI is above 70 and has crossed and sustained above 60, which signals strong momentum. This shows that the stock has moved from a neutral phase into a bullish phase. In trending markets, RSI can stay in the upper zone for a long time, so this strength supports continuation rather than immediate weakness.
Volumes are rising during the recent upward move. The breakout candles are accompanied by higher volume compared to the previous weeks, which confirms genuine participation. When price rises with expanding volume, it reflects accumulation by stronger hands and improves the reliability of the move.
A safer entry can be on a weekly close above 1,770–1,780, or on a pullback towards 1,680–1,700 if price respects this zone as support. This allows better risk control. The stop loss can be placed below 1,600 on a closing basis, which lies below the recent swing low and trend support. The first target comes near 1,950, which is the next major supply area. If the trend remains strong, a higher target in the 2,200–2,280 zone is possible over the medium term.
This analysis is for educational purposes only. It is not a buy or sell recommendation. Stock market investments involve risk, and prices can move unpredictably. Always do your own research and consult a qualified financial advisor before making any trading or investment decision.

TechMahindra BreakoutHi All…
Greetings!
Today I’m sharing with you Tech Mahindra Daily Chart. There has been a good break out in the stock. The stock has made a Double Bottom Pattern and has crossed its Down Trend Line. I think it would a good time to invest in the stock. Hoping for the stock to reach the TGT of 1680.
In the coming time I think it should give good returns.
Thanking You
Important Things
1. This is only for educational purposes only.
2. Never over trade.
3. Always keep Stop Loss.
4. Trade in limited quantity.
5. Taking a small loss is better than wiping up your whole capital.
I hope you found this idea helpful.
Please like and comment.
Share with Your Friends.
Keep Learning,
Happy & Safe Trading
Disclaimer – These ideas shared by me to all are my personal analysis / views. I'm not a SEBI registered technical analyst.

Tech Mahindra Ltd – Breakout Trade IdeaTech Mahindra has very closed to broken out of a downward sloping trendline, signaling a potential trend reversal. The breakout is supported by increasing Put writing and Call unwinding at the 1600 strike, indicating strong support and bullish positioning in the derivatives segment.
Additionally, positive last quarter results strengthen the overall bullish outlook.
Trade Setup
Buy: ₹1605 (Current Market Price)
Targets: ₹1700 – ₹1750
Stop Loss: ₹1560 (Closing basis)
View: Bullish above ₹1600
Risk–Reward: Favorable

KOTAKBANK 1D Time frame📊 Price Action
Previous Close: ₹1,973.30
Day’s Range: ₹1,963.30 – ₹1,985.00
Volume: 1,694,935 shares
VWAP: ₹1,975.06
52-Week Range: ₹1,679.05 – ₹2,301.90
🔧 Technical Indicators
RSI (14): 55.59 — Indicates neutral to bullish momentum.
MACD: 5.67 — Suggests a positive trend.
ADX (14): 37.42 — Confirms a strong trend.
Stochastic RSI: 18.53 — Indicates oversold conditions.
CCI (14): 50.23 — Neutral, with potential for upward movement.
Ultimate Oscillator: 58.25 — Signals bullish momentum.
Rate of Change (ROC): 0.72 — Positive, indicating upward price movement.
Williams %R: -54.58 — Neutral, neither overbought nor oversold.
Bull/Bear Power (13): 13.35 — Indicates buying pressure.
📈 Moving Averages
MA5: ₹1,976.44 — Sell signal.
MA10: ₹1,973.57 — Buy signal.
MA20: ₹1,968.21 — Buy signal.
MA50: ₹1,956.95 — Buy signal.
MA100: ₹1,964.72 — Buy signal.
MA200: ₹1,979.20 — Sell signal.
Summary: Out of 12 moving averages, 8 indicate a buy signal, and 4 indicate a sell signal, suggesting a generally bullish trend.
📌 Support & Resistance Levels
Immediate Support: ₹1,963
Immediate Resistance: ₹1,985
🧠 Trend Analysis
Trend: Bullish
Momentum: Positive
Volatility: Moderate
Conclusion: Kotak Mahindra Bank's stock is exhibiting a bullish trend with positive momentum and moderate volatility. The technical indicators suggest potential for upward movement, with key support at ₹1,963 and resistance at ₹1,985. Traders may consider these levels for potential entry or exit points.

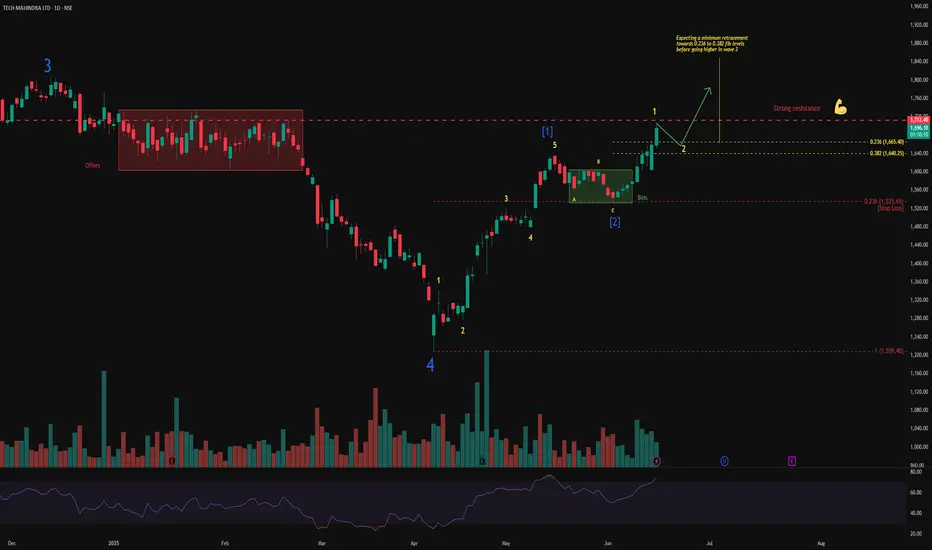
Wave 3 Setup Building in TECH MAHINDRA?After completing Wave 4, TECHM has started a new impulsive structure. Wave was followed by a clear A-B-C flat correction, forming Wave near the demand zone. The recent breakout indicates the beginning of Wave 1 of a larger Wave 3.
Supporting signals:
Strong volume during impulsive rallies.
RSI is rising but not yet in the overbought zone, indicating room for further upside.
Price is currently near the previous supply zone around ₹1712. A retracement toward the 0.382–0.236 Fibonacci levels (₹1640–₹1665) is expected before a further move higher in Wave 3.
Important levels:
Resistance: ₹1712
Retracement support zone: ₹1640–₹1665
Stop loss / invalidation: ₹1535
The current structure remains valid as long as price holds above ₹1535.
Chart will be updated as price action evolves.
Disclaimer: This analysis is for educational purposes only and does not constitute investment advice. Please do your own research (DYOR) before making any trading decisions.
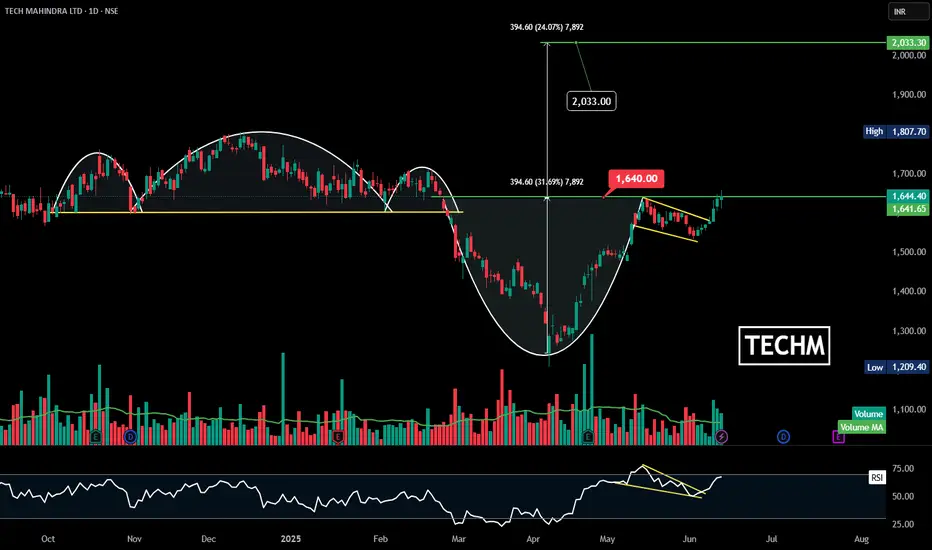
TECHM | Cup and Handle | Breakout | Daily
### 🏆 Pattern: **Cup & Handle Breakout**
* **Cup Formation**: Rounded bottom from Jan to April 2025.
* **Handle**: A bullish flag/pennant formed after the initial breakout near ₹1640 zone.
* Breakout is now **confirmed** with price pushing past the handle resistance.
---
### 📈 Price Target:
* Cup depth = ₹394.60
* Breakout level = ₹1640
* **Projected Target** = ₹2033
→ **24% upside** from breakout zone
---
### 📊 Volume & RSI Confirmation:
* **Volume** increased on breakout = Bullish conviction ✅
* **RSI** broke out of falling wedge and is rising again toward overbought = momentum strength ✅
---
### 🎯 Summary:
> TECHM is breaking out of a **classic bullish Cup and Handle** with strong volume and RSI confirmation. As long as price sustains above ₹1640, the next leg towards ₹2030 may be in play.
---
TechM - Flag Breakout A good Flag Breakout on Daily Chart.
Indicators is also showing strength.
Breakout above 1610
Flag height - 425 points
Target - 2000
#ShortTerm Trade.

TECH MAHINDRA - Good formations | Bullish OutlookPrice Analysis & Overview:
1. Prices are in uptrend. Forming HH-HL.
2. 1500 can be an immediate hurdle.
3. RRR is okay, but there might be chances for a better entry price than CMP on a pullback.
4. Good volume strength.
5. Expecting ATH breakout.
Trade Plan:
1. ENTRY = CMP (1430)
2. SL = 10 % (1300)
3. TARGET = 1:2,1:3,1:4
- Stay tuned for further insights, updates and trade safely!
- These are my personal views.
- If you liked the analysis, don't forget to leave a comment and boost the post. Happy trading!
Disclaimer: This is NOT a buy/sell recommendation. This post is meant for learning purposes only. Please, do your due diligence before investing.
Thanks & Regards,
Anubrata Ray

TechM Trade AlertTechnical Analysis:
Trading Above 20 EMA : good for short term
Trading Above 200 EMA : goof for Positional as well
Take reversal from support few days back with good volume
After Breakout from channel take support of channel as well
Good Volume
Trading Setup
Buy if dont go negative on open at cmp
Target would be :1750-1800-1850
short Term SL would be : 1675
For Positional trade SL would be : 1630

Techm #intraday ideas Techm huge sell off activates below 1760
if opens gapdown then will reverse first and again will get sold.
Breakout is one closing above1790 in hourly tf and break of high of candle close.
consult your advisor before trading.

Conformation on Daily Charts.NSE:TECHM Conformation of Daily Charts of the Below Analysis.
Check out my other stock ideas below until this trade gets activated, I would love your feedback.
Disclaimer: This analysis is intended solely for informational and educational purposes and should not be interpreted as financial advice. It is advisable to consult a qualified financial advisor or conduct thorough research before making investment decisions.

Retesting it's Breakout and About to Break Major Levels NSE:TECHM is retesting its resistance on a weekly timeframe, if 1530-1574 is sustained it can easily go to ATH Levels of 1838. Keep in Radar
Check out my other stock ideas below until this trade gets activated, I would love your feedback.
Disclaimer: This analysis is intended solely for informational and educational purposes and should not be interpreted as financial advice. It is advisable to consult a qualified financial advisor or conduct thorough research before making investment decisions.

Tech M - Bearish1650 - 1670 strong resistance area
Stock getting pushed once again from same levels
Can fall on every rise
Expecting 1610-1600 levels to be touched again

TECHM - Ichimoku Breakout📈 Stock Name - Tech Mahindra Limited
🌐 Ichimoku Cloud Setup:
1️⃣ Today's close is above the Conversion Line.
2️⃣ Future Kumo is Turning Bullish.
3️⃣ Chikou span is slanting upwards.
All these parameters are shouting BULLISH at the Current Market Price and even more bullishness anticipated AFTER crossing 1643.
🚨Disclaimer: This is not a Buy or Sell recommendation. It's for educational purposes and a guiding light to learn trading in the market.
#CloudTrading
#IchimokuCloud
#IchimokuFollowers
#Ichimokuexpert
Excited about this analysis? Share your thoughts in the comments below!
👍 Like, Share, and Subscribe for daily market insights! 🚀
#StockAnalysis #MarketWatch #TradingEducation #ichimoku #midcap #smallcap #TECHM

TECHM - CUP AND HANDLE PATTERN DAILY CHART The stock has formed CUP & HANDLE pattern
on the DAILY chart.
One can enter above 1589 with a strict
Stoploss of 1531
Target 1 - 1629
Target 2 - 1670
Target 3 - 1700
Target 4 - 2150
#SWINGTRADE
#FUNDAMENTALLY STRONG STOCK
What is your view please comment it down and also boost the idea this help to motivate us. All views shared on this channel are my personal opinion and is shared for educational purpose and should not be considered advise of any nature.

TECHMAHINDRA BREAKOUT WCBTechmahindra resistance breakout
weekly basis with good volume
rsi strong trading above 20ema
#target 1800 soon
EDUCATIONAL IDEA

Tech Mahindra bouncing from support
*SWING TRADE*
Buy Tech M above 1300
SL 1247
Target 1: 1364
Target 2: 1388
Target 3: 1435
Duration 1-2 months
Trade as per your risk rewards


TechMahindra - breakout on upsideLike TCS, we can see breakout on upside in Tech Mahindra chart now. so looking Bullish now

26 Apr 2024– Nifty50 throws up the extra it consumed yesterdayNifty Analysis - Stance Neutral ️➡️
Recap from yesterday: "The 321pts intraday rally has ensured N50 gets a stance upgrade to Bullish with the next target being the ATH. If it takes out the ATH, then we can safely remove the double top pattern."
Nifty had a great feast on Thursday that it had to throw up a bit today fearing indigestion, there is no other way to explain how we lost 230pts intraday today. Not just that, we fell below 22519 which prompted me to reverse the bullish stance back to neutral.
Sometimes the fundamentals makes no sense at all, how could you explain the move on Tech Mahindra & Bajaj Finance after their quarterly results? It really has a bearing on the Nifty index, just check how NiftyIT moved today.
On the higher time frame, Nifty looks strong above 22295 - but we need reinforcements coming to protect that support. Getting 4 red candles out of 6 is not going to help. For Monday, we will go short if 22295 is taken out and will go long if 22519 is taken out. Algo trades ended with a loss of Rs570, it turned out to be a blessing as the MTM swing low was minus Rs22500.

A Clear DownsideA Clear downside it doesn't have potential of upside so it show in the downside due to very high PE and mutual funds slow dump the stock to individual to make a profit. there is recession going on UK so this stock kind of week and it will touch 1100 to 1000 will be on mid-april or may month possibility to touch.

TECH MAHINDRATrend Analysis for Tech Mahindra : Will it cut the support or bounce back and go bullish ?
