GOLD BULLISH TRIANGLE PATTERN | BULLISH BREAKOUT Gold is currently consolidating within a tight symmetrical triangle following a corrective pullback, indicating a period of compression ahead of a potential expansion move. Price action continues to hold above the key demand zone around 5030, which remains a critical structural support.
Multiple rejections from the upper boundary of the consolidation suggest building bullish pressure. A decisive breakout and sustained acceptance above the 5045–5048 resistance zone would confirm bullish continuation and signal the next leg higher.
On confirmation, upside momentum is expected to target 5055, followed by an extension toward 5065, aligning with projected measured-move objectives from the triangle breakout.
A failure to hold above 5030 would invalidate the bullish bias and expose price to deeper downside correction, negating the current setup.
Technical

#NIFTY Intraday Support and Resistance Levels - 22/01/2026A gap-up opening is expected in Nifty, indicating a short-term relief bounce after the recent sharp decline and high volatility seen over the last few sessions. This gap-up suggests that buying interest has emerged near the lower demand zones, but the broader trend still remains weak and corrective, so traders should stay cautious and avoid assuming a full trend reversal too early. The market structure clearly shows lower highs and lower lows on the higher timeframe, which means the current upside move should be treated as a pullback within a downtrend unless key resistance levels are reclaimed with strong follow-through.
From a price-action perspective, the 25250–25300 zone is acting as an important reversal and decision-making area. If Nifty manages to sustain above 25250, it may attract short-covering and fresh buying, leading to a gradual upside move towards 25350, followed by 25400 and 25450+. This move will largely depend on whether the gap-up is defended in the first 30–45 minutes of trade. A strong bullish candle with volume confirmation above this zone would support a reversal long setup, but traders should trail profits aggressively as overhead supply is still heavy.
On the downside, the 25200–25250 range remains a critical resistance-turned-supply zone. Any rejection from this area, especially if accompanied by weak candles or long upper wicks, can invite selling pressure. In such a scenario, short positions near 25250–25200 may push the index back towards 25100, then 25050, and potentially 25000. If selling intensifies and Nifty breaks decisively below 24950, the downside could extend further towards 24850, 24800, and even 24750, confirming bearish continuation.
Overall, while the gap-up opening brings short-term positivity, the broader bias remains cautious to bearish unless Nifty sustains above higher resistance levels. Traders should focus on level-based trading, avoid chasing the gap, and wait for confirmation near key zones before taking positions. Intraday volatility is expected to remain high, making risk management and disciplined execution far more important than aggressive directional bets.

#NIFTY Intraday Support and Resistance Levels - 19/01/2026Based on the current structure of the Nifty 50 chart, a gap-down opening is expected, which clearly reflects cautious sentiment at the start of the session. The index is opening below the recent consolidation zone, indicating that sellers are still active and buyers are not yet confident to push prices higher at the open. This kind of opening generally leads to a range-bound to volatile first half, where the market tests nearby support and resistance levels before showing any clear directional bias.
From a technical perspective, the 25,700–25,750 zone is acting as an important short-term decision area. This level has previously behaved as both support and resistance, making it a critical region to watch today. If Nifty manages to hold above 25,700 and shows strength, there is a possibility of a reversal long setup. Sustained price action above 25,750–25,800 can attract buying interest, and in that case, the upside targets remain 25,850, 25,900, and 25,950+. Such a move would indicate short covering and intraday recovery after the gap-down opening.
On the downside, if the index fails to sustain above 25,700 and breaks down decisively below this level, selling pressure is likely to increase. A clean breakdown below 25,700 can open the door for further downside towards 25,650, 25,550, and 25,500. This would confirm that the gap-down opening is being accepted by the market and that bears remain in control for the session. Any rejection from the 25,950–26,000 resistance zone would further strengthen the bearish intraday outlook.
Overall, the market structure suggests a sell-on-rise or level-based trading approach rather than aggressive directional trades at the open. Traders should avoid early impulsive entries and instead wait for confirmation near the marked levels. If price stabilizes and forms a base near support, a controlled reversal trade can be planned. Otherwise, continued weakness below support levels may offer short-selling opportunities with strict risk management. The session is likely to remain volatile and level-driven, making patience and discipline crucial for today’s trades.

RBL Bank Shows a Powerful Cup Pattern Breakout on Weekly ChartRBL Bank has completed a textbook Cup & Handle pattern on the weekly timeframe, signaling a meaningful shift from a long consolidation phase into a fresh bullish trend. The rounded base formation highlights a gradual transition from distribution to accumulation, indicating growing confidence among long-term market participants.
The most critical development is the decisive breakout above the handle resistance zone, which had previously acted as a strong supply area. This breakout is supported by strong price expansion and follow-through candles, confirming that buyers are in control. Such breakouts from multi-month bases often lead to sustained trending moves rather than short-lived rallies.
From a price projection standpoint, the measured move of the cup suggests an initial upside target around 380+, followed by an extended projected target near 440+ if momentum continues to build. The current structure also shows healthy consolidation above the breakout level, which is a positive sign and often acts as a base for the next leg higher.
Risk management remains clearly defined in this setup. As long as the price holds above the breakout support zone near 280–290, the bullish structure stays intact. Any sustained breakdown below this area would invalidate the pattern and shift the outlook back to neutral or corrective.
Overall, RBL Bank appears to be transitioning into a new medium-to-long-term uptrend, backed by a strong chart structure and favorable risk–reward dynamics. This makes it a compelling setup for positional traders and investors who prefer structurally confirmed breakouts with clear targets and controlled downside risk.

[INTRADAY] #BANKNIFTY PE & CE Levels(13/01/2026)A flat opening is expected in Bank Nifty, with the index trading near the 59,500–59,550 zone, which is acting as an important intraday pivot area. Price action suggests continued consolidation after the recent sharp recovery from lower levels, indicating balanced participation from both buyers and sellers. The overall structure remains range-bound, and a decisive move beyond key levels is required for clear direction.
On the upside, a sustained move above 59,550 will be the key trigger for bullish momentum. Holding above this level can open the door for long trades, with upside targets placed at 59,750, 59,850, and 59,950+. A strong breakout above the 59,950 resistance may further accelerate upside toward higher zones.
On the downside, if Bank Nifty fails to hold the 59,450–59,400 support, selling pressure may re-emerge. In such a scenario, short positions can be considered with downside targets at 59,250, 59,150, and 59,050-. Until a clear breakout occurs on either side, traders are advised to stick to range-based trading, maintain strict stop-loss discipline, and avoid aggressive directional positions.

Gold (XAUUSD) Shows Head & Shoulders BreakdownGold on the 1-hour timeframe has formed a clear Head and Shoulders reversal pattern, signaling a potential shift from bullish momentum to a corrective or bearish phase. The structure is well-defined, with a visible left shoulder, a higher head, and a lower right shoulder, indicating weakening buying strength after the recent rally.
The neckline zone, highlighted around the 4,440–4,445 area, acted as a crucial support and demand region earlier. Price has now broken below this neckline and is struggling to reclaim it, which confirms the breakdown of the pattern. This behavior suggests that sellers are gaining control, and any pullback toward the neckline is likely to face selling pressure rather than fresh buying.
As long as Gold remains below the neckline, the bias stays bearish. The projected move, based on the height of the head-to-neckline, points toward a downside target near the 4,380–4,385 zone. Minor pullbacks or consolidations may occur in between, but unless price reclaims and sustains above the neckline, the risk remains tilted toward further downside.
From a trading perspective, this is a classic example of trend exhaustion after a strong upside move. Bulls should be cautious at current levels, while bears can look for continuation setups on weak pullbacks, keeping risk tightly managed. The overall structure clearly indicates that Gold is no longer in a strong bullish phase on the intraday chart and is now transitioning into a corrective move.

[INTRADAY] #BANKNIFTY PE & CE Levels(23/12/2025)A gap-up opening is expected in Bank Nifty, with the index showing a positive bias at the start of the session while continuing to trade within the broader consolidation range formed over the last few days. Price is currently hovering around the 59,250–59,300 zone, which has been acting as a short-term balance area. This indicates that despite the expected gap-up, the market is still awaiting a strong breakout for clear directional strength.
On the upside, a sustained move above 59,050–59,100 will be the first sign of bullish continuation. Holding above this zone can open opportunities for buying, with upside targets placed at 59,250, 59,350, and 59,450+. If Bank Nifty manages to break and sustain above the 59,550 level, momentum can further accelerate toward 59,750, 59,850, and 59,950+, where strong resistance is placed.
On the downside, if the gap-up fails to hold and the index slips back below 59,050, selling pressure may emerge. In such a scenario, selling can be considered with downside targets at 58,950, 58,750, 58,650, and 58,550-. Until a decisive breakout above resistance or breakdown below support is confirmed, traders should focus on range-based trades, maintain tight stop losses, and avoid aggressive directional positions in this consolidation-driven environment.

[INTRADAY] #BANKNIFTY PE & CE Levels(19/12/2025)A flat opening is expected in Bank Nifty, with the index continuing to trade within a tight consolidation range formed over the last few sessions. Price is currently hovering around the 58,900–59,000 zone, which is acting as a short-term balance area. This indicates hesitation in the market, where buyers and sellers are evenly placed, and a clear directional move is still awaited for conviction.
On the upside, a sustained move above 59,050–59,100 will be the key trigger for bullish momentum. If Bank Nifty manages to hold above this resistance zone, buying can be considered, with upside targets placed at 59,250, 59,350, and 59,450+. A decisive breakout above this level may invite follow-through buying and push the index toward higher resistance levels.
On the downside, if the index fails to hold the 58,950–58,900 support zone, selling pressure may accelerate. In such a scenario, selling can be considered with downside targets at 58,750, 58,650, and 58,550-, where strong demand is expected. Until a clear breakout or breakdown occurs, traders should continue to focus on range-based trading setups, keep strict stop-loss discipline, and avoid aggressive positional trades.

BANKNIFTY at a Make-or-Break ZoneNIFTYBANK is currently trading at a critical confluence zone where a downward-sloping resistance trendline is meeting a well-defined rising support area on the 1-hour timeframe. This price compression indicates indecision and typically precedes a sharp directional move. The index has repeatedly respected both these levels, confirming their importance in the current structure.
On the upside, the falling resistance zone near 59,300–59,500 remains the key hurdle. A sustained breakout and close above this trendline would signal a shift in short-term momentum, opening the door for a recovery move toward 59,800 initially, followed by a potential extension toward the 60,400–60,600 zone. Such a breakout would also indicate that buyers are regaining control after the recent corrective phase.
On the downside, the green support zone around 58,700–58,850 is the immediate demand area to watch. This zone has acted as a base multiple times, and as long as Bank Nifty holds above it, pullbacks may continue to attract buyers. However, a decisive breakdown below this support would invalidate the bullish bounce scenario and could accelerate selling pressure toward 58,300 first, with a deeper downside extension possible toward the 57,200 region.
Overall, BANKNIFTY is trading inside a tightening range, signaling an imminent volatility expansion. Directional clarity will emerge only after a confirmed breakout or breakdown. Traders should remain cautious at current levels and wait for confirmation, as this is a classic decision zone where false moves are also common.

Nifty50 at a Crucial Inflection Zone:Break Will Decide DirectionNifty 50 is currently trading near a well-defined horizontal support zone around 25,750–25,800, which has acted as a demand area multiple times on the 2-hour timeframe. After facing repeated rejection from the falling trendline resistance, the index has moved back into this support cluster, making the current zone extremely important from a short-term perspective.
The broader structure shows a sequence of lower highs, with price respecting the descending trendline marked as resistance. Until this trendline is decisively broken, upside moves may face supply pressure near the 25,950–26,000 region. A clean breakout and sustained close above this resistance would signal a shift in momentum and can trigger a pullback-to-breakout move toward 26,200–26,300 in the next leg.
On the downside, the support zone remains the key line of defense for bulls. If Nifty fails to hold the 25,750 area and breaks below it with conviction, the structure opens up for a deeper retracement toward 25,500 initially, followed by the broader downside target near 25,300. This would confirm continuation of the short-term corrective phase.
Overall, Nifty is currently in a compression phase between falling resistance and horizontal support. A breakout on either side will define the next directional move. Traders should remain patient and let price confirm the bias, as this is a classic “decision zone” where volatility expansion is likely once the range resolves.

XAU/USD Quick Analysis (Gold) 16/12/2025Gold is trading near the 4280–4285 zone, which is the key decision level for today. On lower timeframes, price is weak and range-bound, while higher timeframes remain bullish, indicating a short-term pullback within a larger uptrend.
As long as gold stays below 4285, intraday bias remains bearish, with selling pressure likely near 4290–4310. Downside targets and buy-on-dip zones are 4275, 4260–4255, and 4245–4240. A strong hold above 4290 can flip intraday bias back to bullish, targeting 4305–4320.
For swing trades, the trend stays bullish above 4205–4210. Only a break below 4200 would weaken the bigger picture.
⚠️ Disclaimer: This is for educational purposes only, not financial advice. Trade with proper risk management.

Eternal Ltd at a Critical Make-or-Break Zone – Long OpportunityEternal Ltd is currently trading near a well-defined demand and trendline support zone after a sharp corrective phase from its recent highs. The price action suggests that selling pressure is gradually losing strength, and the stock is attempting to stabilize around the 285–290 range. This area is technically important, as it aligns with a rising long-term trendline and acts as a base where buyers have previously stepped in.
From a moving average perspective, price is still trading below the short-term EMA, indicating that the trend reversal is not yet fully confirmed. However, the stock is holding above the major support zone and showing signs of recovery from intraday lows. A sustained move above the near-term resistance around 300–305 would be the first indication of strength and could shift the short-term bias toward bullish.
The RSI structure adds an important clue to this setup. After remaining in the lower zone for some time, RSI is attempting a bullish reversal from oversold territory. This positive divergence-like behavior indicates improving momentum and increases the probability of a relief rally. If RSI continues to move upward and sustains above the 50 zone, it would further validate the bullish case.
In the bullish scenario, once price holds above 300 on a closing basis, the stock can gradually move toward the first upside objective near 313. A breakout and hold above this level could open the path toward the next resistance around 335, followed by the extended target zone near 360 in the medium term. These targets are expected to be achieved in phases, with intermittent consolidations.
On the downside, the risk remains clearly defined. A decisive breakdown below the 280 support zone would invalidate the bullish setup and may lead to further downside pressure. Hence, this is not a confirmed breakout trade yet, but rather an early-stage opportunity near strong support where risk-to-reward remains favorable if managed properly.
Overall, Eternal Ltd is presenting a potential long opportunity near its base, supported by structure and improving momentum. Traders should wait for confirmation above resistance levels for higher conviction, while positional participants may track this zone closely with strict risk management in place.

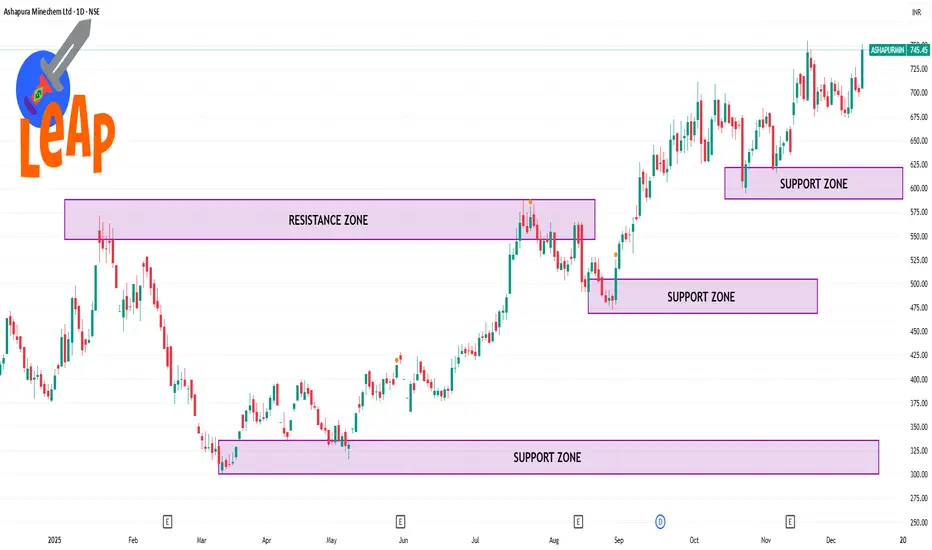
ASHAPURMIN 1 Day Time Frame 📌 Current Live Price (Daily)
Approx ₹745.4 on NSE at latest available update.
This reflects the recent trading session where the stock moved between ~₹705 (low) and ~₹751 (high) before settling near ₹745.45.
📊 Daily Technical Levels (Pivot / Support / Resistance)
🔹 Pivot Point Levels (based on yesterday’s range)
(These can be used for today’s intraday bias)
Daily Pivot: ~₹733.8
Support 1: ~ ₹716.6
Support 2: ~ ₹687.8
Support 3: ~ ₹670.6
Resistance 1: ~ ₹762.6
Resistance 2: ~ ₹779.8
Resistance 3: ~ ₹808.6
(Classic pivot method daily)
Angel One on the Edge: Long-Term Chart Points to 4800+The monthly chart of Angel One shows a well-defined broadening wedge pattern, where price has been repeatedly oscillating between a rising support line and a widening resistance zone. The structure has been forming for almost two years, indicating a long consolidation phase after a strong uptrend. Currently, the price is trading near the lower trendline support, which aligns with the long-term uptrend support. This zone is marked as the Buying Zone, suggesting that the risk-reward ratio is favourable for long-term buyers as long as the support remains intact.
A potential breakout above the upper wedge resistance may trigger a strong upside rally. The first major level on the upside is the Reversal Target around 3050, which is the initial confirmation level. If price sustains above this, the momentum may carry it towards the Breakout Target near 3500, which represents the first official breakout swing. Once this level is surpassed, the trend may accelerate towards Target 2 around 3900, indicating continuation of the long-term bullish structure. The complete projected move from the pattern height signals a Final Projected Target around 4840, which is the long-term positional upside expectation.
On the downside, the setup remains valid only while the price trades above the lower trendline region. A sustained close below the marked failure level would invalidate the pattern, signalling potential weakness and a breakdown of the long-term bullish structure. However, until that failure zone is breached, the pattern continues to favour a bullish breakout scenario with upward projections as highlighted.

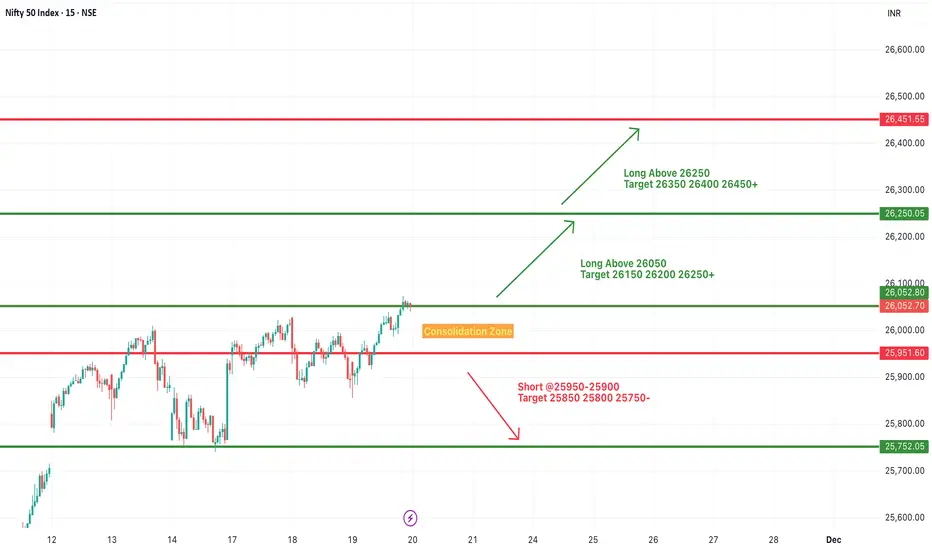
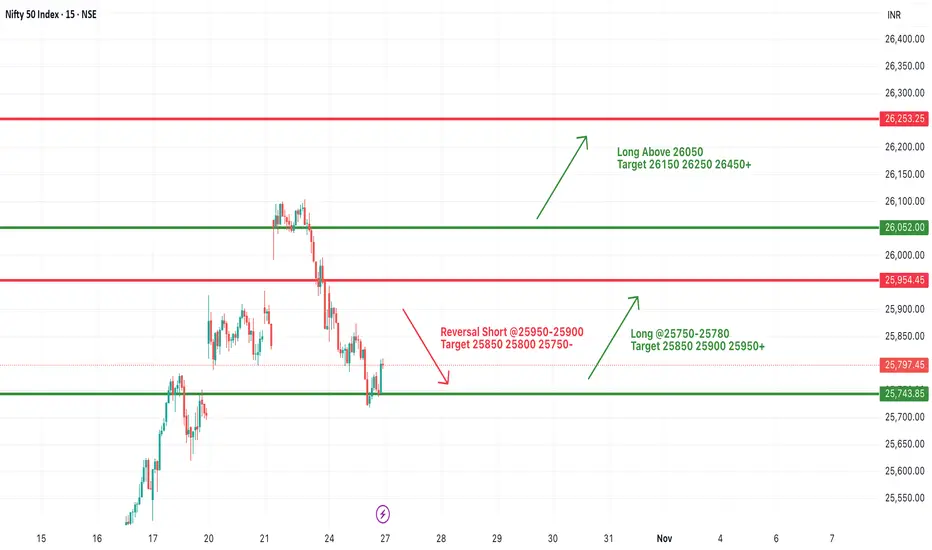
#NIFTY Intraday Support and Resistance Levels - 20/11/2025Nifty is expected to open with a gap-up, indicating continued bullish sentiment and strength above the immediate consolidation zone. If the index sustains above the 26050 level after the opening, it will activate the long trade setup with upside targets of 26150, 26200, and 26250+. A further breakout above 26250 may fuel the next bullish leg toward 26350, 26400, and 26450+.
On the downside, weakness will only come if Nifty slips below the 25950–25900 zone, where short opportunities open up with downside targets at 25850, 25800, and 25750-. For now, the structure remains positive, and the gap-up opening is likely to keep buyers in control as long as key support levels hold firm.
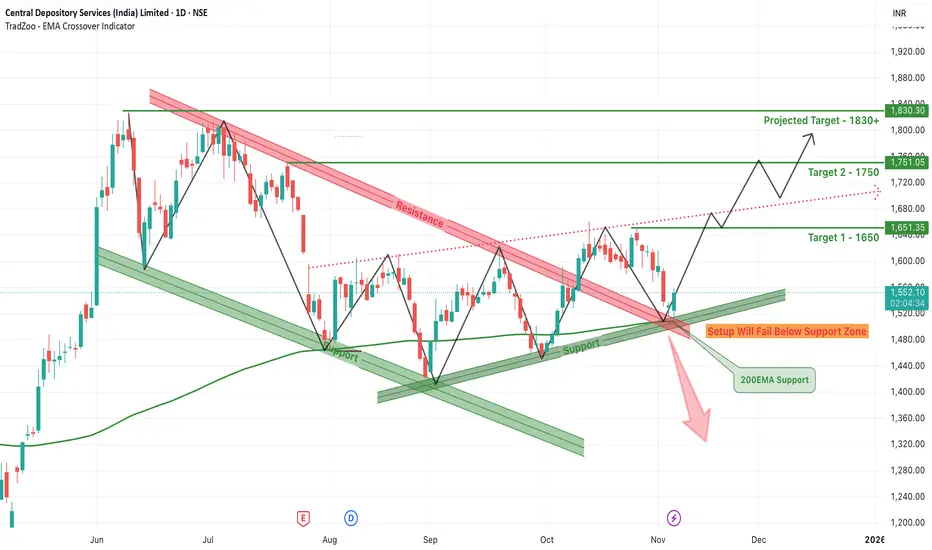
CDSL Breakout from Falling Wedge – Can It Rally to 1830+?CDSL has recently broken out from a classic falling wedge pattern, a bullish technical setup that often signals a trend reversal or continuation of the broader uptrend. After months of being compressed between a descending resistance and a well-established support line, the stock has now pierced through the upper resistance zone with notable bullish momentum.
The wedge had formed over several months, creating lower highs and relatively equal or slightly rising lows. The pattern was further supported by a confluence with the 200 EMA, which acted as a critical dynamic support near the breakout zone. This alignment of technical indicators added strength to the breakout confirmation seen recently.
With this breakout, CDSL has now opened doors for higher targets. The immediate Target 1 is set at ₹1650, which also aligns with a recent horizontal resistance zone. Once this is breached, the next move could extend toward Target 2 at ₹1750, a level where previous price action has shown hesitation. If momentum continues to build and the broader market supports the move, the final projected target of ₹1830+ becomes achievable in the short to medium term.
However, it’s crucial to note that the support zone below ₹1480 is acting as a critical invalidation point for this bullish setup. Any strong breakdown below this zone, especially with volume, would fail the bullish structure and may push the stock back into consolidation or a deeper correction. Traders must also watch the red dotted trendline, which represents a former resistance turned possible retest zone.
Overall, the technical landscape is now favoring the bulls, especially after the breakout confirmation and support from the 200 EMA. Traders and investors should monitor price action near the projected levels and manage risk accordingly, while riding the momentum above the wedge resistance.
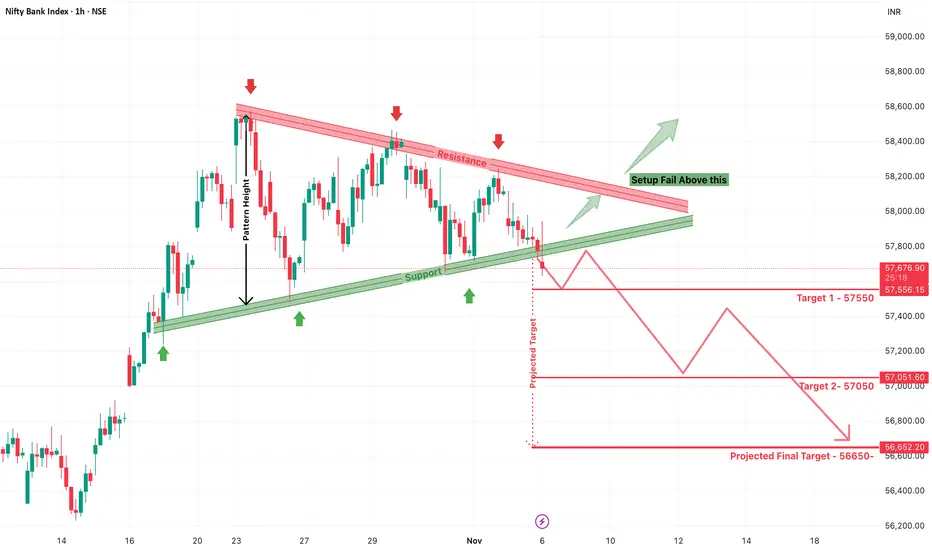
Bank Nifty Breakdown – Rising Wedge Breakdown Hints sellingBank Nifty has recently shown a significant technical development that could mark a short-term reversal: a breakdown from a rising wedge pattern below its support trendline. The rising wedge is generally a bearish reversal pattern when occurring after an uptrend, and in this case, the structure has played out with textbook precision.
Initially, Bank Nifty attempted to break above the resistance zone around 58,200–58,400, but it failed to sustain the move. This fake breakout, often referred to as a bull trap, is a strong bearish signal—especially when followed by a clean breakdown of the support line, as seen near the 57,800 level. The price has now convincingly moved below this support zone, confirming a potential trend reversal.
The pattern's height, which represents the distance between the highest swing high and lowest swing low within the wedge, has been used to project the downside targets. According to this breakdown setup, the following bearish targets are now in play:
Target 1: 57,550
Target 2: 57,050
Projected Final Target: 56,650
These targets are marked clearly on the chart and represent areas where price action may find temporary support or experience short-covering bounces. However, unless Bank Nifty reclaims the upper wedge zone and invalidates the breakdown, the path of least resistance remains downward.
What makes this move even more credible is the series of lower highs formed under resistance, showing consistent selling pressure. Simultaneously, the failed breakout has likely triggered stop losses of aggressive long positions, adding to the downward momentum.
Traders should now watch for confirmation of this breakdown with volume and follow-through candles. Any bounce back to the 57,800–58,000 zone should be approached with caution, as it may act as a fresh supply zone unless strongly reclaimed.
#NIFTY Intraday Support and Resistance Levels - 27/10/2025Nifty is expected to open flat near the 25,780–25,800 zone, showing signs of early stabilization after the recent decline. The market continues to trade within a consolidation range, and today’s session will be crucial to determine if a short-term reversal or continuation of the downtrend unfolds.
If Nifty holds above 25,780–25,800, we could see an upward move toward 25,850, 25,900, and 25,950+ levels. Sustaining above 25,950 may attract buying interest and extend the rally toward 26,050 and 26,150 zones.
On the downside, immediate support lies near 25,750–25,700. A breakdown below this zone could invite fresh selling pressure, dragging the index toward 25,600 and 25,500 levels.
Overall, a flat opening suggests a neutral start with balanced sentiment. Traders should focus on 25,780 as the pivot level, waiting for a clear breakout or breakdown before entering. Maintaining tight stop losses and booking partial profits near key resistance levels is advisable in this range-bound market.
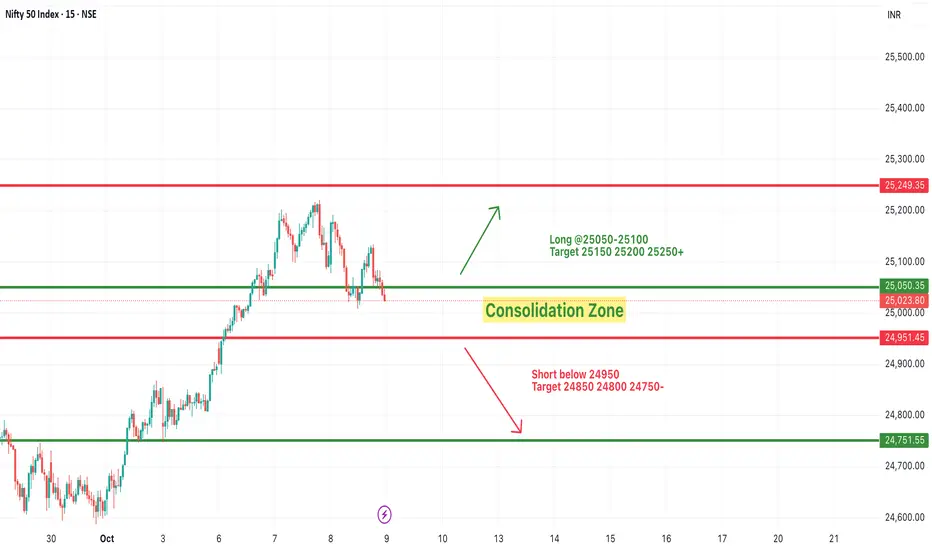
#NIFTY Intraday Support and Resistance Levels - 09/10/2025Nifty is expected to open slightly gap up near the 25,050 zone after yesterday’s mild correction. The index is currently trading within a consolidation range between 24,950 and 25,100, indicating indecision among traders ahead of a possible breakout.
If Nifty sustains above 25,050–25,100 after opening, it may trigger a bullish move toward 25,150, 25,200, and 25,250+. A breakout above 25,250 will likely extend the uptrend toward 25,350–25,450+ levels.
However, if the index slips below 24,950, it could invite short-term selling pressure, dragging prices toward 24,850, 24,800, and 24,750-.
Overall, the bias remains neutral to positive with a slight gap-up opening. Traders should focus on the breakout from the current consolidation zone for directional clarity, maintaining strict stop-loss levels for intraday trades.
GMR Airports Ltd – Bullish Bounce from Support ZoneThe chart of GMR Airports Ltd (Daily timeframe) is showcasing a well-respected ascending channel pattern, where price is currently bouncing off the lower support trendline, indicating a continuation of the bullish structure. This setup provides a compelling long opportunity if confirmed with price action.
• Uptrend Channel Structure Remains Intact
GMR Airports has been moving within a clearly defined uptrend channel with multiple touches at both resistance and support zones. The current bounce is happening near the support line, which has previously acted as a strong reversal point — suggesting that buyers are stepping in again.
• Twizzer Bottom Candlestick at Support
A key bullish candlestick pattern, the Twizzer Bottom, has formed right at the trendline support. This candlestick combo is known for reversal potential, especially at critical zones like this. The confluence of support + reversal pattern adds strong conviction to the bullish setup.
• EMA Support Alignment
The price also aligns closely with the 50-day EMA (blue line) and is above the 200-day EMA (red line) — a typical bullish sign in trend-following strategies. This alignment reinforces the uptrend bias and increases the odds of an upside continuation.
• Upside Targets Clearly Marked
- The initial target is placed at ₹93+, which corresponds to the last swing high.
- Target 2 is marked at ₹97+, aligning with the 52-week high.
- If price breaks through the upper resistance channel with momentum, the final target may extend higher, potentially entering price discovery mode.
• Risk Management is Well Defined
- The stop-loss is marked below ₹85, just under the previous swing low and trendline support.
- A close below this level will indicate a long setup failure, and the structure will need re-evaluation.
- This gives a favorable risk-reward ratio for swing traders entering at current levels.
• Conclusion – Watch for Momentum Confirmation
If follow-through buying occurs in the coming sessions, this could lead to a sharp upward move back toward the upper channel resistance. Traders should wait for volume expansion and strong candle closure above ₹88 for further confirmation. The overall bias remains bullish until the lower channel is broken convincingly.

XAUUSD – Trading Plan: Gold Awaits PCE Catalyst📊 Market Context
Gold remains in consolidation mode after a sharp run earlier this week, holding steady below 3750. The market is now laser-focused on the US Core PCE Index, which could provide fresh direction for both the dollar and precious metals. With US yields stabilising and risk sentiment shifting, gold’s safe-haven appeal remains intact — but traders are weighing whether the recent pullback is a healthy correction or the start of a deeper retracement.
Meanwhile, the geopolitical backdrop continues to offer underlying support, while positioning in ETFs and futures suggests investors are cautious, awaiting clearer signals from the Fed. The upcoming data will likely decide whether gold breaks higher towards fresh highs or retests deeper liquidity zones.
🔎 Technical Analysis (H1/H4)
Price capped near short-term resistance at 3770–3772.
Immediate supports are 3741 and 3722, with deeper demand zones at 3690–3688 and 3670–3668.
The structure indicates possible liquidity sweeps before a decisive move.
🔑 Key Levels
Resistance / Sell Zone: 3770–3772
Support / Buy Zones: 3690–3688, 3670–3668
📈 Scenarios & Trading Plan
BUY ZONE 1: 3690–3688
SL: 3684
TP: 3695 - 3700 - 3710 - 3720 - 3730 - ???
BUY ZONE 2: 3670–3668
SL: 3664
TP: 3675 - 3680 - 3690 - 3700 - 3710 - ???
SELL ZONE: 3770–3772
SL: 3777
TP: 3765 - 3760 - 3750 - 3740 - ???
⚠️ Risk Notes
Watch for false breakouts at 3770–3772 before reversal.
PCE release may inject volatility across gold and USD pairs.
Position sizing and risk control are crucial into data.
✅ Summary
Gold is at a crossroads — safe-haven demand is still supportive, but technical resistance near 3770 remains a hurdle. Core strategy: buy dips into 3690–3670 zones, while staying cautious of short-term sell setups at 3770–3772. Manage exposure, wait for confirmation, and be prepared for volatility once PCE data hits.
📢 Follow MMFLOW TRADING for real-time updates and next-level trade setups.

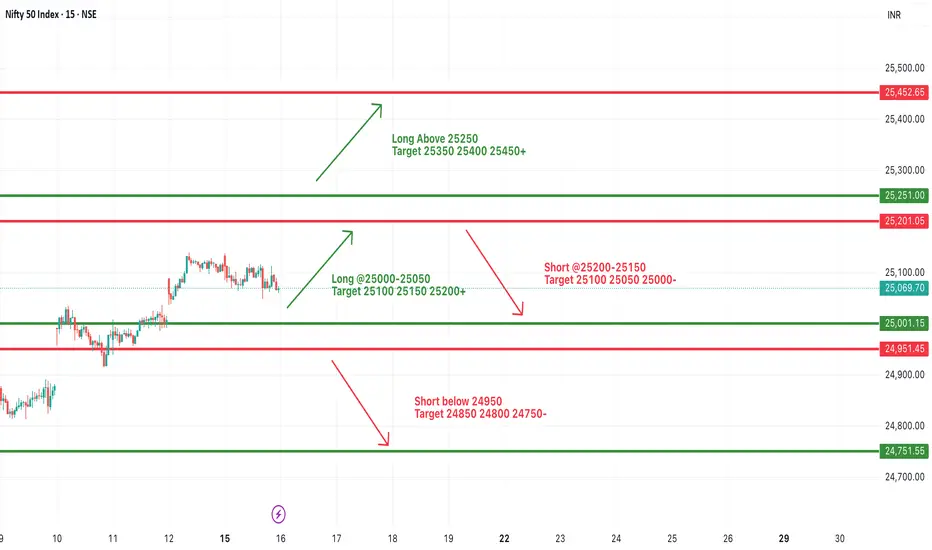
#NIFTY Intraday Support and Resistance Levels - 16/09/2025Nifty is expected to open on a flat note, with no major changes seen from yesterday’s levels. The market continues to hover within a defined range, suggesting that intraday traders should wait for a breakout or breakdown before taking fresh positions.
On the upside, fresh momentum can be seen if Nifty sustains above 25,000–25,050, opening the path toward 25,100, 25,150, and 25,200+. A stronger rally can only be expected once Nifty clears 25,250, which may push it further toward 25,350–25,450+.
On the downside, weakness may emerge if Nifty slips below 25,200–25,150, which could drag it toward 25,100, 25,050, and 25,000-. A further breakdown below 24,950 will intensify selling pressure, with targets at 24,850, 24,800, and 24,750-.
Overall, Nifty is in a consolidation phase, and traders should follow a wait-and-watch approach near key levels. A flat opening signals indecision, so risk management and quick profit booking will be crucial.
USD/JPY(20250910)Today's AnalysisMarket News:
U.S. employment data was significantly revised downward, with the number of jobs for the 12 months ending in March revised down by 911,000.
Technical Analysis:
Today's Buy/Sell Levels:
147.08
Support and Resistance Levels:
148.32
147.85
147.55
146.60
146.30
145.84
Trading Strategy:
On a breakout above 147.55, consider a buy entry, with the first target at 147.85.
On a breakout below 147.08, consider a sell entry, with the first target at 146.60
