HDFC Bank ltd // 3hour Support and ResistanceAs of May 5, 2025, here are the key support and resistance levels for HDFC Bank Ltd. (NSE: HDFCBANK) based on the 3-hour chart:
📊 3-Hour Pivot Points
Level Value (₹)
S3 1,689.18
S2 1,701.12
S1 1,714.03
Pivot 1,725.97
R1 1,738.88
R2 1,750.82
R3 1,763.73
These levels are calculated based on the previous day's high, low, and close prices and are used to identify potential support and resistance zones.
📈 Technical Indicators
Relative Strength Index (RSI): 72.46 (Strong Uptrend)
Stochastic RSI: 0.92 (Strong Uptrend)
Commodity Channel Index (CCI): 130.18 (Strong Uptrend)
Money Flow Index (MFI): 86.61 (Strong Uptrend)
These indicators suggest a strong bullish momentum, indicating potential upward movement if buying interest continues.
📌 Summary
Immediate Support: ₹1,689.18
Immediate Resistance: ₹1,738.88
Medium-Term Outlook: Bullish, with strong momentum indicators and positive moving averages.
Please note that technical analysis is subject to change based on market conditions. It's advisable to monitor these levels regularly and consider consulting with a financial advisor for personalized investment advice.
Technical

RR KABEL LTDAs of May 5, 2025, here are the key support and resistance levels for R R Kabel Ltd. (NSE: RRKABEL) based on recent technical analyses:
📊 Classic Pivot Points (1-Day View)
Support Levels:
S3: ₹880.40
S2: ₹901.70
S1: ₹924.85
Resistance Levels:
R1: ₹969.30
R2: ₹990.60
R3: ₹1,013.75
Pivot Point: ₹946.15
These levels are derived from the price range of the previous trading day and are commonly used to identify potential reversal points in the market.
📈 Moving Averages & Indicators
Simple Moving Averages (SMA):
5-Day: ₹915.44 (Buy)
10-Day: ₹911.38 (Buy)
20-Day: ₹907.79 (Buy)
50-Day: ₹891.27 (Buy)
100-Day: ₹896.50 (Buy)
200-Day: ₹1,012.39 (Sell)
Exponential Moving Averages (EMA):
5-Day: ₹918.88 (Buy)
10-Day: ₹913.53 (Buy)
20-Day: ₹906.36 (Buy)
50-Day: ₹898.08 (Buy)
100-Day: ₹928.24 (Sell)
200-Day: ₹1,003.36 (Sell)
The alignment of these averages suggests a bullish short-term to medium-term outlook, with some indicators signaling bearish trends in the long term.
📉 RSI & Momentum Indicators
Relative Strength Index (RSI): 65.27 (Buy)
Stochastic RSI: 68.79 (Buy)
MACD: 7.38 (Buy)
Average Directional Index (ADX): 35.19 (Buy)
These indicators suggest a strong bullish momentum, indicating potential upward movement if buying interest continues.
📌 Summary
Immediate Support: ₹880.40
Immediate Resistance: ₹969.30
Medium-Term Outlook: Bullish, with strong momentum indicators and positive moving averages.

IOC LTDIOC
BUY
Entry price above: 145 Target 155/165
Stop loss 138
Time period: Swing/Positional call
After crossing 145 levels stock can show a good up move. Good reports are also there.
I am just representing my views For educational purposes only.

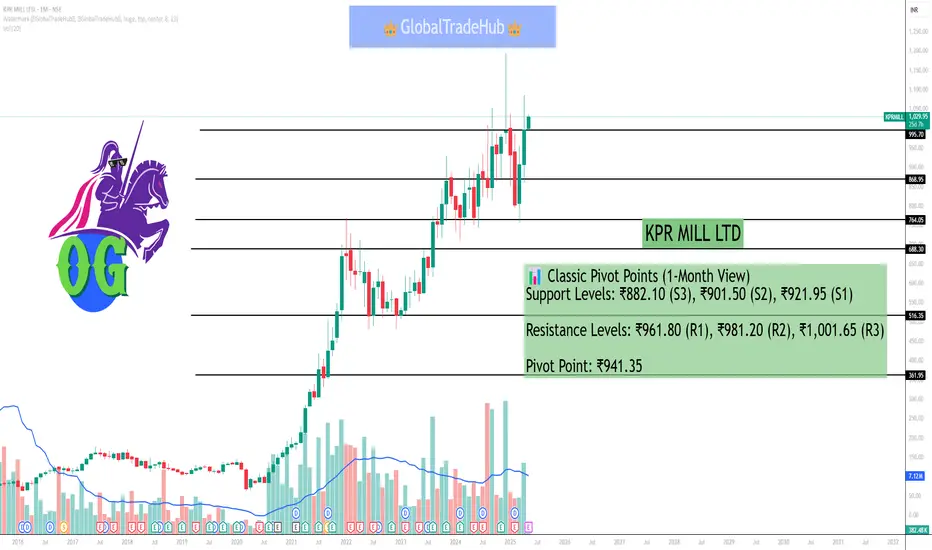
KPR MILL LTDAs of May 5, 2025, here are the key support and resistance levels for KPR Mill Ltd. (NSE: KPRMILL) based on recent technical analyses:
📊 Classic Pivot Points (1-Month View)
Support Levels: ₹882.10 (S3), ₹901.50 (S2), ₹921.95 (S1)
Resistance Levels: ₹961.80 (R1), ₹981.20 (R2), ₹1,001.65 (R3)
Pivot Point: ₹941.35
These levels are derived from the previous month's price range and are commonly used to identify potential reversal points in the market.
📈 Moving Averages & Indicators
Simple Moving Averages (SMA):
5-Day: ₹971.43
10-Day: ₹963.19
20-Day: ₹985.48
50-Day: ₹993.04
100-Day: ₹952.26
200-Day: ₹901.74
Exponential Moving Averages (EMA):
5-Day: ₹925.25 (Buy)
10-Day: ₹933.29 (Buy)
20-Day: ₹952.39 (Sell)
50-Day: ₹968.62 (Sell)
100-Day: ₹951.72 (Sell)
200-Day: ₹904.76 (Buy)
The alignment of these averages suggests a mixed short-term to medium-term outlook, with some indicators signaling bullish trends and others indicating bearish tendencies.
📉 RSI & Momentum Indicators
Relative Strength Index (RSI): 42.56 (Neutral)
Stochastic RSI: 59.15 (Buy)
MACD: 8.04 (Buy)
Average Directional Index (ADX): 32.45 (Buy
These indicators suggest a neutral to slightly bullish momentum, indicating potential upward movement if buying interest increases.
📌 Summary
Immediate Support: ₹882.10
Immediate Resistance: ₹961.80
Medium-Term Outlook: Neutral to slightly bullish, with mixed signals from moving averages and momentum indicators.
Bank NiftyBank Nifty Intraday Outlook - 1H Chart (May 05)
Price is hovering near a key support zone. A breakdown could lead to further downside, but watch for a potential bounce from the recent support area. Plan your trades wisely!!
Key Levels to Watch:
Support: 54,400-54,600
Resistance: 55,500-56,000
Stay disciplined. Trade with logic, not emotion.

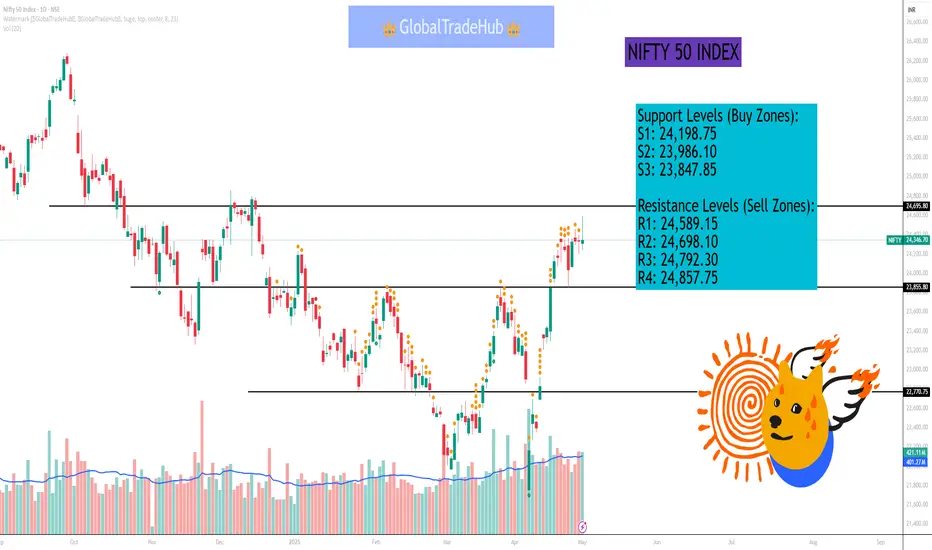
NIFTY 50 INDEXNifty 50 Intraday Levels for May 5, 2025
Previous Close (Reference Price):
24,313.65
Support Levels (Buy Zones):
S1: 24,198.75
S2: 23,986.10
S3: 23,847.85
Resistance Levels (Sell Zones):
R1: 24,589.15
R2: 24,698.10
R3: 24,792.30
R4: 24,857.75
ICICI Bank ICICI Bank (1D) Technical View
▲ Pattern Formed:
*Ascending Triangle Breakout - strong bullish continuation pattern
Intraday Buy Entry: *1,435-*1,440
Target Price: *1,465
Stop Loss: *1,422
? Breakout above multi-top resistance zone with strong volume confirmation signals momentum.
Risk-reward is favorable for intraday trade.
#ICICIBANK

Technical ConceptA "technical concept" refers to a specific idea or principle within a technical field, like engineering, computer science, or a specific industry. It's a fundamental building block that helps explain how something works, what it does, and why it's used. These concepts are often complex and require a certain level of technical understanding.

Option TradingOptions trading may seem overwhelming at first, but it’s easy to understand if you know a few key points. Investor portfolios are usually constructed with several asset classes. These may be stocks, bonds, exchange-traded funds (ETFs), and mutual funds. Options are another asset class, and when used correctly, they offer many advantages that trading stocks and ETFs alone cannot.

Meaning of Divergence In trading, divergence refers to a situation where an asset's price movement is not aligned with the movement of a technical indicator or other data point. It's a signal that the underlying momentum of an asset might be weakening and could indicate a potential trend reversal or continuation.

Bharti Airtel Ltd // 2hour Support and ResistanceAs of May 3, 2025, here are the key 2-hour support and resistance levels for Bharti Airtel Ltd (NSE: BHARTIARTL):
📊 2-Hour Support and Resistance Levels
Level Price (₹) Type
Support 1 1,590.27
Support 2 1,561.57
Support 3 1,549.38
Resistance 1 1,618.97
Resistance 2 1,606.78
Resistance 3 1,635.48
These levels are derived from the classic pivot point method and are crucial for traders to monitor, as movements beyond these points may indicate potential changes in the stock's trend.
🔍 Technical Indicators
As of the latest available data:
Relative Strength Index (RSI): 39.84, indicating neutral momentum.
Stochastic RSI: 11.36, suggesting potential for upward movement.
Commodity Channel Index (CCI): -155.75, reflecting bearish momentum.
Money Flow Index (MFI): 62.2, indicating an uptrend.
These indicators suggest a neutral to slightly bullish outlook for the stock.
📈 Strategy Considerations
Bullish Scenario: If the stock price maintains above the support levels, particularly Support 1 at ₹1,590.27, it may continue its upward movement towards Resistance 1 at ₹1,618.97.
Bearish Scenario: A drop below Support 1 could signal a potential reversal or consolidation phase.
Please note that these levels are based on historical data and should be used in conjunction with other technical analysis tools and market conditions.

Tata Power Corporation Ltd // 3hour Support and ResistanceAs of May 3, 2025, here are the key 3-hour support and resistance levels for Tata Power Company Ltd (NSE: TATAPOWER):
📊 3-Hour Support and Resistance Levels
Level Price (₹) Type
Support 1 349.81
Support 2 348.43
Support 3 346.76
Resistance 1 352.86
Resistance 2 354.53
Resistance 3 355.91
These levels are derived from the classic pivot point method and are crucial for traders to monitor, as movements beyond these points may indicate potential changes in the stock's trend.
🔍 Technical Indicators
As of the latest available data:
Relative Strength Index (RSI): 44.03, indicating neutral momentum.
Stochastic RSI: 0, suggesting oversold conditions.
Commodity Channel Index (CCI): -133.29, reflecting bearish momentum.
Money Flow Index (MFI): 56.07, indicating neutral buying and selling pressure.
These indicators suggest a neutral to slightly bearish outlook for the stock.
📈 Strategy Considerations
Bullish Scenario: If the stock price maintains above the support levels, particularly Support 1 at ₹349.81, it may continue its upward movement towards Resistance 1 at ₹352.86.
Bearish Scenario: A drop below Support 1 could signal a potential reversal or consolidation phase.
Please note that these levels are based on historical data and should be used in conjunction with other technical analysis tools and market conditions.

Tata Motors Ltd //1day Supoort and ResistanceAs of May 3, 2025, here are the key 1-day support and resistance levels for Tata Motors Ltd (NSE: TATAMOTORS):
📊 1-Day Support and Resistance Levels
Level Price (₹) Type
Support 1 703
Support 2 690
Support 3 683
Resistance 1 724
Resistance 2 731
Resistance 3 744
These levels are derived from the classic pivot point method and are crucial for traders to monitor, as movements beyond these points may indicate potential changes in the stock's trend.
🔍 Technical Indicators
As of the latest available data:
Relative Strength Index (RSI): 47.9, indicating neutral momentum.
Stochastic RSI: 0.33, suggesting a downtrend.
Commodity Channel Index (CCI): 32.01, reflecting neutral momentum.
Money Flow Index (MFI): 65.42, indicating an uptrend.
These indicators suggest a neutral to slightly bullish outlook for the stock.
📈 Strategy Considerations
Bullish Scenario: If the stock price maintains above the support levels, particularly Support 1 at ₹703, it may continue its upward movement towards Resistance 1 at ₹724.
Bearish Scenario: A drop below Support 1 could signal a potential reversal or consolidation phase.
Please note that these levels are based on historical data and should be used in conjunction with other technical analysis tools and market conditions.

Manorama Industries LtdAs of May 3, 2025, here are the key intraday support and resistance levels for Manorama Industries Ltd (NSE: MANORAMA):
📊 1-Day Support and Resistance Levels
Level Price (₹) Type
Support 1 1,026.73
Support 2 1,015.37
Support 3 995.73
Resistance 1 1,057.73
Resistance 2 1,077.37
Resistance 3 1,088.73
These levels are derived from the classic pivot point method and are crucial for traders to monitor, as movements beyond these points may indicate potential changes in the stock's trend.
🔍 Technical Indicators
As of the latest available data:
Relative Strength Index (RSI): 47.18, indicating neutral momentum.
Money Flow Index (MFI): 32.60, suggesting selling pressure.
MACD: -5.85, indicating a bearish trend.
These indicators suggest a neutral to bearish outlook for the stock.
📈 Strategy Considerations
Bullish Scenario: If the stock price maintains above the support levels, particularly Support 1 at ₹1,026.73, it may continue its upward movement towards Resistance 1 at ₹1,057.73.
Bearish Scenario: A drop below Support 1 could signal a potential reversal or consolidation phase.
Please note that these levels are based on historical data and should be used in conjunction with other technical analysis tools and market conditions.

INDIAN RAIL TOUR CORPORATION LTDIRCTC | All Aboard the Breakout Train!
IRCTC is showing massive strength on the weekly charts - we're breaking out of a long-term channel that has capped price for months! This is a high-conviction setup for long-term investors looking to ride the India growth story through the railway sector.
Why IRCTC?
• Strong technical breakout
• Clean price structure with bullish momentum
Railway reforms + rising travel demand = long-term tailwinds
Investment View:
Add at CMP & on dips for long-term targets:
Target 1: 1080
Target 2: 1440
Time Horizon: 2+ years
If you're looking for a solid compounder in the railway space, IRCTC should definitely be on your radar!

NIFTY 50 INDEX
NIFTY 50 | Impulse Rally Nearing Completion - Selling Can Start Soon! ▼
NIFTY 50 appears to be nearing the final stage of Wave 5 of the larger degree Wave 1. Price has reached the crucial Fibonacci resistance zone at 24679, and the broader 24700-24800 range is shaping up as a strong shorting zone. This area is technically significant and could trigger profit booking or fresh selling pressure as we approach the upper boundary of the wave count.
If the index closes near the day's high today, there's a strong possibility that Monday opens with a gap-up, but this is likely to face heavy selling within the first 1-2 hours. The momentum is stretched, and the current rally looks exhausted on the lower time frames.
As we step into the next phase, a corrective Wave 2 is expected to unfold, with downside potential towards 24000 and even 23600 as part of this pullback. This leg could provide better positioning for medium-term traders. The broader structure now signals that the impulse rally is overextended, and selling can begin soon from these stretched levels.

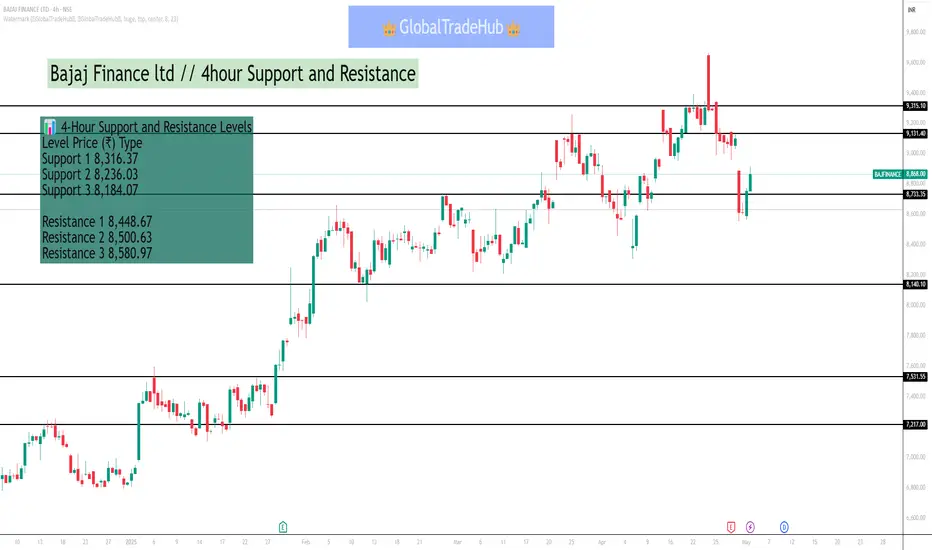
Bajaj Finance ltd // 4hour Support and ResistanceAs of May 3, 2025, Bajaj Finance Ltd (NSE: BAJFINANCE) is exhibiting the following key support and resistance levels on a 4-hour timeframe:
📊 4-Hour Support and Resistance Levels
Level Price (₹) Type
Support 1 8,316.37
Support 2 8,236.03
Support 3 8,184.07
Resistance 1 8,448.67
Resistance 2 8,500.63
Resistance 3 8,580.97
These levels are derived from the classic pivot point method and are crucial for traders to monitor, as movements beyond these points may indicate potential changes in the stock's trend.
🔍 Technical Indicators
As of the latest available data:
Relative Strength Index (RSI): 64.48, indicating an uptrend.
Stochastic RSI: 0.6, suggesting upward momentum.
Commodity Channel Index (CCI): 199.12, reflecting a strong uptrend.
Money Flow Index (MFI): 75.33, indicating strong buying pressure.
These indicators suggest a bullish trend, with the stock trading above its 20-day and 50-day Simple Moving Averages (SMA), and the 100-day and 200-day SMAs indicating an uptrend.
📈 Strategy Considerations
Bullish Scenario: If the stock price maintains above the support levels, particularly Support 1 at ₹8,316.37, it may continue its upward movement towards Resistance 1 at ₹8,448.67.
Bearish Scenario: A drop below Support 1 could signal a potential reversal or consolidation phase.
Please note that these levels are based on historical data and should be used in conjunction with other technical analysis tools and market conditions.
How to Trade ?Set Up Your Trading Account. ...
Learn Market Basics. ...
Master Bids and Asks. ...
Use Fundamental and Technical Analysis. ...
Set Stop-Loss to Minimise Risk. ...
Start Small and Choose Stable Stocks. ...
Open a Demat account. ...
Get familiar with stock-related terms.

Divergence In the stock market, divergence refers to when the price of an asset moves in a direction opposite to what a technical indicator, like an oscillator, indicates. This discrepancy can signal a weakening trend and a potential reversal. There are two main types of divergence: bullish and bearish.

Management and PsychologyTrading psychology refers to the emotional and mental state influencing a trader's decisions. It involves managing emotions like fear and greed, which can impact rational judgment and risk-taking, thus affecting trading outcomes. A disciplined mindset helps traders make logical decisions under pressure.

What is PCR ?PCR, or Polymerase Chain Reaction, is a molecular biology technique used to make many copies of a specific DNA segment. It's like a "molecular photocopying" process that amplifies a tiny DNA sequence into millions or even billions of copies. This technique is widely used in research, diagnostics, and forensics.

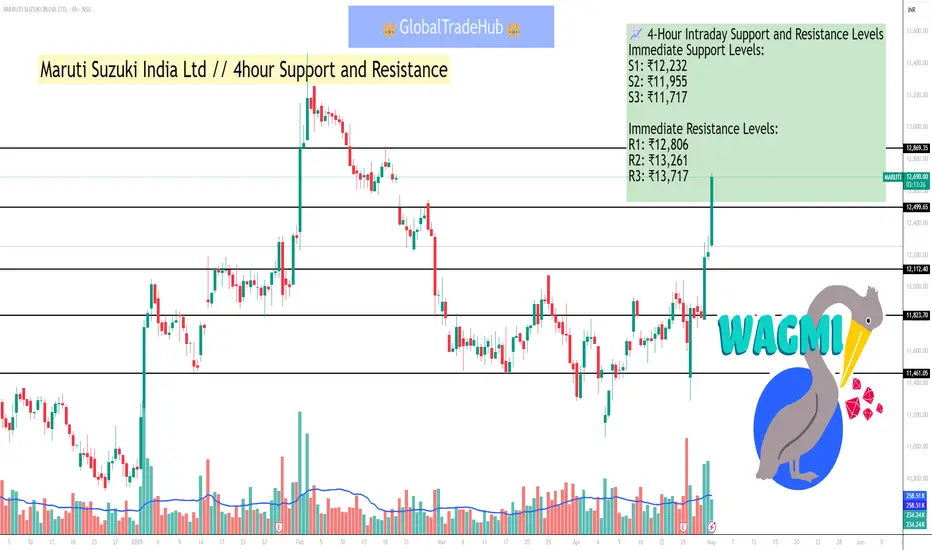
Maruti Suzuki India Ltd // 4hour Support and ResistanceAs of May 2, 2025, the 4-hour intraday chart for Maruti Suzuki India Ltd (NSE: MARUTI) indicates a bullish trend, with the stock trading at ₹12,257. The following support and resistance levels are derived from recent price action and technical analysis:
📈 4-Hour Intraday Support and Resistance Levels
Immediate Support Levels:
S1: ₹12,232
S2: ₹11,955
S3: ₹11,717
Immediate Resistance Levels:
R1: ₹12,806
R2: ₹13,261
R3: ₹13,717
These levels are based on recent price action and volume analysis, indicating potential breakout points and areas where the stock may find support.
🔍 Technical Indicators
RSI (14): 64.81, indicating bullish momentum.
MACD: 215.3, with a signal line of 116.03, suggesting upward momentum.
MFI (14): 76.87, indicating buying pressure.
EMA (50): ₹12,553.90, with the stock trading above this level, indicating a bullish short-term trend.
EMA (200): ₹12,348.91, with the stock trading above this level, indicating a bullish long-term trend.
These indicators suggest a continuation of the bullish trend, with potential for further upside movement.
📊 Chart Patterns
A recent Cup and Handle pattern has been observed, with the price breaking out from the handle formation. The measured move suggests a potential target of ₹13,280, contingent upon sustained volume and price momentum.
⚠️ Important Notes
Risk Management: Always use appropriate stop-loss orders to manage risk.
Market Conditions: Intraday levels are subject to change based on market conditions and news events.
Indian Oil Corporation LtdAs of May 2, 2025, the key intraday support and resistance levels for Indian Oil Corporation Ltd (NSE: IOC) are as follows:
Immediate Support Levels:
₹131.75
₹130.22
Immediate Resistance Levels:
₹138.63
₹146.46
These levels are derived from technical analysis and are subject to change based on market conditions.
