ACC LTDACC LTD:-
As of April 28, 2025, ACC Ltd (NSE: ACC) is trading at ₹2,327.85. Based on recent technical analysis, here are the key intraday support and resistance levels for a 15-minute chart timeframe:
📉 Support Levels (15-Minute Chart)
Support 1 (S1): ₹2,316.93
Support 2 (S2): ₹2,306.02
Support 3 (S3): ₹2,294.98
These levels are derived from recent pivot point calculations and may act as potential entry points or stop-loss levels for short trades.
📈 Resistance Levels (15-Minute Chart)
Resistance 1 (R1): ₹2,327.97
Resistance 2 (R2): ₹2,338.88
Resistance 3 (R3): ₹2,349.92
These resistance levels are based on recent pivot point calculations and can serve as potential targets for long trades or areas to watch for price reversals.
🔍 Technical Indicators (15-Minute Chart)
EMA (5): ₹2,310.56 (Bullish)
EMA (10): ₹2,309.98 (Neutral)
EMA (15): ₹2,310.18 (Bullish)
EMA (20): ₹2,310.68 (Mild Bullish)
EMA (50): ₹2,319.19 (Mild Bearish)
The shorter-term EMAs (5, 10, and 15) indicate a bullish trend, suggesting upward momentum. However, the 50-period EMA shows a mild bearish trend, indicating potential resistance at higher levels.
⚠️ Important Notes
Market Conditions: The stock market is influenced by various factors, including economic data, corporate earnings, and global events. It's essential to stay informed about these factors when making trading decisions.
Risk Management: Always use proper risk management techniques, such as setting stop-loss orders and only risking a small percentage of your trading capital on each trade.
Consult Professionals: Consider consulting with a financial advisor or conducting further research before making any trading decisions.
Technical

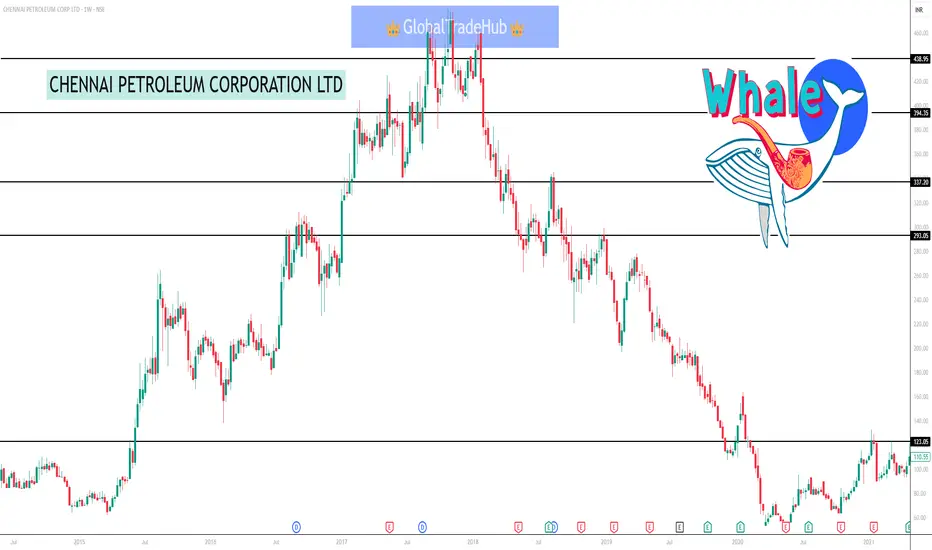
CHENNAI PETROLEUM CORPORATION LTD#CHENNPETRO
Weekly Time Frame Technical Analysis for Chennai Petroleum (CHENNPETRO) Potential Bullish Scenario:
If the bullish engulfing candle is confirmed with subsequent positive price action, the stock could see an upward move.
A break above the recent high around ₹670-1680 could signal further bullish momentum.
Potential Bearish Scenario:
Failure to sustain above the rising support trendline could lead to further downside.
Strong resistance might be encountered at higher levels, potentially limiting the upside.
Buy & Sell Setup (Weekly Time Frame):
Buy Setup:
Entry: Consider entering in the range of 2530 - ₹570, as suggested by some analysts, especially if there is confirmation of the bullish reversal.
Alternatively, a more conservative entry could be considered on a sustained break above ₹680. Targets:
Target 1: *650 - ₹670 (Short-term)
Target 2: *750 - ₹780 (Medium-term)
Target 3: *850+ (Medium to Long-term)
Stop Loss: Place a stop loss below the recent low or around 433 to manage risk, as suggested by some analyses. A slightly tighter stop loss could be considered based on your risk tolerance, potentially below a key weekly support level.
Sell Setup:
Entry: Consider a short position if the price breaks down decisively below the
rising support trendline, especially
Increased volume.
Targets: Potential targets could be previous support levels, such as ₹500, 450, and the recent low of *433.
Stop Loss: Place a stop loss above the breakdown level or a recent swing high to limit potential losses.
Important Considerations:
Potential Buy Setup Box:
Entry Zone: *580 - ₹635
This zone encompasses the current price action and the recent bullish engulfing candle. Entering within this range assumes the bullish momentum will continue. Target 1: *670 - ₹680 (Previous swing high, potential initial resistance)
Target 2: *750 - ₹780 (Medium-term target based on Fibonacci levels and previous price action)
Stop Loss: Below *530
This level provides a buffer below the recent low and the potential support trendline. A break below this could negate the immediate bullish scenario.
Potential Sell Setup Box:
Entry Zone: *670-2700
This zone represents a potential area of resistance based on the previous swing high. Shorting within this range assumes a failure to break above this level.
Target 1: *635 - *610 (Initial support level)
Target 2: *580 - ₹550 (Further support zone)
Stop Loss: Above *720
This level provides protection against a potential breakout above the resistance zone.
Visual Representation (Conceptual):
Potential Buy Setup:
Entry Zone: *580-2635
Target 1: 2670-680
Target 1: 670 - ₹680 Target 2: *750 - ₹780
Stop Loss: Below *530
Potential Sell Setup:
Entry Zone: *670 - ₹700
Target 1: *635-610
Target 2: 580-2550
Stop Loss: Above *720
This Analysis for only education purpose & learning
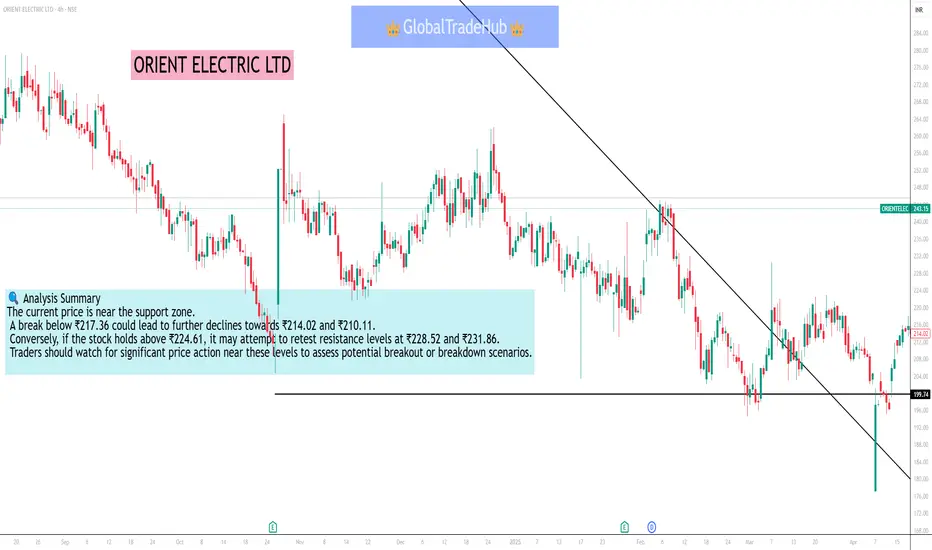
Orient Electric Ltd Orient Electric Ltd :-
🔹 Support Levels
S1: ₹217.36
S2: ₹214.02
S3: ₹210.11
🔹 Resistance Levels
R1: ₹224.61
R2: ₹228.52
R3: ₹231.86
These levels are derived from pivot point calculations and are widely used by traders to identify potential reversal points or breakout zones.
📊 Technical Indicators
Relative Strength Index (RSI): 57.51 (Neutral)
Average True Range (ATR): 11.34 (Indicates moderate volatility)
Moving Averages: The stock is trading below its 50-day, 100-day, and 200-day moving averages, suggesting a bearish trend.
🔍 Analysis Summary
The current price is near the support zone. A break below ₹217.36 could lead to further declines towards ₹214.02 and ₹210.11. Conversely, if the stock holds above ₹224.61, it may attempt to retest resistance levels at ₹228.52 and ₹231.86. Traders should watch for significant price action near these levels to assess potential breakout or breakdown scenarios.
RSI DivergenceRSI: Divergence appears when the RSI's highs or lows diverge from price. For example, if the price makes new lows but the RSI bottoms at higher levels, it signals bullish divergence; if the price makes new highs but the RSI peaks at lower levels, it signals bearish divergence.

Technical class 1In trading, "technical" refers to the practice of analyzing historical price and volume data to identify patterns and predict future price movements. This approach, called technical analysis, is a way to evaluate securities and forecast their behavior based on charts and statistical data.

Database Trading part 3InfluxDB is a high-performance, purpose-built time-series database designed for real-time analytics. It boasts low-latency writes, efficient storage, and a powerful query engine tailored for event-driven systems like algorithmic trading.

MACD Trading Part 2A common strategy is to buy when the MACD line crosses above the signal line, as this indicates bullish momentum. Another strategy is to sell when it crosses below (which indicates bearish momentum). Forex traders also often look for divergence

MACD Trading AnalysisIn trading, MACD stands for Moving Average Convergence Divergence. It's a technical indicator used to analyze the strength, direction, and momentum of a stock's price. The MACD helps traders identify potential entry and exit points in a trade by analyzing the convergence and divergence of two moving averages.

Advanced Database TradingAdvanced database systems are crucial in modern finance, particularly for trading, offering functionalities beyond standard relational database management systems. They provide tools for real-time data analysis, efficient storage, and low-latency writes, enabling algorithmic trading and other complex operations.

Option and Database TradingOption type: The options chain segregates call options, which allow you to buy TIL shares, and put options, which grant you the right to sell them. Bid and ask prices: Each option contract at a specific strike price and expiration date comes with bid and ask prices. For example, a call option with a strike price of Rs.

Meaning of RSIRelative Strength Index (RSI) Indicator Explained With FormulaRSI, or Relative Strength Index, is a technical indicator used in financial markets to measure the speed and change of price movements. It's a momentum oscillator that helps identify overbought and oversold conditions in an asset's price. Essentially, RSI helps determine if an asset's price is moving too fast and may be due for a correction.

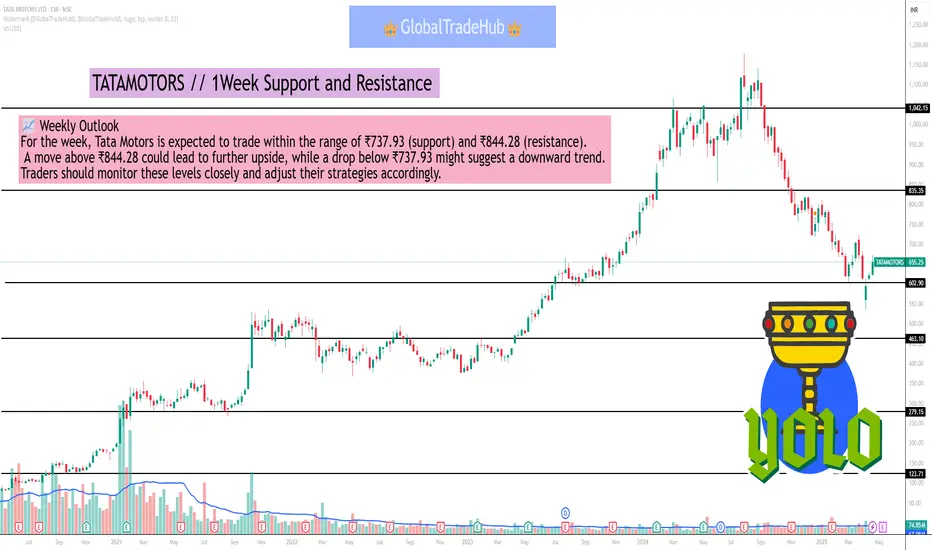
TATAMOTORS // 1Week Support and Resistance As of the latest available data, here are the key support and resistance levels for Tata Motors Ltd. (TATAMOTORS) for the upcoming week:
📊 Weekly Support and Resistance Levels
Type Level Value (₹)
Support S1 773.38
S2 756.47
S3 737.93
Resistance R1 808.83
R2 827.37
R3 844.28
These levels are derived from technical analysis and serve as potential entry, exit, or stop-loss points for traders. A breach below the support levels could indicate a bearish trend, while a breakout above the resistance levels may signal a bullish move.
🔍 Technical Indicators Overview
RSI (14): 43.38 — Indicates neutral momentum.
MACD (12,26): 0 — Suggests a neutral trend.
Moving Averages:
20-day SMA: 655.61 — Slightly below current price, indicating a potential short-term downtrend.
50-day SMA: 655.34 — Aligns with the 20-day SMA, reinforcing the neutral to bearish outlook.
200-day SMA: 655.93 — Further confirms the downtrend.
📈 Weekly Outlook
For the week, Tata Motors is expected to trade within the range of ₹737.93 (support) and ₹844.28 (resistance). A move above ₹844.28 could lead to further upside, while a drop below ₹737.93 might suggest a downward trend. Traders should monitor these levels closely and adjust their strategies accordingly.
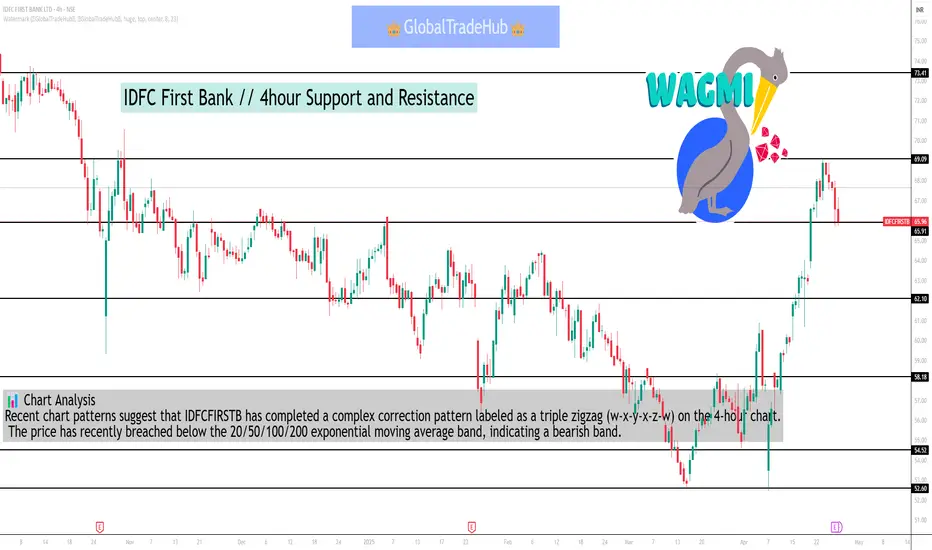
IDFC First Bank // 4hour Support and Resistance📈 4-Hour Support & Resistance Levels
Based on recent intraday analysis, the key support and resistance levels for IDFCFIRSTB on a 4-hour chart are:
Support Levels:
₹59.89 (S1)
₹59.15 (S2)
₹58.17 (S3)
Resistance Levels:
₹61.61
₹62.59
₹63.33
These levels are derived from the recent price action and can serve as potential entry or exit points for intraday traders.
🔍 Technical Indicators Overview
Relative Strength Index (RSI): Currently at 39.67, indicating a potential oversold condition and possible reversal if the price holds above key support levels.
Moving Averages:
20-day EMA: ₹56.78
50-day EMA: ₹58.88
100-day EMA: ₹61.87
200-day EMA: ₹66.42
The current price is below these moving averages, suggesting a bearish short-term trend.
Average True Range (ATR): 1.92, indicating moderate volatility.
📊 Chart Analysis
Recent chart patterns suggest that IDFCFIRSTB has completed a complex correction pattern labeled as a triple zigzag (w-x-y-x-z-w) on the 4-hour chart. The price has recently breached below the 20/50/100/200 exponential moving average band, indicating a bearish trend.
✅ Trading Strategy
Bullish Scenario: A break above ₹61.61 (R1) with sustained momentum could lead to a rally towards ₹62.59 (R2) and ₹63.33 (R3).
Bearish Scenario: A drop below ₹59.89 (S1) may accelerate the decline towards ₹58.17 (S3).
It's advisable to monitor volume and candlestick patterns for confirmation of breakout or breakdown.
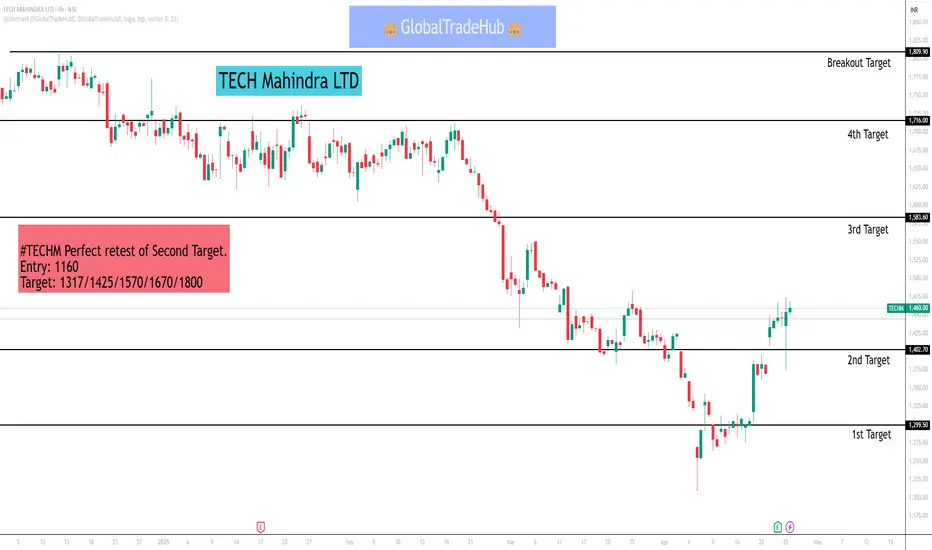
TECH Mahindra LTD
#TECHM Perfect retest of Second Target.
Entry: 1160
Target: 1317/1425/1570/1670/1800
Here are the key 4-hour support and resistance levels for Tech Mahindra Ltd. (TECHM) based on recent technical data:
🔹 4-Hour Support Levels
S1: ₹1,589.75
S2: ₹1,575.45
S3: ₹1,554.75
If the price falls below ₹1,589.75, the next support levels to watch are ₹1,575.45 and ₹1,554.75.
🔸 4-Hour Resistance Levels
R1: ₹1,624.75
R2: ₹1,645.45
R3: ₹1,659.75
If the price rises above ₹1,624.75, the next resistance levels are ₹1,645.45 and ₹1,659.75.
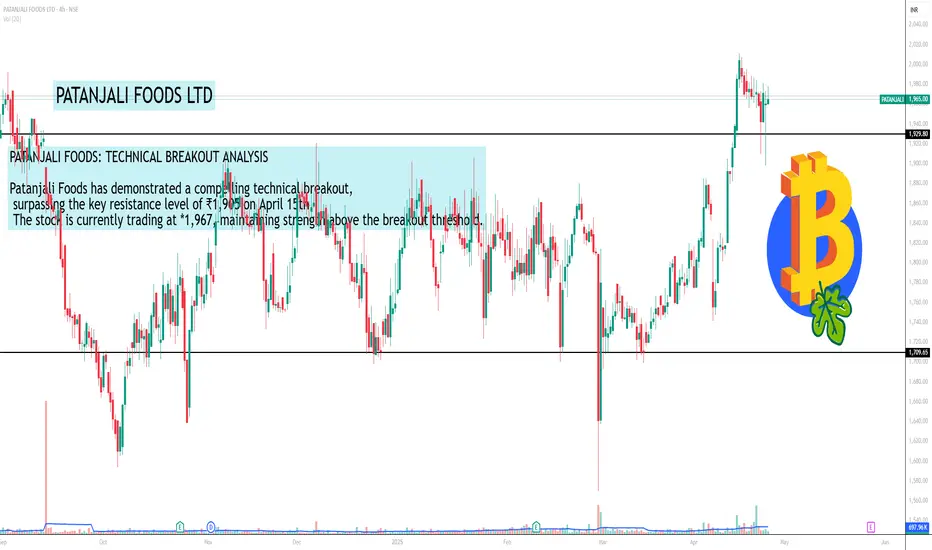
PATANJALI FOODSPATANJALI
PATANJALI FOODS: TECHNICAL BREAKOUT ANALYSIS
Patanjali Foods has demonstrated a compelling technical breakout, surpassing the key resistance level of ₹1,905 on April 15th. The stock is currently trading at *1,967, maintaining strength above the breakout threshold.
I've deliberately delayed sharing this analysis for 10 days to confirm pattern validity. During this period, the stock has established credibility through:
Consistent rejection tests with long lower wicks at upper price levels
Sustained buying pressure despite pullbacks
Healthy accumulation of new institutional positions
Based on current technical indicators, Patanjali Foods shows potential to reach a target of *2,100.
Investors should consider the following approach:
Watch for behavior at the psychological resistance of *2,000
Validate this analysis with your own technical assessment before entering Consider implementing strategic entry positions once confirming the trend continuation
This structured opportunity presents an attractive risk-reward scenario for those monitoring technical breakouts in the consumer goods sector. Retry Claude can make mistakes.
Please double-check responses. 3.7 Sonnet Chat controls 3.7 Sonnet Our most intelligent model yet Learn more Content
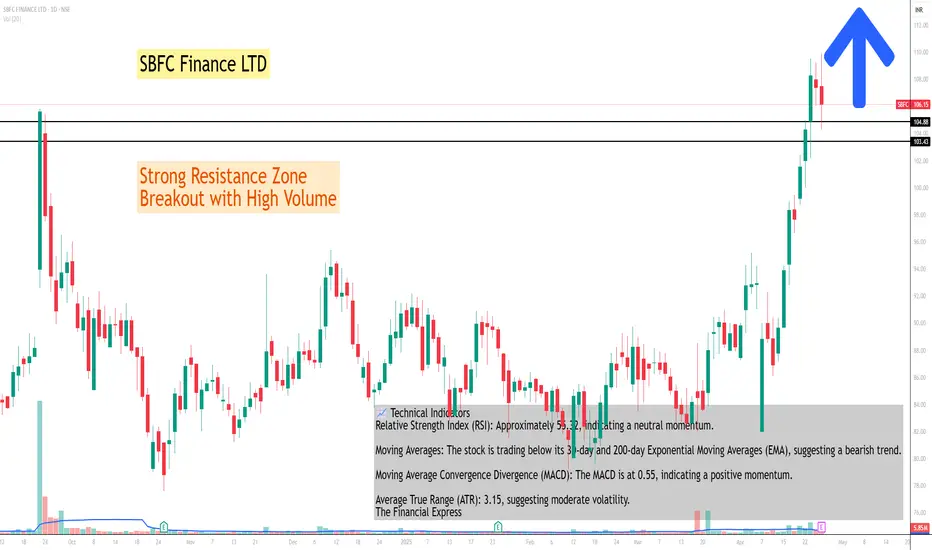
SBFC Finance ltdSBFC Finance ltd
📈 Technical Indicators
Relative Strength Index (RSI): Approximately 55.32, indicating a neutral momentum.
Moving Averages: The stock is trading below its 30-day and 200-day Exponential Moving Averages (EMA), suggesting a bearish trend.
Moving Average Convergence Divergence (MACD): The MACD is at 0.55, indicating a positive momentum.
Average True Range (ATR): 3.15, suggesting moderate volatility.
The Financial Express
🔍 Observations
The stock is currently trading below its key moving averages, which may indicate a bearish trend. However, the positive MACD and neutral RSI suggest potential for upward movement if the stock breaks above resistance levels. Traders should monitor the stock's price action around the pivot point of ₹89.48 and the resistance levels at ₹92.32, ₹94.01, and ₹96.85.
Please note that technical analysis is subject to market conditions and should be used in conjunction with other forms of analysis.
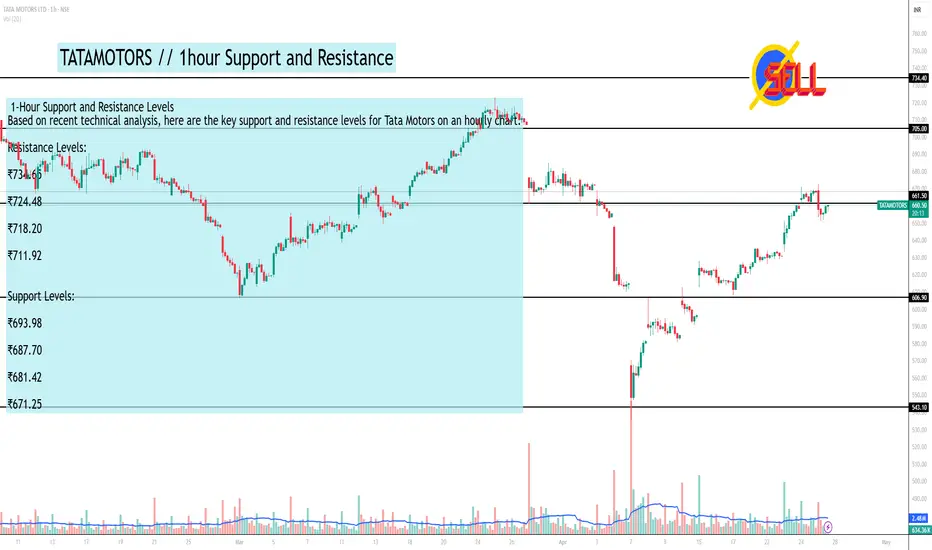
TATAMOTORS // 1hour Support and ResistanceAs of April 25, 2025, Tata Motors (NSE: TATAMOTORS) has experienced a significant intraday surge, reaching ₹606.45, up over 4% from its previous close of ₹582.90. This uptick is attributed to positive sentiment in the auto sector and broader market optimism.
📈 1-Hour Support and Resistance Levels
Based on recent technical analysis, here are the key support and resistance levels for Tata Motors on an hourly chart:
Resistance Levels:
₹734.65
₹724.48
₹718.20
₹711.92
Support Levels:
₹693.98
₹687.70
₹681.42
₹671.25
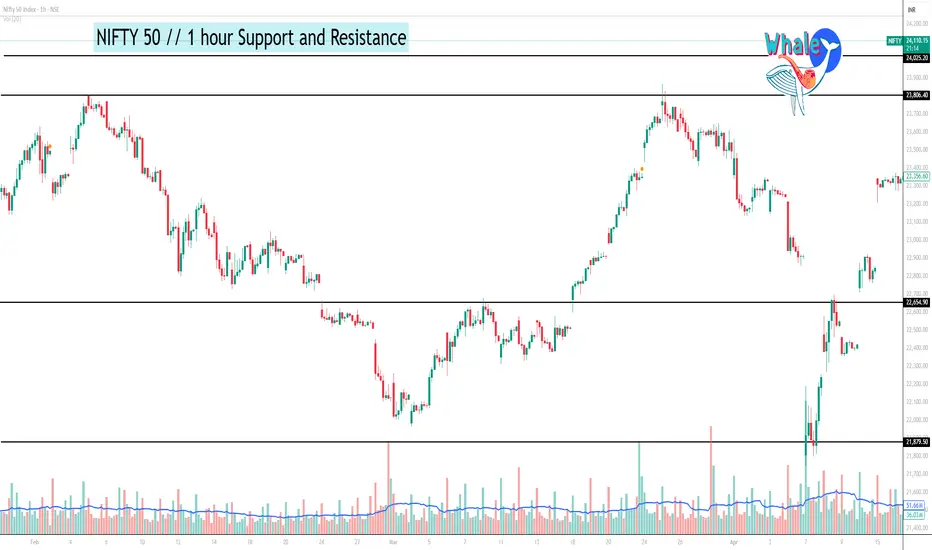
NIFTY 50 1 hour support and resistanceNifty Update
Current Price: 24,150
Nifty crossed 24,300, hitting a high of 24,365 - same as the day before yesterday's open.
Yesterday, it retested this key resistance but failed to sustain.
If Nifty reclaims and sustains above 24,300, it may attempt to break 24,365.
A breakout above that level can lead to an up move towards 24,442-24550.
Key Levels:
Support: 24,100-24000
Resistance: 24,300
#Nifty50 #StockMarket #NSE #TechnicalAnalysis
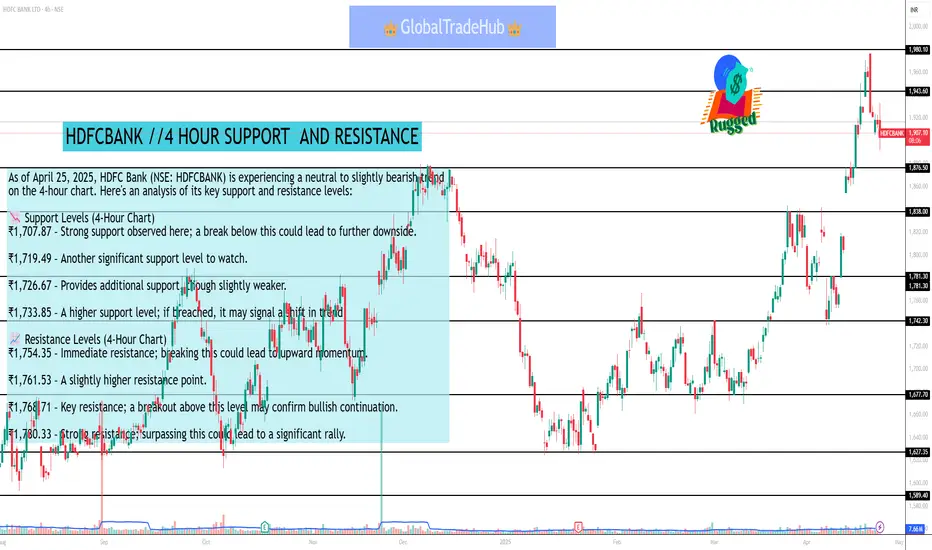
HDFCBANK //4 HOUR SUPPORT AND RESISTANCEAs of April 25, 2025, HDFC Bank (NSE: HDFCBANK) is experiencing a neutral to slightly bearish trend on the 4-hour chart. Here's an analysis of its key support and resistance levels:
📉 Support Levels (4-Hour Chart)
₹1,707.87 – Strong support observed here; a break below this could lead to further downside.
₹1,719.49 – Another significant support level to watch.
₹1,726.67 – Provides additional support, though slightly weaker.
₹1,733.85 – A higher support level; if breached, it may signal a shift in trend.
📈 Resistance Levels (4-Hour Chart)
₹1,754.35 – Immediate resistance; breaking this could lead to upward momentum.
₹1,761.53 – A slightly higher resistance point.
₹1,768.71 – Key resistance; a breakout above this level may confirm bullish continuation.
₹1,780.33 – Strong resistance; surpassing this could lead to a significant rally.
#KOTHARIPETRO SWING TRADE
#KOTHARIPETRO SWING TRADE
HORIZONTAL RANGE BREAKOUT
ENTRY - 170.50
SL - 160
Targets - 181/195/210+
Swing trading is a speculative trading strategy in financial markets where a tradable asset is held for one or more days in an effort to profit from price changes or 'swings'.

Candlesticks PatternCandlestick patterns are a visual representation of price movements over time, used in technical analysis to identify potential trends and market sentiment. They provide insights into the daily price action of a financial asset, including its open, high, low, and closing prices. These patterns can suggest whether the market is likely to continue trending or if a shift in direction is on the horizon.

RSI and RSI DivergenceRSI: Divergence appears when the RSI's highs or lows diverge from price. For example, if the price makes new lows but the RSI bottoms at higher levels, it signals bullish divergence; if the price makes new highs but the RSI peaks at lower levels, it signals bearish divergence.

Support And Resistance Part 2Support occurs at the point where a downtrend is expected to pause due to a concentration of demand. Resistance occurs at the point where an uptrend is expected to pause due to a concentration of supply.
