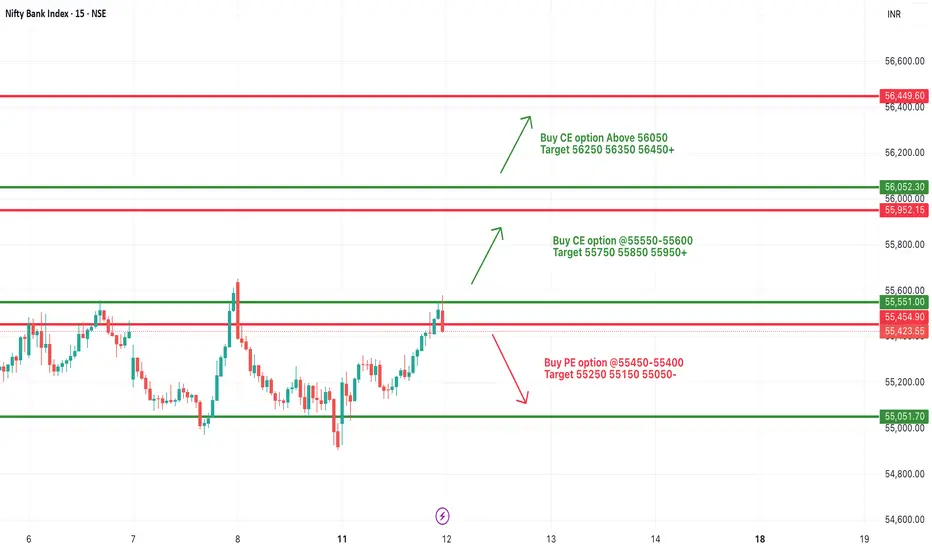
[INTRADAY] #BANKNIFTY PE & CE Levels(12/08/2025)Bank Nifty is likely to open with a gap-up, indicating strong bullish sentiment at the start. If the index sustains above 55,550–55,600, buying momentum may push it toward 55,750, 55,850, and 55,950+. Further strength can be expected if it breaks above 56,050, opening the path for 56,250, 56,350, and 56,450+.
On the downside, weakness could emerge if Bank Nifty falls below 55,450–55,400, which may lead to a decline toward 55,250, 55,150, and 55,050-. Price action around the 55,550 zone will be crucial in deciding intraday direction, so traders should wait for confirmation before entering trades and maintain strict stop-losses.
Technical
Gold Breakout Watch: Will XAUUSD Surge to $3760?Gold (XAUUSD) has spent the last few weeks coiling within a tight consolidation range, but the wait may soon be over. The daily chart shows a textbook rectangle formation, a powerful pattern that often precedes significant trend continuation. With prices currently pushing toward the upper resistance of this range, a bullish breakout could be imminent—and potentially explosive.
Let’s dive deep into the technical setup, the potential breakout targets, and what levels traders should be watching right now.
📉 The Pattern: Channel Consolidation
Since late May 2025, gold has been trapped in a sideways structure defined by:
Resistance Zone: $3,600 – $3,620
Support Zone: $3,270 – $3,290
This structure has formed after a massive prior rally earlier in the year, making it a classic bullish continuation pattern.
Each pullback into support has been met with buying, while resistance has repeatedly held—but now momentum is building.
Technically, this consolidation has validated itself with multiple swing points at both the upper and lower boundaries. The pattern is clean, well-respected, and supported by repeated reactions at both support and resistance levels. If the price breaks and sustains above the $3,620 resistance area, the pattern will be considered complete, signaling continuation of the prior bullish trend. While volume analysis isn't included in the chart, typically such breakouts are supported by increased participation, which can offer added confirmation.
If a breakout occurs, traders can target multiple price levels based on the height of the rectangle added to the breakout point. The first logical target would be around $3,616, followed by a swing-based target at $3,762. These levels are based on technical projection methods using the measured move technique. Importantly, price has already reached a reversal confirmation target around $3,430, which further validates bullish strength.
However, no setup is complete without acknowledging the risks. If gold fails to sustain the recent rally and instead breaks below $3,280 support, the current setup would be invalidated. This would shift the outlook to bearish and could push prices toward $3,200, $3,120, and possibly even lower toward the psychological support at $3,000.
From a trading perspective, the ideal bullish entry would be on a daily candle close above $3,620 or on a retest of the breakout zone with strong buying confirmation. A protective stop loss can be placed below the breakout candle or around the $3,550 area. Initial targets remain $3,616 and $3,762. In the bearish case, a breakdown below $3,280 would be a cue for shorting opportunities with stops above $3,300 and downside targets at $3,200 and $3,120.
In summary, gold is at a critical point on the chart. The current structure suggests a potential breakout is coming, and traders should be ready to act based on confirmed moves beyond key levels. Whether this pattern leads to a strong bullish continuation or a failed setup, the movement is expected to be sharp and potentially rewarding. This is a high-probability setup worth watching closely in the coming days.
=================================================================
Disclosure: I am part of Trade Nation's Influencer program and receive a monthly fee for using their TradingView charts in my analysis.
=================================================================

BUY IDEA EURAUD Looking to buy EURAUD after pull back expecting bulls to continue pushing the market higher.

Titan | Swing | Breakout Titan has just given a clean trendline breakout followed by a successful retest, which makes this setup quite interesting from a positional swing trade perspective.
✅ Trendline Breakout
• The stock broke a strong descending trendline that had been acting as resistance for several months.
✅ Retest and Bounce
• After the breakout, Titan came back to retest the breakout level near ₹3,380, which held well — a classic bullish sign. This bounce happened around the 38.2% Fibonacci retracement zone — another technical confluence that adds weight to the trade idea.
⸻
📈 Entry, Targets & Stop Loss
• Entry Zone: Around ₹3,665 – ₹3,695
• Stop Loss (SL): Below ₹3,202
Important note: If price breaks below ₹3,500 without RSI crossing 75, it might lead to negative RSI divergence — a warning of weakening momentum. In that case, better to exit to avoid capital getting stuck.
⸻
🎯 Targets Based on Fibonacci Extensions:
• Target 1: ₹4,123
• Target 2: ₹4,324
• Target 3: ₹4,580
These targets are calculated using Fibonacci extension levels, with the final one being the 1.618 golden ratio zone.
⸻
Disclaimer: Do your own analysis before putting money in investment. Idea is for education purpose to share and learn within trading view community. Not a suggestion to put your hard earn money.

Option Chain AnalysisTo read an options chart effectively, consider the following steps:
Identify the strike price associated with each line on the chart.
Observe the direction and steepness of the lines to gauge the options' delta values. ...
Assess the options' positions concerning the current market price of the underlying asset.

Basic to Advance in Trading Understand market trends and patterns.
Use risk management strategies, like setting stop-loss orders.
Focus on liquid assets with high volume.
Keep emotions in check and stick to a trading plan.
Limit the number of trades to manage risk.
Constantly educate yourself on market dynamics and trading strategies.

Class for Advanced Trader part 2To understand how to become a trader, follow these seven steps:
Complete your education. ...
Learning the basics of trading. ...
Determine the product in which you want to trade. ...
Develop trading techniques. ...
Gain trading experience. ...
Understand risk management. ...
Review your trades.

Class for Advanced Trader Advanced trading strategies usually involve multiple technical indicators and more complicated instruments, such as options and futures.

Put Call Ratio (PCR) Trading The Put Call Ratio (PCR) is a tool in the stock market to understand how investors feel about a stock or the market's future. It compares the number of put options to call options traded. More puts traded mean investors expect prices to fall (bearish). More calls traded mean investors expect prices to rise (bullish).

Divergence Test Divergence is when the asset price moves in the direction opposite to what a technical indicator indicates. When a stock is diverging, it signals weaker price trends and the beginning of a reversal.

Price Action Trading Price action trading is based on analyzing the raw movement of price over time without relying heavily on indicators. It involves picking out key levels, reviewing candlestick patterns, and recognizing reversal and continuation setups to capitalize on market opportunities.

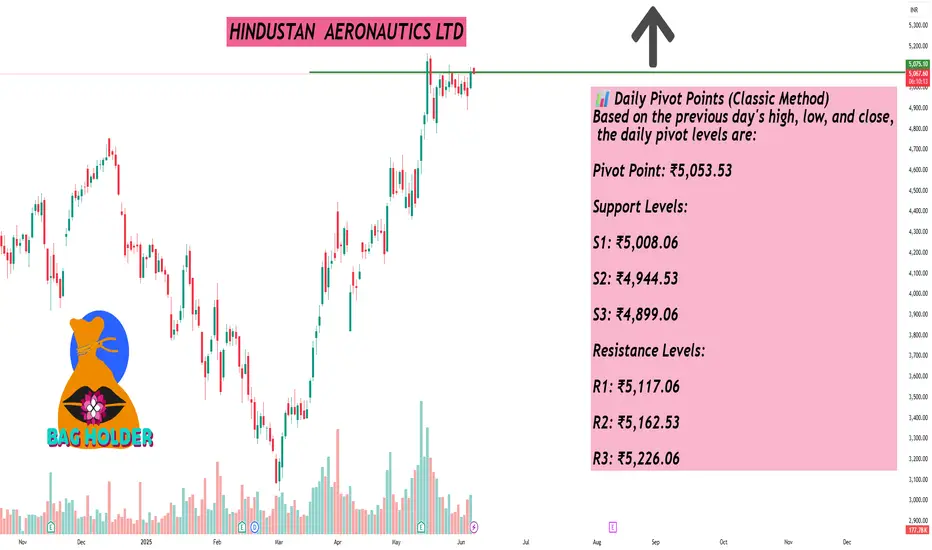
HINDUSTAN AERONAUTICS LTDAs of June 6, 2025, Hindustan Aeronautics Ltd. (NSE: HAL) is trading at approximately ₹5,071.60, reflecting a 2.25% increase over the previous day. Here's a detailed technical analysis focusing on daily support and resistance levels:
📊 Daily Pivot Points (Classic Method)
Based on the previous day's high, low, and close, the daily pivot levels are:
Pivot Point: ₹5,053.53
Support Levels:
S1: ₹5,008.06
S2: ₹4,944.53
S3: ₹4,899.06
Resistance Levels:
R1: ₹5,117.06
R2: ₹5,162.53
R3: ₹5,226.06
📈 Fibonacci Pivot Points
Using Fibonacci calculations, the levels are:
Pivot Point: ₹5,053.53
Support Levels:
S1: ₹5,011.90
S2: ₹4,986.17
S3: ₹4,944.53
Resistance Levels:
R1: ₹5,095.17
R2: ₹5,120.90
R3: ₹5,162.53
🔍 Camarilla Pivot Points
Derived using the Camarilla method:
Pivot Point: ₹5,053.53
Support Levels:
S1: ₹5,061.61
S2: ₹5,051.62
S3: ₹5,041.63
Resistance Levels:
R1: ₹5,081.59
R2: ₹5,091.58
R3: ₹5,101.58
📌 Trading Insights
Immediate Support: ₹5,008.06 (Classic S1)
Immediate Resistance: ₹5,117.06 (Classic R1)
Given the current price of ₹5,071.60, the stock is trading near its pivot point, suggesting potential for upward movement if it breaks above the immediate resistance. However, traders should monitor for any signs of reversal or consolidation around these levels.
L&T FINANCE LTDAs of June 6, 2025, L&T Finance Ltd. (NSE: LTF) is trading at approximately ₹180.82. Here's a detailed technical analysis focusing on daily support and resistance levels:
📊 Daily Pivot Points (Classic Method)
Calculated based on the previous day's high, low, and close prices:
Pivot Point: ₹180.82
Support Levels:
S1: ₹177.34
S2: ₹171.32
S3: ₹167.84
Resistance Levels:
R1: ₹186.84
R2: ₹190.32
R3: ₹196.34
📈 Fibonacci Pivot Points
Based on Fibonacci calculations:\
Pivot Point: ₹180.82
Support Levels:
S1: ₹177.19
S2: ₹174.95
S3: ₹171.32
Resistance Levels:
R1: ₹184.45
R2: ₹186.69
R3: ₹190.32
🔍 Camarilla Pivot Points
These levels are derived using the Camarilla method:
Pivot Point: ₹180.82
Support Levels:
S1: ₹182.49
S2: ₹181.62
S3: ₹180.75
Resistance Levels:
R1: ₹184.23
R2: ₹185.10
R3: ₹185.97
📌 Trading Insights
Immediate Support: ₹177.34 (Classic S1)
Immediate Resistance: ₹186.84 (Classic R1)
Traders may consider these levels for setting stop-loss and take-profit orders. A break above ₹186.84 could signal bullish momentum, while a drop below ₹177.34 might indicate bearish pressure.

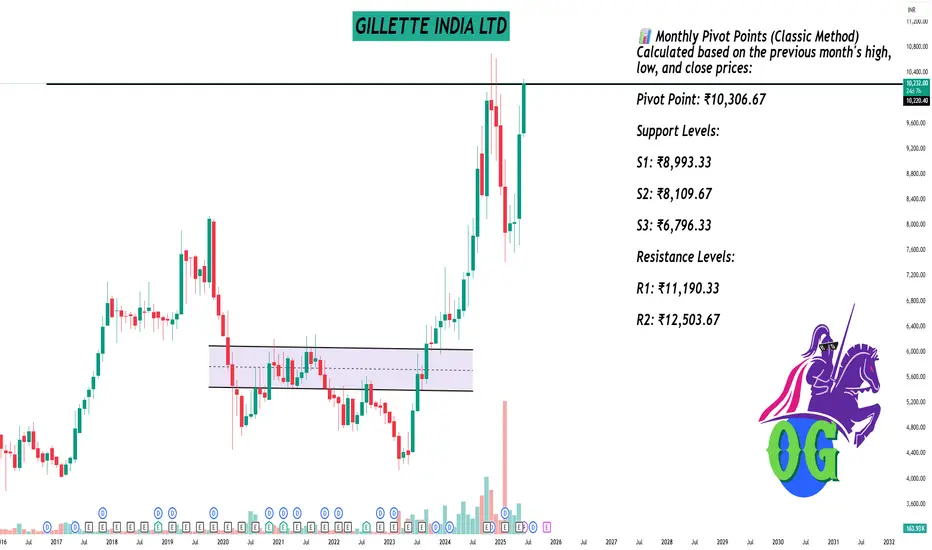
GILLETTE INDIA LTDAs of June 6, 2025, Gillette India Ltd. (NSE: GILLETTE) is trading at approximately ₹10,232.00, marking a 27.45% increase over the past month.
📊 Monthly Pivot Points (Classic Method)
Calculated based on the previous month's high, low, and close prices:
Pivot Point: ₹10,306.67
Support Levels:
S1: ₹8,993.33
S2: ₹8,109.67
S3: ₹6,796.33
Resistance Levels:
R1: ₹11,190.33
R2: ₹12,503.67
🔍 Fibonacci Pivot Points
Based on Fibonacci calculations:
Pivot Point: ₹10,306.67
Support Levels:
S1: ₹9,832.59
S2: ₹8,154.08
S3: ₹6,796.33
Resistance Levels:
R1: ₹10,351.08
R2: ₹11,190.33
📈 Technical Indicators Summary
Moving Averages: All major moving averages (MA5, MA10, MA20, MA50, MA100, MA200) are indicating a Strong Buy signal.
Relative Strength Index (RSI): 81.19 – Overbought
MACD: 194.05 – Buy
ADX: 96.24 – Overbought
Stochastic Oscillator: 82.92 – Overbought
📌 Trading Insights
Immediate Resistance: ₹11,190.33 (Classic R1)
Immediate Support: ₹8,993.33 (Classic S1)
Given the current price of ₹10,232.00, the stock is trading near its pivot point, suggesting potential for upward movement if it breaks above the immediate resistance. However, the overbought RSI and ADX indicators suggest caution, as the stock may be due for a short-term correction.
KPI GREEN ENERGY LTDAs of June 6, 2025, KPI Green Energy Ltd. (NSE: KPIGREEN) is trading at approximately ₹503.45, reflecting a 4.88% increase over the previous day.
📊 Daily Pivot Points (Classic Method)
Based on the previous day's high, low, and close, the daily pivot levels are:
Pivot Point: ₹497.23
Support Levels:
S1: ₹488.32
S2: ₹471.08
S3: ₹462.17
Resistance Levels:
R1: ₹514.47
R2: ₹523.38
R3: ₹540.62
📈 Fibonacci Pivot Points
Using Fibonacci calculations, the levels are:
Pivot Point: ₹497.23
Support Levels:
S1: ₹487.24
S2: ₹481.07
S3: ₹471.08
Resistance Levels:
R1: ₹507.22
R2: ₹513.39
R3: ₹523.38
🔍 Camarilla Pivot Points
Derived using the Camarilla method:
Pivot Point: ₹497.23
Support Levels:
S1: ₹503.15
S2: ₹500.76
S3: ₹498.36
Resistance Levels:
R1: ₹507.95
R2: ₹510.34
R3: ₹512.74
📌 Trading Insights
Immediate Support: ₹488.32 (Classic S1)
Immediate Resistance: ₹514.47 (Classic R1)
Traders may consider these levels for setting stop-loss and take-profit orders. A break above ₹514.47 could signal bullish momentum, while a drop below ₹488.32 might indicate bearish pressure.

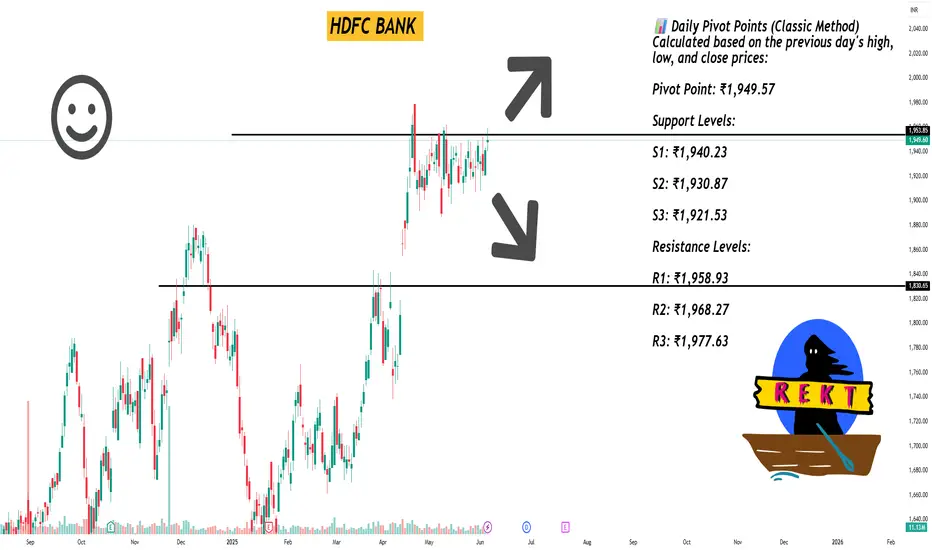
HDFC BANK As of June 6, 2025, HDFC Bank Ltd. (NSE: HDFCBANK) is trading at approximately ₹1,944.90. Here's a detailed technical analysis focusing on daily support and resistance levels:
📊 Daily Pivot Points (Classic Method)
Calculated based on the previous day's high, low, and close prices:
Pivot Point: ₹1,949.57
Support Levels:
S1: ₹1,940.23
S2: ₹1,930.87
S3: ₹1,921.53
Resistance Levels:
R1: ₹1,958.93
R2: ₹1,968.27
R3: ₹1,977.63
Source: Top Stock Research
📈 Fibonacci Support & Resistance Levels
Based on Fibonacci calculations:
Support Levels:
S1: ₹1,942.42
S2: ₹1,938.01
S3: ₹1,930.87
Resistance Levels:
R1: ₹1,956.71
R2: ₹1,961.12
R3: ₹1,968.27
🔍 Camarilla Pivot Points
These levels are derived using the Camarilla method:
Support Levels:
S1: ₹1,947.89
S2: ₹1,946.17
S3: ₹1,944.46
Resistance Levels:
R1: ₹1,951.31
R2: ₹1,953.03
R3: ₹1,954.74
📌 Trading Insights
Immediate Support: ₹1,940.23 (Classic S1)
Immediate Resistance: ₹1,958.93 (Classic R1)
Traders may consider these levels for setting stop-loss and take-profit orders. A break above ₹1,958.93 could signal bullish momentum, while a drop below ₹1,940.23 might indicate bearish pressure.
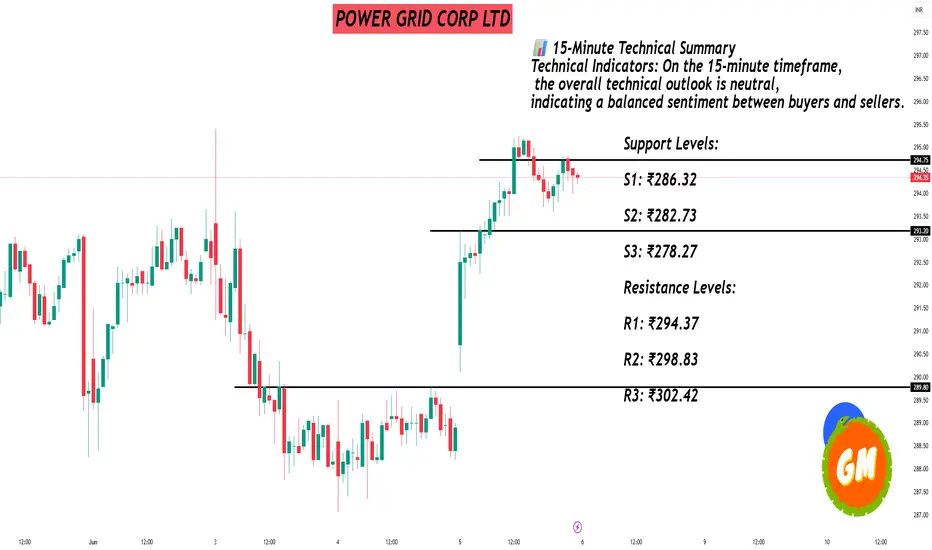
POWER GRID CORP LTDAs of June 6, 2025, Power Grid Corporation of India Ltd. (NSE: POWERGRID) is trading at approximately ₹294.25. Here's a detailed technical analysis focusing on 15-minute support and resistance levels, along with broader daily pivot points:
📊 15-Minute Technical Summary
Technical Indicators: On the 15-minute timeframe, the overall technical outlook is neutral, indicating a balanced sentiment between buyers and sellers.
🔧 Daily Pivot Points (Classic Method)
These levels are calculated based on the previous day's high, low, and close prices:
Pivot Point: ₹290.78
Support Levels:
S1: ₹286.32
S2: ₹282.73
S3: ₹278.27
Resistance Levels:
R1: ₹294.37
R2: ₹298.83
R3: ₹302.42
📈 Fibonacci Support & Resistance Levels
Based on Fibonacci calculations:
Support Levels:
S1: ₹291.23
S2: ₹290.02
S3: ₹288.05
Resistance Levels:
R1: ₹295.17
R2: ₹296.38
R3: ₹298.35
📌 Trading Insights
Current Price: ₹294.25
Immediate Resistance: ₹295.17 (Fibonacci R1)
Immediate Support: ₹291.23 (Fibonacci S1)
Traders may consider these levels for setting stop-loss and take-profit orders. A break above ₹295.17 could signal bullish momentum, while a drop below ₹291.23 might indicate bearish pressure.
Overview of Financial Markets Financial markets are platforms where buyers and sellers trade financial assets like stocks, bonds, currencies, and derivatives. They facilitate the movement of capital between savers and borrowers, enabling investment, risk management, and capital formation. These markets play a crucial role in the global economy by providing a mechanism for allocating funds and determining prices.

Divergence Based Trading Divergence occurs when an asset's price and a technical indicator move in opposite directions, indicating a possible change in trend momentum. Traders use bullish or bearish divergence to anticipate reversals.

Intraday Trading Class part 7Purchasing and selling securities listed in a stock exchange on the same day is known as intraday trading. The primary purpose of transacting in this method is to realise capital gains on purchased securities as well as minimise risks by keeping money invested for an extended period.

MACD( Moving Average Convergence Divergence)MACD, short for Moving Average Convergence Divergence, is a technical indicator used in finance to analyze the momentum and trend direction of an asset's price. It's a popular tool for identifying potential buy and sell signals.

More About RSI RSI is a tool that aids traders in capturing market momentum by measuring the fluctuation in prices. Traders rely on RSI to spot oversold and overbought markets and determine the right time to enter a trade. RSI helps traders identify whether a stock is either overbought or oversold.

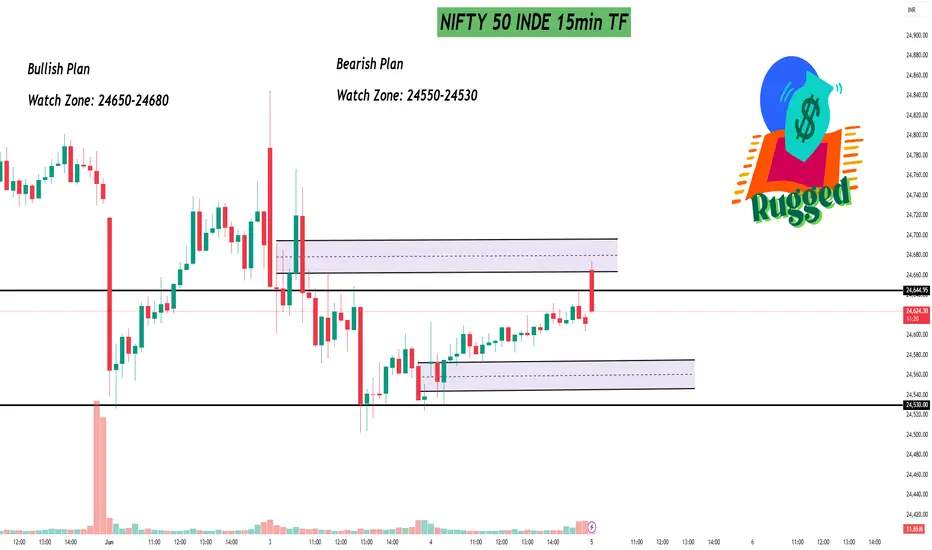
NIFTY 50 INDE 15min TF✦ Expiry Day Market Plan - Inside Candle Setup
Today is an Inside Candle Day - price stuck within the previous day's range. This means:
Sideways movement likely
But if key levels break - high volatility possible!
Bullish Plan
Watch Zone: 24650-24680
Condition: 15-min candle close above 24680 with strong volume
* Action:
→ Enter on breakout
→ Or wait for pullback (retest) & enter on bounce
Targets: Big upside possible - trail SL to lock profits
Bearish Plan
Watch Zone: 24550-24530
Condition: Break & hold below 24550
* Action:
→ Enter on breakdown
→ Book first 50 pts, then trail SL
Targets: Quick downside moves possible
? Key Tips
Don't rush - wait for confirmation
Use volume + candle close as triggers
Stick to trailing SL & partial booking