MACD Analysis Part-2Moving average convergence/divergence (MACD) is a technical indicator to help investors identify price trends, measure trend momentum, and identify entry points for buying or selling. Moving average convergence/divergence (MACD) is a trend-following momentum indicator that shows the relationship between two exponential moving averages (EMAs) of a security’s price. MACD was developed in the 1970s by Gerald Appel, and is one of the most popular technical tools, readily available on most trading platforms offered by online stock brokers.
Technical

RSI and RSI Divergence Part 2RSI (Relative Strength Index) is a momentum indicator that measures recent price changes to assess if an asset is overbought or oversold. RSI divergence occurs when the price of an asset and its RSI move in opposite directions, potentially indicating a trend reversal or weakening trend. There are two main types: bullish divergence (price makes lower lows while RSI makes higher lows) and bearish divergence (price makes higher highs while RSI makes lower highs).

MACD(Moving Average Convergence Divergence) ExplainThe Moving Average Convergence Divergence (MACD) is a popular momentum indicator in technical analysis, created by Gerald Appel in the late 1970s. It helps identify trends and reversals by calculating the difference between two moving averages, typically based on historical closing prices.

Advanced Divergence Trading AnalysisA positive divergence means price is making lower lows while an indicator/oscillator is making higher highs. On the other hand, a negative divergence happens when price is making higher highs while an indicator/oscillator is forming lower lows.

Database Trading**Database trading** refers to the process of buying and selling databases or data-related products, often for financial or commercial purposes. This could involve trading large datasets, data assets, or even the rights to access and use specific data. In financial contexts, it could also refer to trading information or algorithms derived from data for making investment decisions. Here's a breakdown of how database trading works and its typical applications

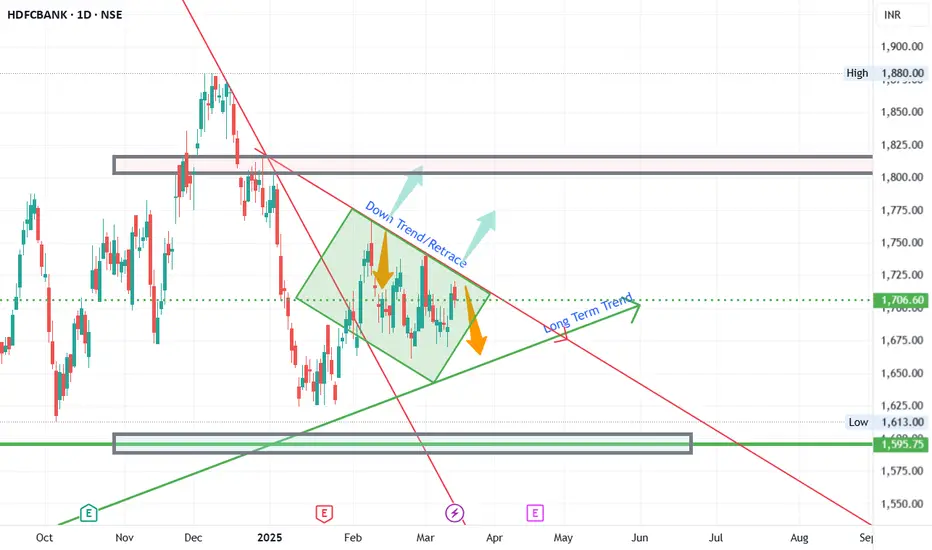
HDFC Bank - Long Term AnalysisFundamentals/Basis:
HDFC Bank is an important scrip that need to be monitored on long term basis, if we invest or not.
This is due to the fact, as a leader in the banking industry and a heavy weight company in the Nifty and bank nifty constituencies, HDFC bank provides clues to the overall market direction (most of the times)
This analysis is for Long term and if time permits, will keep updating throughout the year.
Technicals :
HDFC bank fell from its highs since end of 24 until jan. And had a retracement until approximately 1770 and formed a retracement trend direction.
Current range : 1600 to 1800 with 1700s as pivots.(Not formula but based on charts)
Trade Ideas :
If the price moves above the retracement line and sustains, go for long in the stock. Once it breaks lookout for confirmation at this trendline and also at the Long term trendlines for any retests.
Alternatively, if the price falls below the Long term trend direction, wait for confirmation on the bullishness.
Disclaimer : All the views and analysis provided are my personal analysis. Not a SEBI registered analyst. Plan and trade as per your analysis
If you Like the Analysis and agree with , Hit the Boost button and share your views agreements/constructive feedback in the comments.
Would you like me provide any of your favorite stocks analysis, let me know in the comment.
XAU/USD 1H – Bullish Continuation from Demand Zone?📊 XAU/USD (Gold) 1H Analysis – Bullish Continuation Setup
🔹 Market Structure: Gold has been in a strong uptrend, with price currently consolidating near a key demand zone.
🔹 Key Levels:
🔴 Resistance: $3,050 - $3,060 (Potential target)
🟣 Demand Zone: $3,030 - $3,035 (Support area)
🟠 Deeper Support: $3,025 (Break below weakens bullish bias)
📈 Potential Trade Setup:
1️⃣ A possible pullback into the demand zone could attract buyers.
2️⃣ Price may wick below liquidity before reversing.
3️⃣ If support holds, we anticipate a move toward $3,050+.
✅ Entry Zone: $3,030 - $3,035
🎯 Target: $3,050 - $3,060
🚨 Stop Loss: Below $3,025
⚠️ Watch for price action confirmation before entering. A strong bullish candle from support could signal entry. Let the market show its hand! 🚀✨

BTCUSD 8H: Trendline Pressure and Key Support Test🔥 BTCUSD 8H Deep Dive
1️⃣ Trendline Pressure: Bears controlling the market with a strong descending trendline.
2️⃣ Support Zone Strength: $77,500-$80,000 is a key demand area. Previous bounce shows buyers stepping in.
3️⃣ Liquidity Hunt? Price might sweep the support zone before reversal.
4️⃣ Volume Check Needed: Low volume = fakeout risk. High volume = potential breakout.
🎯 Targets
Bullish Breakout: $85,000-$87,500
Bearish Breakdown: $77,500-$75,000
📍 Eyes on next 8H close.

GOLD IN A WAIT-AND-SEE MODE – IS A BIG BREAKOUT COMING?📌 Market Overview
Gold is showing weak momentum at the start of the new trading week after a sharp decline from last week's high. This suggests that investors are still waiting for clearer signals before committing to a direction within the current price channel.
This week, market participants will closely watch the Federal Reserve’s FOMC meeting, where key decisions regarding interest rate policies will be made based on last week’s inflation reports.
Meanwhile, geopolitical tensions are rising after Trump’s recent airstrikes on Iran-backed Houthi forces. However, despite this significant event, gold has yet to show a strong bullish reaction. This raises the need for further confirmation before defining the next major trend.
📊 Key Levels to Watch
🔹 Support Levels: 2982 - 2976 - 2966 - 2948
🔹 Resistance Levels: 2994 - 3004 - 3015 - 3034
🎯 Trade Setups for Today
🟢 BUY ZONE: 2975 - 2973
📍 SL: 2970
🎯 TP: 2980 - 2984 - 2988 - 2992 - 2998
🔴 SELL ZONE: 3033 - 3035
📍 SL: 3038
🎯 TP: 3030 - 3025 - 3020 - 3016 - 3010
⚠ Caution Ahead! Possible Breakout Incoming!
Gold has been trading within a narrow range since last week, and a strong breakout is highly likely during the late Asian or early European session. Traders should be prepared for high volatility and ensure proper risk management. Stick to TP/SL levels to protect your capital!
📢 What’s your outlook on Gold this week? Will it break higher or continue its correction? Drop your thoughts below! 🚀🔥

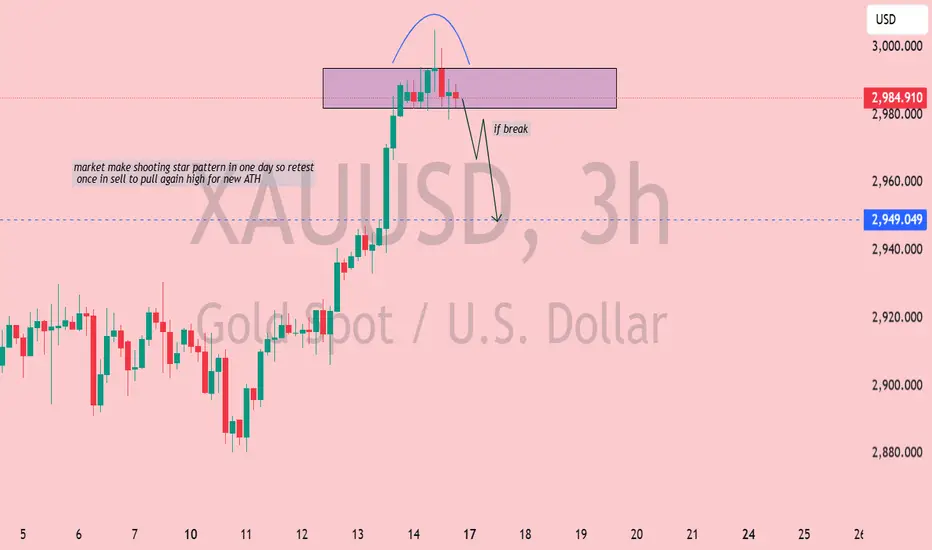
XAUUSD Analysis: Bearish Reversal with Potential for Liquidity📉 XAUUSD (Gold Spot vs USD) Analysis - 3H Chart
🌟 Shooting Star Pattern Detected: The market has formed a shooting star, a bearish reversal candlestick, signaling potential weakness at the top.
📍 Key Resistance Zone (Purple Box): Price action has been rejected from this area, showing strong selling pressure.
🔍 If Break Scenario: Should the price break below the 2,949 support zone (🔵), we can expect a bearish drop 📉 with potential liquidity grab before a pullback for a new all-time high (ATH) 🚀.
🧐 Market Sentiment: Bearish bias for now, but watch for a potential reversal after liquidity is swept.
✅ Trader's Tip: Wait for a clean break and retest before entering a short position. 🎯
XAU/USD Bullish Outlook: Wyckoff Accumulation & Breakout PotentXAU/USD (Gold) - 2H Chart Analysis 🏆📈
🔹 Wyckoff Structure Insight
The chart shows signs of a Wyckoff Accumulation phase.
UTAD (Upthrust After Distribution) at the previous highs suggests a liquidity grab.
Test of the resistance level before a strong rejection downward.
SOW (Sign of Weakness) was observed, but buyers regained control.
🔹 Key Technical Levels
Fair Value Range marked below, showing a potential area of demand.
Unfilled Imbalance (EMB unfilled) signals an area where price might revisit before continuing upward.
Gap below indicates a previous liquidity sweep before the bullish reversal.
🔹 Trend & Price Action
Current price action is showing higher lows and bullish structure development.
Projected bullish move 📈 is expected to test the $2,940+ region.
🔹 Trading Bias: Bullish ✅
A retracement to the EMA or minor pullback could offer re-entry opportunities.
Invalidation level: Below $2,900, where momentum could shift bearish.
🚀 Gold remains strong; watch for breakouts above $2,940!

Bitcoin (BTCUSD) Rejection – Bearish Move Incoming?📉 Key Observations:
Resistance Zone (Purple Box): Price has tested this area and faced rejection.
Bearish Projection (Gray Box & Arrow): The chart anticipates a drop towards the $76,800 - $77,000 range.
Liquidity Grab? Price might consolidate before a sharp decline.
⚠️ Possible Scenarios:
Rejection Confirmation 🔻: If BTC fails to reclaim $84,470, selling pressure could increase.
Breakout Fakeout? 🤔: A deviation above resistance followed by a dump remains a risk.
🎯 Levels to Watch:
Resistance: $84,470 - $85,078
Support: $80,000 and $76,825
🔥 Final Take: If BTC struggles below resistance, a short setup could play out. Confirmation is key!

XAG/USD (Silver) 4H Chart Analysis – Bearish Setup📉 XAG/USD (Silver) 4H Chart Analysis – Bearish Setup 🚨
🔍 Key Observations:
Supply Zone (POI - Point of Interest) 🟪: The price is approaching a strong resistance area around $33.23 - $33.50.
Liquidity Grab (LQ) & Rejection Expected ❌: The previous major liquidity zone (LQ) suggests a possible fake breakout or rejection.
Bearish Projection ⬇️: The chart outlines a potential reversal after reaching resistance, leading to a drop towards $31.00 - $30.50.
📌 Trading Plan:
Short Entry 🎯: Around $33.20 - $33.50 (if price rejects this area).
Target 🎯: Major demand zone at $31.00.
Stop Loss 🚨: Above $33.60 (to avoid fakeouts).
Confirmation Needed 📊: Look for bearish candlestick patterns (e.g., engulfing, wicks, or double top formations).
⚠️ Final Thoughts:
Bearish Bias ⚠️ unless price breaks and holds above $33.50.
Monitor market conditions 🧐—news and fundamentals could shift momentum.
🔥 Trade smart! What do you think?

BTC/USD Breakdown! Bearish Target: $78K🔍 BTC/USD 30-Minute Chart Analysis
📉 Market Structure:
The chart displays an ABCDE corrective pattern, likely a descending wedge or contracting triangle, which has now broken to the downside.
Price action shows a breakout below the wedge, leading to further bearish momentum.
The 200-period moving average (red line) is acting as resistance, reinforcing the downward trend.
📊 Current Price: ~$83,057
🔻 Bearish Target: $78,049 (marked as the potential support level)
🛑 Key Observations:
Rejection from wave E indicates a lack of bullish strength.
Lower highs and lower lows confirm a continuation of the bearish trend.
Potential retest of ~$85,000 before dropping further.
🚀 Trading Insights:
Bearish Bias: Short opportunities on pullbacks toward resistance.
Bullish Reversal? Look for price action near $78,049—if buyers step in, a potential bounce could occur.
⚠️ Watch out for:
Sudden Bitcoin volatility (news-driven moves).
A fake breakdown (if buyers reclaim above ~$85,000).

U.S. Dollar Index (DXY) – Key Technical Levels & Market OutlookU.S. Dollar Index (DXY) Monthly Chart Analysis 📊💵
The U.S. Dollar Index (DXY) is currently navigating a critical price structure, with key supply and demand zones influencing market direction. Here’s a professional breakdown of the chart’s technical outlook:
📍 Key Technical Insights
✅ Supply & Demand Zones
Supply Zone (Resistance): 109 - 114 📈 – A key area where selling pressure has historically emerged. A decisive breakout above this level could signal further upside potential.
Demand Zone (Support): 100 - 103 📉 – A strong accumulation zone where buyers have stepped in previously. A breakdown below could indicate a shift in market sentiment.
✅ Market Structure & Momentum
A Break of Structure (BOSS) has been identified, signaling a shift in trend dynamics.
The market is currently ranging between major resistance (~109) and support (~100).
✅ 200-Month Moving Average 📊
The long-term moving average (red line) is acting as dynamic support, reinforcing the bullish bias unless decisively breached.
📊 Potential Scenarios
🔹 Bullish Outlook: If DXY maintains support above 100-103 and breaks past 109, the index could aim for 114+ in the coming months. 🚀
🔹 Bearish Risk: A sustained drop below 100 may open the door for further downside towards 95-89, signaling a broader correction. ⚠️
📌 Conclusion
The DXY remains in a consolidation phase, with key inflection points around 103 (support) and 109 (resistance). A breakout or breakdown from this range will determine the next major trend. Traders should monitor these levels closely for potential trading opportunities.

XAUUSD 4H Analysis: Rejection at Resistance – Drop to $2,850?📉 XAUUSD (Gold) 4H Analysis – March 5, 2025
Key Levels:
Resistance: Around $2,920 - $2,940 (price is testing this zone)
Support: Around $2,850 - $2,860 (marked as a demand zone)
Market Structure & Projection:
Gold is currently at a resistance level, which has previously acted as a strong supply zone.
The price is showing signs of rejection at resistance, indicating a potential bearish move.
The chart suggests a drop towards the $2,850 support level if price fails to break above resistance.
Indicators & Confluence:
200 EMA (Red Line): Located below the price, showing an overall bullish trend, but short-term correction is possible.
Bearish Structure: The recent push to resistance followed by rejection hints at a potential sell-off.
Liquidity Grab? If price briefly spikes above resistance and then reverses, a deeper drop could be confirmed.
Trading Bias & Strategy:
📉 Bearish Scenario: If rejection at resistance holds, price could head towards $2,850 support.
📈 Bullish Breakout?: If price breaks & closes above resistance with strong volume, upside continuation could be possible.
⚠ Watch for price action at resistance before taking trades. A breakout or rejection confirmation is key.
🔥 What’s Your Take? Bullish or Bearish? Let me know! 🚀📊

XAU/USD Weekly Outlook: Potential Pullback or Breakout?XAU/USD Weekly Chart Analysis 🏆📉📈
1️⃣ Current Price: $2,919.35
2️⃣ Key Observations:
Distribution on H4: Potential sign of a short-term reversal. 📉
Divergence: Suggests weakening momentum at the highs, increasing the probability of a pullback. ⚠️
Multiple Unfilled Mitigation Blocks (MB): Areas of interest where price may retrace for liquidity grabs. 🧐
Fair Volume Ranges: Notable levels around $2,700 - $2,500, where price might stabilize if a correction occurs. 🔄 3️⃣ Potential Scenarios:
If price breaks down from the H4 distribution, expect a retracement toward the nearest MB unfilled levels (~$2,700).
If bulls hold momentum, breaking above current resistance (~$3,000) could push prices into price discovery. 🚀
💡 Conclusion: Watch for price action around the unfilled MBs and fair volume ranges. A correction seems likely unless buyers step in aggressively.
🔥 Trade Wisely & Manage Risk! 🔥

GBP/JPY Bearish Breakdown – Further Decline Ahead?📉 GBP/JPY Daily Chart Analysis
🔍 Overview:
The chart shows GBP/JPY on the 1D timeframe.
A bearish outlook is suggested with a projected price decline.
The 200 EMA (193.295) is acting as resistance.
Current price: 191.906, slightly below the 200 EMA.
📊 Technical Breakdown:
Bearish Pattern Formation:
Price broke down from a rising wedge (bearish pattern).
After a brief retest, it's rejecting the 200 EMA, confirming weakness.
Support & Resistance Levels:
Resistance: 193.295 (200 EMA).
Support zones: 188.000, followed by 184.000.
Expected Price Action:
The bearish projection suggests further decline towards 188.000 & 184.000.
If price reclaims 193.295, it could invalidate the bearish scenario.
🎯 Conclusion:
⚠️ Bearish bias as long as the price stays below the 200 EMA. A drop to 188-184 seems likely unless buyers reclaim key levels.
📌 Watchlist:
✅ Break below 190.000 = Strong sell signal
✅ Reclaim of 193.295 = Bullish invalidation
🚨 Trade cautiously & manage risk! 🚨

NZD/JPY Bearish Breakdown | More Downside Ahead?📉 NZD/JPY Technical Analysis (Daily Chart)
Key Observations:
Downtrend Dominance ⬇️: The pair has been in a clear downtrend since mid-2024, with lower highs and lower lows forming consistently.
200 EMA Resistance 🚨: The red 200-day EMA at 90.088 is acting as a major resistance level, reinforcing the bearish outlook.
Bearish Breakout Pattern ⚠️: A descending structure is forming, suggesting a continuation of the downtrend.
Projected Drop 📉: The black arrow on the chart indicates a potential drop toward 82.00 - 80.00 levels in the coming weeks.
Trading Strategy:
🔴 Bearish Bias: Traders might look for short opportunities on lower highs, especially near 87.00 - 88.00 resistance.
✅ Target Zones: 84.00 (first support) and 80.00 (major support).
🚨 Invalidation Level: A break above 90.00 (above 200 EMA) could signal trend reversal.
What’s your trade plan? 🎯📊

BTC/USDT 4H Analysis: Bearish Breakdown or Rebound?📉 Bitcoin (BTC/USDT) 4H Chart Analysis
🔴 Overview:
Bitcoin is trading at $101,847 (-0.22%) on the 4-hour timeframe.
The price is moving within a descending wedge/pennant pattern.
Key EMA (200): Currently at $100,781, acting as dynamic support.
📌 Key Levels & Analysis:
Resistance Zone (~$102,000 - $103,000): Price is struggling to break above this level.
Support Zone (~$97,500 - $98,500): A key demand zone where buyers may step in.
⚠️ Potential Scenarios:
Bearish Breakdown ⬇️
If BTC loses the $100,800 EMA support, a drop towards $98,000-$97,500 is likely.
The marked arrow suggests this bearish move.
Bullish Rebound ⬆️
If BTC holds above EMA 200 and reclaims $102,000, a breakout towards $104,000-$106,000 could follow.
🧐 Final Thoughts:
Short-term trend: Bearish bias unless price reclaims resistance.
Watch for a break below $100,800 for further downside.
RSI & Volume Confirmation Needed for stronger signals.

Ethereum (ETH/USDT) at Critical Support – Breakout or Breakdown?📉 Ethereum (ETH/USDT) 4H Chart Analysis
🔴 Current Price: $3,220.06 (-0.95%)
📊 Indicators & Patterns:
Downtrend Resistance: A descending trendline is acting as resistance.
Support Zone: The red highlighted area (~$3,220) is a key support level.
200 EMA: At $3,320, acting as resistance.
🔮 Possible Scenarios
1️⃣ Bullish Case 🚀: If ETH holds the support and breaks the descending trendline ($3,320), it could test higher levels around $3,400 - $3,500.
2️⃣ Bearish Case 📉: A breakdown below the support ($3,220) could trigger a fall towards $3,100 or even $3,000.
🎯 Key Levels to Watch
Resistance: $3,320 (EMA 200), $3,400 (Trendline)
Support: $3,220 (Zone), $3,100 (Next Major Support)
⏳ Conclusion
ETH is at a critical decision point. A bounce could lead to a breakout, but failure to hold could trigger more downside. Watch for a reaction around $3,220! 🚦

S&P 500 at Critical Resistance – Breakout or Rejection? Resistance Zone (Highlighted in Red) 🛑
The price is currently testing a strong resistance level near 6,040 - 6,100.
Previous attempts to break this zone have failed, making it a key area to watch.
Ascending Triangle Pattern 📈
The price is forming higher lows, indicating bullish momentum.
If a breakout above 6,100 occurs, it could trigger a strong upward move 🚀.
200 EMA Support (Red Line) 📉
The 200-day EMA is at 5,658.98, providing a long-term support level.
If the price pulls back, this could act as a buying opportunity.
Possible Scenarios 🔮
✅ Bullish Breakout: A breakout above 6,100 could send the price toward 6,200+.
❌ Rejection & Pullback: If rejected, a drop to 5,900 or 5,700 (EMA support) is possible.
Conclusion: Bulls need a clear breakout to push higher, while bears might take control if the resistance holds. 📊🚦 Keep an eye on volume and confirmation candles for the next move!

XAU/USD 4H Analysis: Bullish Momentum Towards $2,780📊 XAU/USD 4H Chart Analysis – Bullish Momentum 🚀💰
📌 Key Observations:
🔹 Current Price: $2,754.16 (+0.19%)
🔹 Support Zone: $2,740 - $2,750 (Previous resistance turned support ✅)
🔹 Resistance Zone: $2,780 (Next potential target 🎯)
🔹 200 EMA: $2,687.43 (Price is above = Bullish signal 📈)
🔹 Breakout Confirmation: Price has broken past a key level and might retest before moving higher 🔄📊
📉 Potential Scenarios:
✅ Bullish Case: If price holds above $2,750, we could see a rally towards $2,780+ 🚀
❌ Bearish Case: If price drops below $2,740, we might see a correction back to $2,720 ⚠️
🔥 Conclusion:
Gold is showing strong bullish momentum and may continue its uptrend towards $2,780+ if it sustains above the breakout level! Keep an eye on support at $2,750 for confirmation. 👀💎
Tell me in Comments Would you like further indicators or a different timeframe analysis? ⏳📊
