S&P 500 at Critical Resistance – Breakout or Rejection? Resistance Zone (Highlighted in Red) 🛑
The price is currently testing a strong resistance level near 6,040 - 6,100.
Previous attempts to break this zone have failed, making it a key area to watch.
Ascending Triangle Pattern 📈
The price is forming higher lows, indicating bullish momentum.
If a breakout above 6,100 occurs, it could trigger a strong upward move 🚀.
200 EMA Support (Red Line) 📉
The 200-day EMA is at 5,658.98, providing a long-term support level.
If the price pulls back, this could act as a buying opportunity.
Possible Scenarios 🔮
✅ Bullish Breakout: A breakout above 6,100 could send the price toward 6,200+.
❌ Rejection & Pullback: If rejected, a drop to 5,900 or 5,700 (EMA support) is possible.
Conclusion: Bulls need a clear breakout to push higher, while bears might take control if the resistance holds. 📊🚦 Keep an eye on volume and confirmation candles for the next move!
Technical

XAU/USD 4H Analysis: Bullish Momentum Towards $2,780📊 XAU/USD 4H Chart Analysis – Bullish Momentum 🚀💰
📌 Key Observations:
🔹 Current Price: $2,754.16 (+0.19%)
🔹 Support Zone: $2,740 - $2,750 (Previous resistance turned support ✅)
🔹 Resistance Zone: $2,780 (Next potential target 🎯)
🔹 200 EMA: $2,687.43 (Price is above = Bullish signal 📈)
🔹 Breakout Confirmation: Price has broken past a key level and might retest before moving higher 🔄📊
📉 Potential Scenarios:
✅ Bullish Case: If price holds above $2,750, we could see a rally towards $2,780+ 🚀
❌ Bearish Case: If price drops below $2,740, we might see a correction back to $2,720 ⚠️
🔥 Conclusion:
Gold is showing strong bullish momentum and may continue its uptrend towards $2,780+ if it sustains above the breakout level! Keep an eye on support at $2,750 for confirmation. 👀💎
Tell me in Comments Would you like further indicators or a different timeframe analysis? ⏳📊

Bitcoin (BTC/USDT) Symmetrical Triangle Analysis: Next Move?Bitcoin (BTC/USDT) 4H Chart Analysis
Key Observations:
1. Symmetrical Triangle Pattern:
The chart shows a symmetrical triangle formation, characterized by converging trendlines.
This pattern typically signals a breakout, but the direction (up or down) depends on market momentum.
2. Current Price Action:
BTC is trading around $102,979.98 at the time of the chart.
It is above the 200 EMA ($100,003.64), indicating bullish strength.
The price recently bounced off support and is moving towards resistance.
3. Support and Resistance Levels:
Support: Around $97,785.55 (blue line).
Resistance: Around $109,636.60 (blue line).
4. Potential Scenarios:
Bullish Breakout:
If BTC breaks above the upper trendline, it may rally towards $109,636.60 or higher.
A confirmed breakout could push BTC to $112,500+.
Bearish Breakdown:
If BTC rejects at resistance and breaks downward, it could retest the $100,000 level or lower.
A breakdown could target $97,785.55 or even $95,000.
Final Thoughts:
Watch for a breakout or breakdown from the triangle pattern.
Volume is crucial—a high-volume breakout confirms strength, while low volume can indicate a fakeout.
If BTC stays above $100,000 (200 EMA support), the bullish bias remains intact.

EUR/JPY 4H Chart Analysis – Gap Fill Incoming?EUR/JPY 4H Chart Analysis 🏆📊
🚀 Current Price: 162.308
📍 200 EMA: 162.099 (Dynamic Support)
🔥 Key Levels & Insights:
🟥 Major Support Zone (Red Area - 162.000)
✅ Price recently bounced off this level, showing strong buying pressure.
✅ If price holds above 162.000, a bullish continuation is likely.
📈 Gap Zone (Orange - 163.000 - 163.500)
🔍 There’s a price imbalance above, meaning price could be drawn towards it.
🔼 Gaps act as magnets! A move up to fill the gap is likely.
📊 200 EMA (162.099) - Crucial Level
🚦 Price is hovering above the 200 EMA. If it remains above, we can expect further bullish momentum.
🔮 Price Prediction & Trade Idea
📌 If price breaks and holds above 162.500, expect a 🚀 move towards 163.500.
📌 Rejection from 163.500 could bring a pullback 📉 back to 162.500.
🚨 Risk Alert:
🔻 If price drops below 162.000, bears might take control, pushing it to 161.500 or lower.
💡 Final Thoughts:
👉 Bulls 🐂 need to break 162.500 to push towards 163.500.
👉 Bears 🐻 will gain control if price loses 162.000.
🔥 Verdict:
✅ Bullish Bias if price stays above 162.000.
🚀 Target: 163.500 (Gap Fill).
🔻 Invalidation: Below 162.000.

EUR/GBP Bearish Momentum – Eyes on Support Zone!📊 EUR/GBP Daily Chart Analysis (28th Jan 2025)
🔹 Overview:
Pair: EUR/GBP
Current Price: 0.83855 📉 (-0.10%)
Key Indicators:
200 EMA (Red Line): 0.84129 (Price is below the EMA, indicating bearish sentiment)
Resistance Zone (🟠 Orange Box): ~0.84200 - 0.84400
Support Zone (🟢 Green Box): ~0.83200 - 0.83400
🔻 Bearish Outlook:
Price recently rejected the resistance zone and started declining.
It is now trading below the 200 EMA, suggesting potential further downside.
Next Target: The support zone (~0.83200 - 0.83400) is likely the next major level.
📉 Possible Scenarios:
1️⃣ Bearish Continuation ⬇️
If the price maintains momentum, it may head toward the support zone (~0.83200).
A break below support could trigger further downside.
2️⃣ Bullish Rebound 🔄
If the price finds strong buying interest at support, a rebound toward the resistance (~0.84200) is possible.
A breakout above 200 EMA could shift momentum back to bullish.
🎯 Trading Considerations:
Short Opportunity: Below 0.83800, targeting 0.83400.
Long Opportunity: If support holds around 0.83200, aiming for a move back to resistance.
Breakout Watch: A move above 0.84200 could trigger bullish momentum.
🔥 Conclusion: Currently, the trend is bearish, and price action suggests further downside toward the support zone. Keep an eye on price behavior around 0.83400 for potential reactions.

EUR/CAD Bullish Momentum: Targeting 1.51+ !?📌 Key Observations:
1. Support Rejection ✅: The price has bounced off the support zone (highlighted in red), which was a critical level for a bullish continuation. This level is now acting as a launchpad for further upside.
2. Bullish Momentum 📈: The market structure suggests a strong uptrend, with recent bullish candles breaking through resistance.
3. Next Target 🎯: The green resistance zone at 1.51+ is the main target for buyers. The blue arrow indicates a potential move towards this level.
4. EMA 200 📉 (Red Line @ 1.48721): The price has successfully traded above the 200-day EMA, reinforcing bullish sentiment.
5. RSI (14) at 58.89 📊: The RSI is approaching the 60 level, showing bullish strength, but not yet overbought (above 70), meaning there’s still room for an upward move.
🔎 Potential Scenarios:
If the price breaks 1.51, we could see a further push towards new highs. 🚀
If the price rejects from 1.51, a retracement to 1.50 or lower might happen before another attempt upwards. 🔄
🎯 Conclusion: The market is currently bullish, with a high probability of hitting the next resistance zone. Watch for confirmation near 1.51—a breakout could mean further gains, while rejection could signal a pullback.

Gold (XAU/USD) Approaching Key Resistance Breakout or Rejection?1. Price Trend & Structure
The price is moving inside an ascending channel with well-defined support and resistance trendlines.
Within the larger channel, a smaller parallel channel has formed in recent price action, showing short-term bullish momentum.
2. Key Levels
Resistance: The price is approaching the upper boundary (~2,840), which may act as a selling zone.
Support: The lower boundary (~2,640) is acting as a strong buying zone.
EMA 200 (2,697.468): The price is above the 200 EMA, indicating an overall bullish trend.
3. Possible Scenarios
Bullish Case: If the price breaks above resistance (~2,840), it may continue higher.
Bearish Case: If the price gets rejected at resistance, it could fall towards the lower channel support (~2,640).
Short-term Retracement: Since the price is near the upper boundary, a pullback towards the midline or EMA 200 (~2,700) could occur.
4. Market Sentiment
Uptrend confirmed: The price has consistently made higher highs and higher lows.
EMA support: As long as the price stays above EMA 200, the bullish sentiment remains strong.
Conclusion
The market is currently bullish but approaching resistance.
Watch for a potential breakout or rejection.
Traders may look for buying opportunities on pullbacks or shorting opportunities near resistance with confirmation.

NIFTY 50: A Tug-of-War Between Bulls and BearsNIFTY 50 index is consolidating after a sharp decline, trading within a narrow range. While the overall trend leans bearish, there’s potential for a breakout on either side depending on market momentum.
What’s Happening?
Resistance Zones:
23,752-23,800: This is a strong supply zone, marked by repeated rejections. Bulls need to push through this level to spark any meaningful recovery.
23,953: A major resistance level, signaling the upper cap for a bullish breakout if momentum strengthens.
Support Levels:
23,616-23,560: This is the immediate support area. A break below could accelerate the downside momentum.
23,413-23,225: A critical demand zone if the index fails to hold above 23,560. Buyers are expected to step in here for relief.
Current Setup:
The index is oscillating between 23,616 and 23,752, forming a sideways range. This reflects market indecision as traders wait for a clear direction.
How to Trade This:
If you’re bullish:
Look for a breakout above 23,752 with strong volume. If successful, the next target could be 23,953. Be cautious near 23,800, as sellers might re-enter.
If you’re bearish:
Watch for a breakdown below 23,616. A move lower could lead to a drop toward 23,413 or even 23,225. Use caution if the price approaches the support zone, as buyers may react.
Bottom Line:
The market is in a wait-and-watch phase, with key levels acting as decision points. The area between 23,560 and 23,752 will dictate the next move. Stay alert for a breakout or breakdown and plan your trades accordingly.
NSE:NIFTY
What’s your view on NIFTY? Share your thoughts and levels in the comments! 🚀📉
Only for educational purposes.
This content is not a recommendation to buy and sell.
Not SEBI REGISTRAR.

IREDA Analysis!NSE:IREDA Analysis on a Daily Timeframe!
Triangle Pattern Formation in IREDA!
Triangle Pattern Breakout in IREDA!
Analysis:
As we can see the stock in moving in a triangle since December 2023. It was continuously consolidating in it. On 27th June it tried breaking out the resistance but unable to sustain above the resistance. Today again it has been successfully given the breakout and able to close above the breakout. As i marked all the important levels on the chart please have a look.
Trade Setup:
Entry = Current price level is good to Enter
Key Level = 214.80 This is the All Time High Level, Price may reverse from this level but if it breaks, will the major uptrend
Target = 455.85
Stop Loss = Below 173 or as per your Risk To Reward
Disclaimer = Consider my analysis for Educational Purpose only.
Before entering into any trade -
1) Educate Yourself
2) Do your research and analysis
3) Define your Risk to Reward ratio
4) Don't trade with full capital

Uptrend Channel breakdown in OBEROIRLTYOBEROI REALTY LTD
Key highlights: 💡⚡
✅On 1 Hour Time Frame Stock Showing Breakdown of Uptrend Channel Pattern .
✅Strong bearish Candlestick Form on this timeframe.
✅It can give movement up to the Breakdown target of 1862-.
✅Can Go short in this stock by placing a stop loss above 1926+.

Day 31 of Live Algo Day Trading JournalDay 31: Day opened bullish, my stock opened and immediately ran up to its high point. Algo did not trigger as it is deisgned to get in on a pullback. Got an entry; market tried to cheat but could not succeed and was saved. However later on the market cheated and threw me out with a minor profit. Algo again got triggered but in the wrong direction, suffered small loss. Third time algo got triggered but came out at parity.
Progress : Did not do any manual trade today even when felt like taking a bullish position manually(in hindsight looks like I was correct), but idea is to build the habit of only algo trading, no manual trading, so good, did not get into temptation.

Swing trad Coalindia buy COALINDIA BUY 458
Stoploss:- 436
Target-1 🎯:- 487
Target -2 🎯:- 504
Target-3 🎯:- 527
Ye stock ka 487 Alltime high he or us ko breck kar dega to or upar ja sakta he so this is best stock buy for swing trad

IGL, Important levels to ConsiderHello traders,
Thanks for your support and love. Recently I got some questions on IGL, some of them are interested in bottom fishing and others want to accumulate at these levels. Before we start our analysis I like to declare that "I am holding this stock (IGL) in my personal portfolio.".
Let's start our technical analysis.
Time frame: Daily
Chart type : Heikin Ashi
Indicator: GMMA, RSI
Important Levels: Marked on the chart
As we are already 33% down from its high which was in September 2021. But this correction of 33% is very systematic and also I consider this as a good "Time wise correction". This stock respects the technical structure very well, I mean to say that the price follows the right charting behavior which is easy to analyse. Recently we have a strong breakdown in the structure of Heikin Ashi and a negative crossover in the Guppy's indicator which indicates a strong downtrend. But this break of structure happened just near the support zone and we see the price is consolidating at these levels but no sign of reversal. Also the relative strength index breaks down the level of 40, which is a negative signal. From some other technical aspects I think the price could experience high volatility in the range of 400 to 390 and 390 to 380.
So, my dear traders wait for the price to settle down. But keep this stock on your radar and keep tracking the price, soon we get the right opportunity to enter. I will keep posting the daily update on this stock so stay tuned. Happy trading.
Disclaimer: This is my pre market analysis and my trading journal. Not a suggestion to buy or sell.
Thanks
Er. Simranjit Singh Virdi
(Independent Trader)

CHF Loses Ground After The SNB Rate CutToday, the Swiss National Bank cut its interest rate, dropping from +1.75% to +1.50%. Last time we saw any changes made in the rate were back in June 2023, when the Bank lifted the rate from +1.75% to +1.50%. After the release of the news CHF devalued against all of its major counterparts, even against the currently-weak USD.
Looking at the technical picture of EASYMARKETS:USDCHF on our daily chart, we can see that the pair popped higher today after the SNB release. The rate rose above a key resistance barrier, at 0.8886, which is the highest point of February. As long as EASYMARKETS:USDCHF continues to trade above that barrier, we will stay positive, at least with the near-term outlook.
Given that the pair had already reached and overshot one of our key resistance areas, at 0.8954, we will continue aiming higher. That's when we will target the 0.9052 obstacle, or even the 0.9113 level, marked by the highest point of November 2023.
In order to shift our attention to some lower areas, a break of a short-term tentative upside support line taken from the lowest point of December 2023, is needed. This way a directional change of the current uptrend may occur, possibly inviting more sellers into the game. EASYMARKETS:USDCHF could then fall to the current lowest point of March, at 0.8730, a break of which may set the stage for a move to the 0.86500 area. That area is marked near the inside swing highs of January 29th and February 1st.

TataTech consolidating and waiting for breakout.Trading in range on hourly chart. Range getting thinner. Accumulation being done. Investment opportunity above 1172 with a stop loss of 1135.

BoschLtdNSE:BOSCHLTD Breakout of the tradeline in weekly time frame... can give a decent return on long position....
What's your view?

Triveni Engineering - Short Term BuyThis stock has formed Cup and Handle pattern on weekly charts, and possibly look to show upward break out soon. An entry at ₹ 358 with a Target of ₹ 400 - ₹ 420 - ₹ 440 could be achieved. A strict Stop loss of ₹ 320 shall be places

Target Achived in HeroMotocorpIn September, We shared the Technical analyzed chart of HeroMotocorp and there we gave a target of upside move and you can see there, it has already given a huge return in just matter of 3 months and now it started correcting....
Here, we have shared the updated analysis chart for your better decision making ...

Rec LtdIn September 2023, We recommended to buy the stock and reason was it was undervalued and had multiyear consolidation which is strong sign to long....
After that It has given huge 180% return in matter of few days .......
Now, we have updated and you can see the technical analysis ... It may retest for a while so better to be away until retest ....

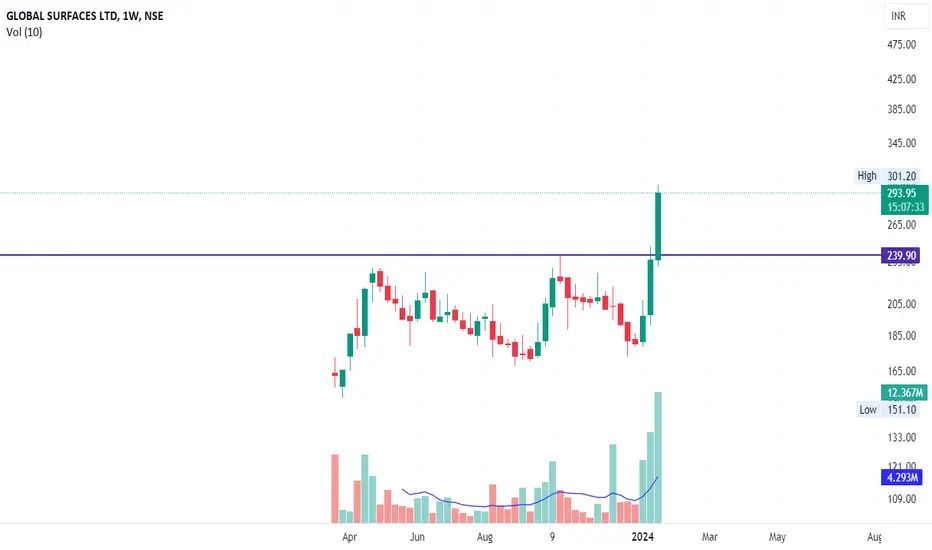
GSLSU / Global Surfaces Ltd - Consolidation / IPO Base BreakoutGSLSU
1) Time Frame - Weekly.
2) Previous Life Time High was 239.30. It has been consolidating since 2023, March & given a breakout in weekly time frame currently.
3) It's a consolidation / IPO base breakout with strong bullish candle & Good volume.
4) Recommendation - Strong Buy
GSFC Analysis(Descending Triangle)!GSFC Analysis on Weekly Timeframe
Descending Triangle Pattern Formation in GSFC on Weekly Timeframe!
Descending Triangle Pattern Breakout on Upper Side!
Bullish view on GSFC!
GSFC has made Descending Triangle Pattern on Weekly Timeframe. GSFC has given a huge breakout on the upper resistance trendline. We should wait for retest because we don't want to buy it at higher price so we are waiting for a decent retesting. We can see a huge breakout volume so we need to wait for the volume adjustment for avoiding the breakout trap.
Trade Psychology and setup =
Entry = After Retesting between 147.10 - 153.30
Target = Target will be 241.40
Stop Loss = Below 122.35
Disclaimer = All my analysis are for Educational Purpose only. Before entering into any trade - 1) Educate Yourself 2) Do your own research and analysis 3) Define your Risk to Reward ratio 4)Don't trade with full capital

Fake BreakoutBajaj finance were forming Ascending Triangle and Gave a Breakout once but didn't sustain our the resistance level and breakout turn into fake breakout and now again price trending in a range...
Get full analysed video on our youtub chnnel very soon @influitive capital

Slight short is expected Keep watching closely. Gold may consolidate for some while every fall we accumulate. In long run we will have a good harvest.
