Management and psychology in Trading Trading psychology is the emotional component of an investor's decision-making process, which may help explain why some decisions appear more rational than others. Trading psychology is characterized primarily by the influence of both greed and fear. Greed drives decisions that might be too risky.
Technical

Institutional Trading StrategiesInstitutional traders incorporate strategies that emphasize both long-term value and diversification in their trading practices. They leverage significant amounts of capital to build portfolios diversified across multiple assets, which helps reduce risk while seeking improved market prices.

Learn Institutional Trading Institutional trading involves the buying and selling of securities by large financial institutions on behalf of their clients or for their own portfolios. These institutions, such as hedge funds, mutual funds, and insurance companies, handle substantial volumes of trades, potentially impacting market prices.

MACD TradingThe Moving Average Convergence/Divergence indicator is a momentum oscillator primarily used to trade trends. Although it is an oscillator, it is not typically used to identify over bought or oversold conditions. It appears on the chart as two lines which oscillate without boundaries.

RSI Divergence part 2RSI Divergence is among technical analyses allowing traders to discover a possible market reversal by comparing price movements with the Relative Strength Index. The RSI tool measures how fast and strong price movements are, ranging between 0 and 100. Typically, when the RSI is below 30, the asset is considered oversold; when it's above 70, it's seen as overbought.

What is RSI Divergence?RSI (Relative Strength Index) divergence in technical analysis occurs when the price of an asset moves in one direction while the RSI moves in the opposite direction. This divergence can signal a potential trend reversal or weakening momentum.

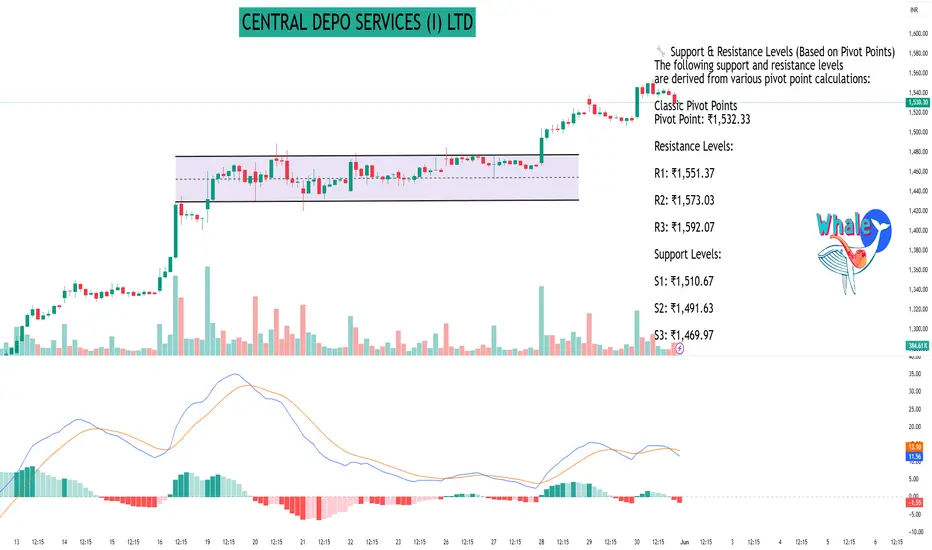
CENTRAL DEPO SERVICES (I) LTDAs of May 30, 2025, here are the 45-minute interval support and resistance levels for Central Depository Services (India) Ltd (NSE: CDSL), based on the latest available data:
📊 Current Price Snapshot
Last Traded Price: ₹1,529.70
Day’s Range: ₹1,513.30 – ₹1,554.00
52-Week Range: ₹917.63 – ₹1,989.80
Volume: 5,711,655 shares
VWAP: ₹1,539.78
Market Capitalization: ₹31,971 crore
Beta: 1.34
Dividend Yield: 0.82%
Book Value per Share: ₹73.16
Upper Circuit Limit: ₹1,664.30
Lower Circuit Limit: ₹1,361.70
🔧 Support & Resistance Levels (Based on Pivot Points)
The following support and resistance levels are derived from various pivot point calculations:
Classic Pivot Points
Pivot Point: ₹1,532.33
Resistance Levels:
R1: ₹1,551.37
R2: ₹1,573.03
R3: ₹1,592.07
Support Levels:
S1: ₹1,510.67
S2: ₹1,491.63
S3: ₹1,469.97
Fibonacci Pivot Points
Pivot Point: ₹1,532.33
Resistance Levels:
R1: ₹1,547.88
R2: ₹1,557.49
R3: ₹1,573.03
Support Levels:
S1: ₹1,516.79
S2: ₹1,507.18
S3: ₹1,491.63
Camarilla Pivot Points
Pivot Point: ₹1,532.33
Resistance Levels:
R1: ₹1,533.43
R2: ₹1,537.16
R3: ₹1,540.89
Support Levels:
S1: ₹1,525.97
S2: ₹1,522.24
S3: ₹1,518.51
📈 Technical Indicators Summary
Relative Strength Index (RSI): Data not available
MACD: Data not available
ADX: Data not available
Stochastic RSI: Data not available
Supertrend: Data not available
Parabolic SAR (PSAR): Data not available
🧭 Trading Outlook
Trend: Neutral to Slightly Bullish
Recommendation: The stock is trading near its pivot point, indicating a neutral stance. Traders should monitor for a breakout above R1 (₹1,551.37) for bullish confirmation or a breakdown below S1 (₹1,510.67) for bearish signals.
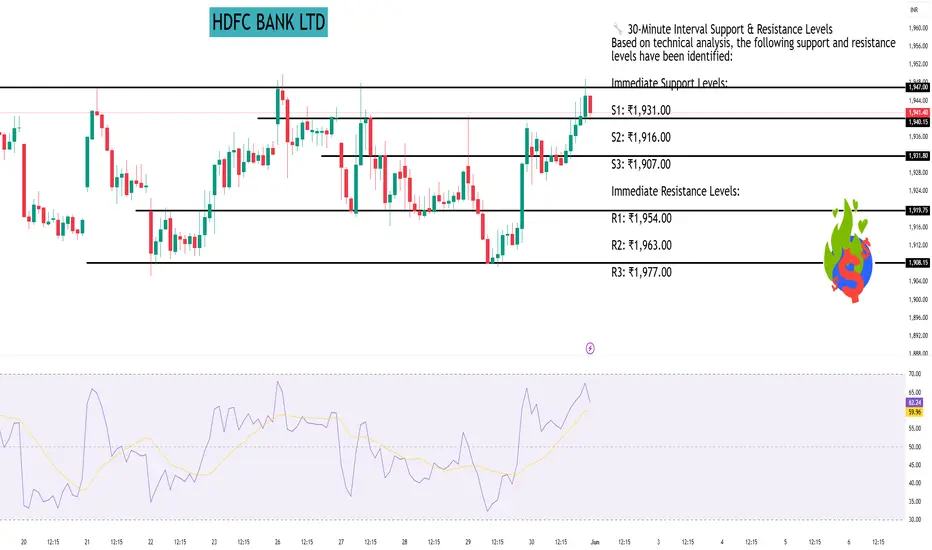
HDFC BANK LTDAs of May 30, 2025, here are the 30-minute interval support and resistance levels for HDFC Bank Ltd (NSE: HDFCBANK), based on the latest available data:
📊 Current Price Snapshot
Last Traded Price: ₹1,944.90
Day’s Range: ₹1,925.10 – ₹1,948.60
52-Week Range: ₹1,490.00 – ₹1,978.90
Market Capitalization: ₹14.77 trillion
Beta: 0.77
Volatility: 1.22%
🔧 30-Minute Interval Support & Resistance Levels
Based on technical analysis, the following support and resistance levels have been identified:
Immediate Support Levels:
S1: ₹1,931.00
S2: ₹1,916.00
S3: ₹1,907.00
Immediate Resistance Levels:
R1: ₹1,954.00
R2: ₹1,963.00
R3: ₹1,977.00
📈 Technical Indicators Summary
Relative Strength Index (RSI): 55.32 (Neutral)
MACD: 0.333 (Bullish)
ADX: 16.63 (Indicates a weak trend)
Stochastic RSI: 55.28 (Neutral)
Supertrend: ₹384.44 (Bullish)
Parabolic SAR (PSAR): ₹385.89 (Bullish)
🧭 Trading Outlook
Trend: Neutral to Slightly Bullish
Recommendation: The stock is trading near its immediate resistance level of ₹1,954.00. A breakout above this level could indicate a bullish trend, while a drop below the immediate support of ₹1,931.00 might suggest bearish momentum. Traders should monitor these levels closely for potential entry or exit points.
EXIDE INDUSTRIES LTDAs of May 30, 2025, here are the monthly support and resistance levels for Exide Industries Ltd (NSE: EXIDEIND) based on various technical analysis methods:
📊 Current Price Snapshot
Last Traded Price: ₹386.85
Day’s Range: ₹383.15 – ₹390.20
52-Week Range: ₹328.00 – ₹620.35
Volume: 1,888,195 shares
VWAP: ₹386.58
Market Capitalization: ₹32,882 crore
Beta: 1.37
Dividend Yield: 0.52%
Book Value per Share: ₹162.65
Upper Circuit Limit: ₹427.65
Lower Circuit Limit: ₹349.95
Face Value: ₹1.00
🔧 Monthly Support & Resistance Levels
Standard Pivot Points
Pivot Point: ₹384.23
Resistance Levels:
R1: ₹416.72
R2: ₹444.83
Support Levels:
S1: ₹356.12
S2: ₹323.63
Fibonacci Pivot Points
Pivot Point: ₹356.12
Resistance Levels:
R1: ₹379.27
R2: ₹393.57
R3: ₹416.72
Support Levels:
S1: ₹332.97
S2: ₹318.67
S3: ₹295.52
Camarilla Pivot Points
Pivot Point: ₹356.12
Resistance Levels:
R1: ₹357.31
R2: ₹362.86
R3: ₹368.42
R4: ₹385.08
Support Levels:
S1: ₹346.19
S2: ₹340.64
S3: ₹335.08
S4: ₹318.42
📈 Technical Indicators Summary
Relative Strength Index (RSI): 55.32 (Neutral)
MACD: 0.333 (Bullish)
ADX: 16.63 (Indicates a weak trend)
Stochastic RSI: 55.28 (Neutral)
Supertrend: ₹384.44 (Bullish)
Parabolic SAR (PSAR): ₹385.89 (Bullish)
🧭 Trading Outlook
Trend: Neutral to Slightly Bullish
Recommendation: The stock is trading near its monthly pivot point, indicating a neutral stance. Traders should monitor for a breakout above R1 (₹416.72) for bullish confirmation or a breakdown below S1 (₹356.12) for bearish signals.

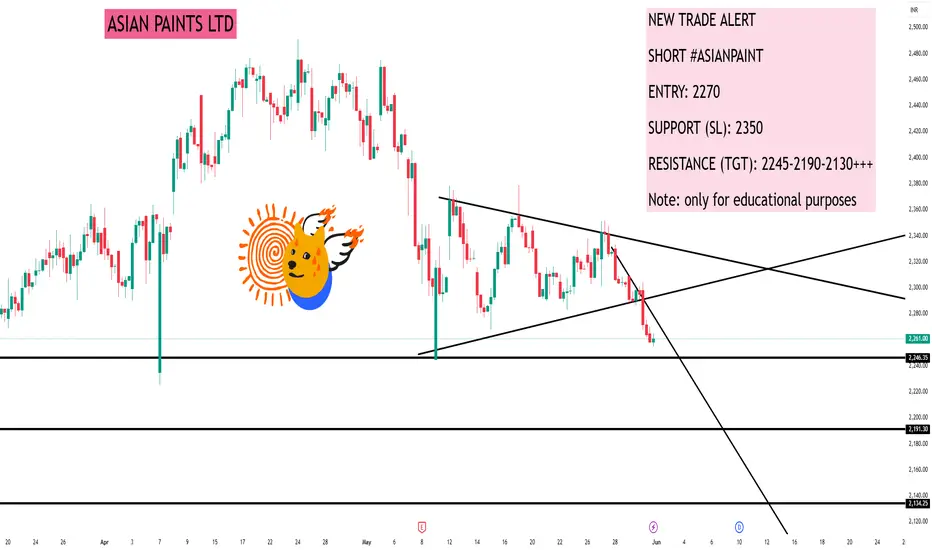
ASIAN PAINTS LTDNEW TRADE ALERT
SHORT #ASIANPAINT
ENTRY: 2270
SUPPORT (SL): 2350
RESISTANCE (TGT): 2245-2190-2130+++
Note: only for educational purposes
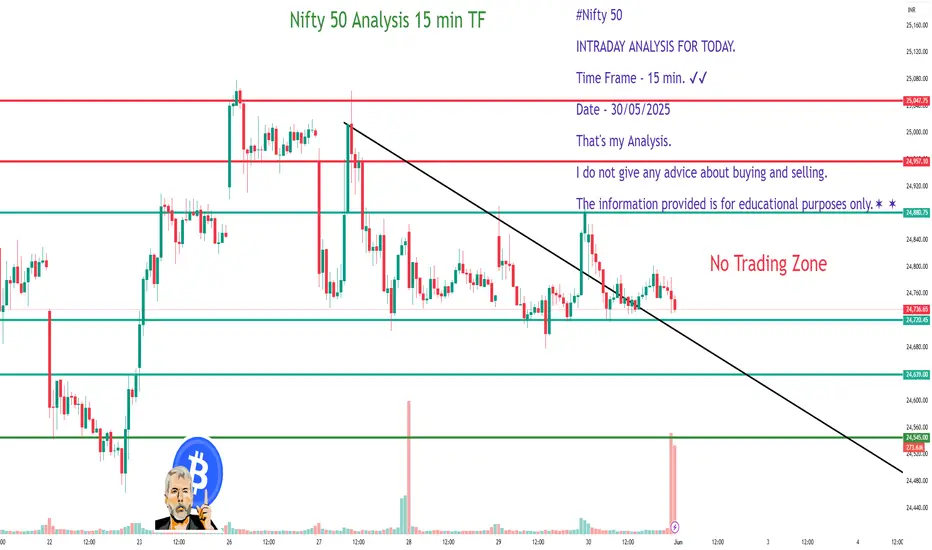
Nifty 50 Analysis #Nifty 50
INTRADAY ANALYSIS FOR TODAY.
Time Frame - 15 min. ✔✔
Date - 30/05/2025
That's my Analysis.
I do not give any advice about buying and selling. The information provided is for educational purposes only.✶ ✶
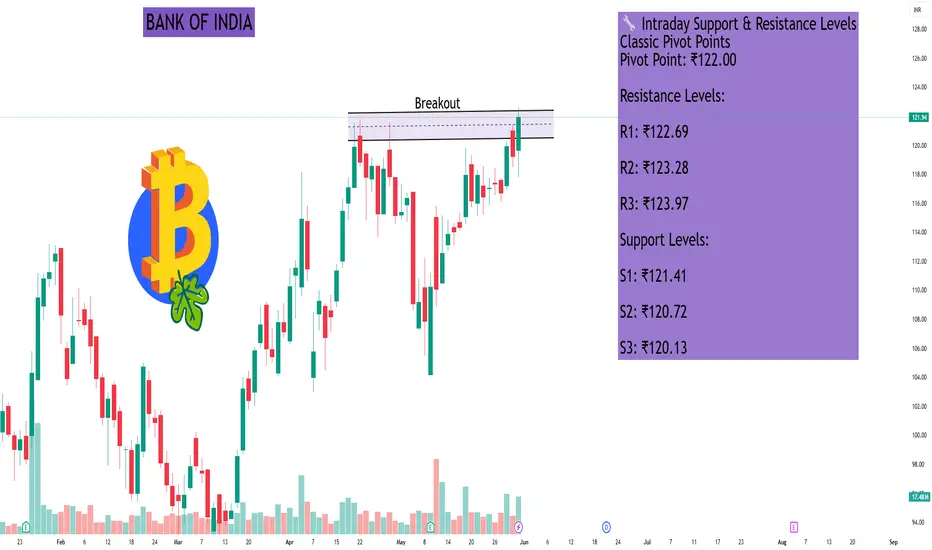
BANK OF INDIAHere are the intraday (1-day) support and resistance levels for Bank of India (NSE: BANKINDIA) as of the latest available data:
📊 Price Snapshot (as of May 30, 2025)
Last Traded Price: ₹121.94
Day’s Range: ₹117.80 – ₹122.61
52-Week Range: ₹90.05 – ₹137.45
Volume: 17,477,465 shares
VWAP: ₹121.03
Market Capitalization: ₹55,515 crore
Beta: 1.21
Dividend Yield: 2.30%
Book Value per Share: ₹162.55
Upper Circuit Limit: ₹131.13
Lower Circuit Limit: ₹107.28
🔧 Intraday Support & Resistance Levels
Classic Pivot Points
Pivot Point: ₹122.00
Resistance Levels:
R1: ₹122.69
R2: ₹123.28
R3: ₹123.97
Support Levels:
S1: ₹121.41
S2: ₹120.72
S3: ₹120.13
Fibonacci Pivot Points
Pivot Point: ₹122.00
Resistance Levels:
R1: ₹122.49
R2: ₹122.79
R3: ₹123.28
Support Levels:
S1: ₹121.51
S2: ₹121.21
S3: ₹120.72
Camarilla Pivot Points
Pivot Point: ₹122.00
Resistance Levels:
R1: ₹122.22
R2: ₹122.33
R3: ₹122.45
Support Levels:
S1: ₹121.98
S2: ₹121.87
S3: ₹121.75
📈 Technical Indicators Summary
Relative Strength Index (RSI): 70.99 (Buy)
MACD (12,26): 0.93 (Buy)
ADX (14): 32.69 (Buy)
Stochastic RSI (14): 92.60 (Overbought)
CCI (14): 191.58 (Buy)
ATR (14): 1.05 (High Volatility)
Williams %R: -13.78 (Overbought)
🧭 Trading Outlook
Trend: Strong Bullish
Recommendation: The stock exhibits a strong bullish trend with multiple technical indicators signaling a 'Buy'. However, the Stochastic RSI and Williams %R indicate overbought conditions, suggesting caution for new entries. Traders should monitor for potential pullbacks or consolidation before initiating new positions.
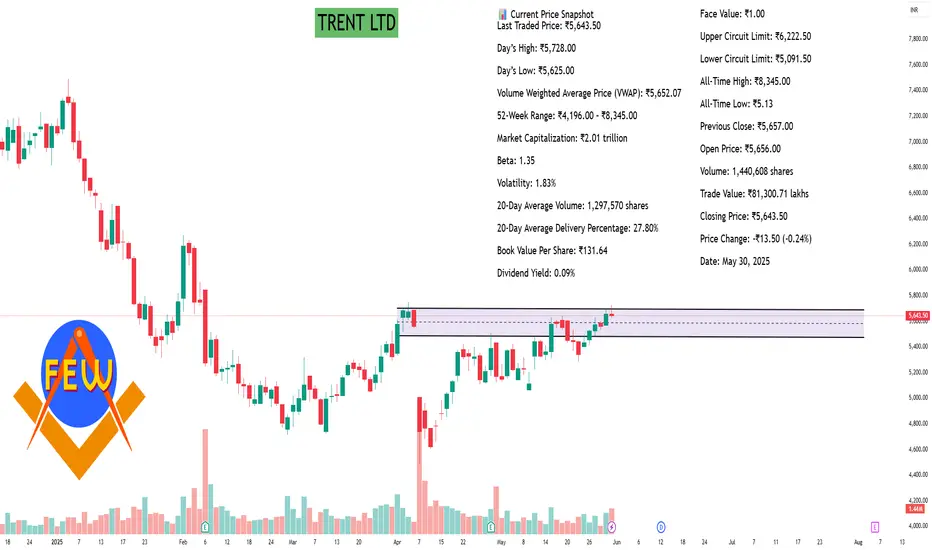
TRENT LTDAs of the latest available data, here are the intraday (1-day) support and resistance levels for Trent Ltd (NSE: TRENT), based on various technical analysis methods:
📊 Current Price Snapshot
Last Traded Price: ₹5,643.50
Day’s High: ₹5,728.00
Day’s Low: ₹5,625.00
Volume Weighted Average Price (VWAP): ₹5,652.07
52-Week Range: ₹4,196.00 – ₹8,345.00
Market Capitalization: ₹2.01 trillion
Beta: 1.35
Volatility: 1.83%
20-Day Average Volume: 1,297,570 shares
20-Day Average Delivery Percentage: 27.80%
Book Value Per Share: ₹131.64
Dividend Yield: 0.09%
Face Value: ₹1.00
Upper Circuit Limit: ₹6,222.50
Lower Circuit Limit: ₹5,091.50
All-Time High: ₹8,345.00
All-Time Low: ₹5.13
Previous Close: ₹5,657.00
Open Price: ₹5,656.00
Volume: 1,440,608 shares
Trade Value: ₹81,300.71 lakhs
Closing Price: ₹5,643.50
Price Change: -₹13.50 (-0.24%)
Date: May 30, 2025
🔧 Intraday Support & Resistance Levels
Classic Pivot Points
Pivot Point: ₹5,665.50
Resistance Levels:
R1: ₹5,706.00
R2: ₹5,768.50
R3: ₹5,809.00
Support Levels:
S1: ₹5,603.00
S2: ₹5,562.50
S3: ₹5,500.00
Fibonacci Pivot Points
Pivot Point: ₹5,665.50
Resistance Levels:
R1: ₹5,704.85
R2: ₹5,729.15
R3: ₹5,768.50
Support Levels:
S1: ₹5,626.15
S2: ₹5,601.85
S3: ₹5,562.50
Camarilla Pivot Points
Pivot Point: ₹5,665.50
Resistance Levels:
R1: ₹5,652.94
R2: ₹5,662.38
R3: ₹5,671.82
Support Levels:
S1: ₹5,634.06
S2: ₹5,624.62
S3: ₹5,615.18
📈 Additional Technical Insights
Short-Term Support & Resistance:
Support: ₹5,603 – ₹5,563 – ₹5,500
Resistance: ₹5,706 – ₹5,769 – ₹5,809
Volume-Based Levels:
Support: ₹5,172.50
Resistance: ₹5,576.75
🧭 Trading Outlook
Trend: Positive
Recommendation: If holding long positions, continue to hold with a daily closing stop-loss of ₹5,528. Fresh short positions can be considered if TRENT closes below ₹5,528.
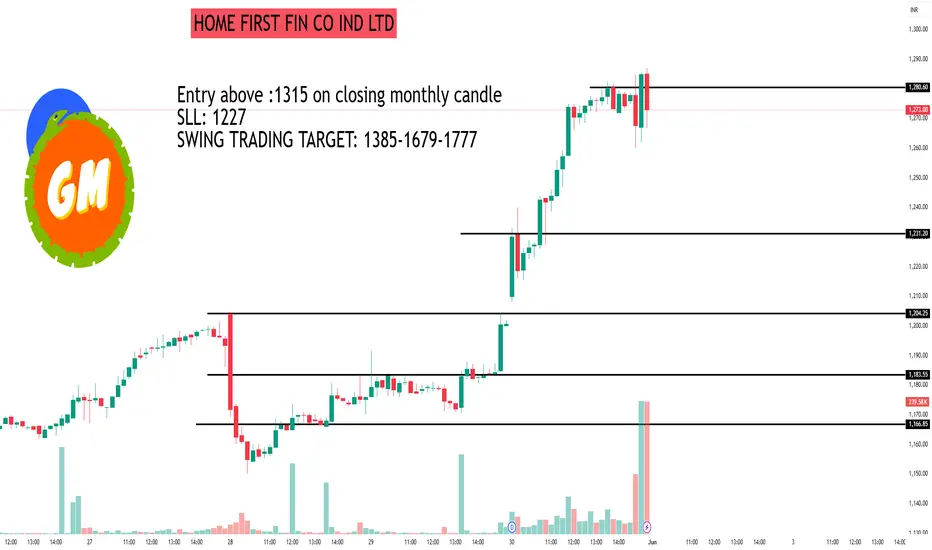
HOME FIRST FIN CO IND LTD#HOMEFIRST
This is not a buy or sell recommendation only for educational purposes and I am not a SEBI registered.
Entry above :1315 on closing monthly candle
SLL: 1227
SWING TRADING TARGET: 1385-1679-1777
Based on a comprehensive analysis of Home First Finance Company India Ltd. (NSE: HOMEFIRST), here is an in-depth evaluation encompassing its fundamental performance, institutional investment trends, and suitability for long-term investment or swing trading strategies.
Fundamental Analysis
Financial Performance
Revenue & Profitability: The company has demonstrated robust financial growth, with annual revenue increasing from *242 million in FY2016 to *11.57 billion in FY2024. The net profit margin stood at 23.9% in Q3 FY25, indicating efficient operations and profitability.
Asset Quality: As of December 31, 2024, the total asset value was ₹11,309 crore, reflecting a strong asset base. The company maintains a healthy capital adequacy ratio (CRAR) of 36.2%, showcasing financial stability.
Return Metrics: The Return on Equity (ROE) improved to 14.41% in FY2024, up from 12.56% in FY2023, indicating enhanced shareholder value creation.
Institutional Investment Trends
Promoter Holdings: There has been a notable reduction in promoter holdings, decreasing from 23.38% to 14.31% in the quarter ending December 2024. Institutional Investors: Institutional investors have significantly increased their stake, rising from 37.98% to 56.19% in the same period, indicating growing confidence among large investors.
Technical Indicators
Moving Averages: The stock is trading close to its 50-day Simple Moving Average (SMA) of *996.03 and 200-day SMA of ₹1,051.20, suggesting a neutral trend. Momentum Indicators: The Relative Strength Index (RSI) is at 54.75, indicating a neutral momentum. The Money Flow Index (MFI) at 74.85 suggests strong buying pressure.
Investment Considerations
Long-Term Investment
Home First Finance exhibits strong fundamentals, consistent growth, and increasing institutional interest, making it a viable option for long-term investment. Analysts have set a 12-month average target price of ₹1,239.81, representing an upside potential of approximately 24.86% from the current price.
Swing Trading
For swing trading, the stock's current technical indicators suggest a neutral trend. Traders should monitor key support and resistance levels and consider market volatility before initiating short-term positions.
* Conclusion
Home First Finance Company India Ltd. presents a compelling investment opportunity, backed by strong financial performance and growing institutional interest. While the stock shows potential for long-term growth, swing traders should exercise caution and rely on technical analysis for entry and exit points. If you have specific queries regarding the monthly chart or require further analysis, please provide the chart details, and I will be glad to assist you further.
Support and Resistance part 1In trading, support and resistance levels are significant price points where a price tends to stop and reverse direction. Support acts as a price floor, indicating strong buying interest that prevents further declines. Resistance, on the other hand, is a ceiling, where selling pressure halts upward movement.

Option and Database Trading Examples of options data include information on the price, volume, and open interest of various options contracts, as well as details about the strike price, expiration date, and implied volatility.

Learn Institutional Level Trading part 4Institutional trading involves the buying and selling of financial assets by institutions, like pension funds, mutual funds, and insurance companies, on behalf of their clients or members.

Learn Institutional Level Trading part 3The buying and selling of financial assets are conducted by sizable entities, including banks, credit unions, pension funds, hedge funds, and mutual funds, in the process known as institutional trading.

PCR Trading part 2In the context of trading, PCR stands for Put-Call Ratio. It's a technical indicator used to assess market sentiment, specifically in the options market. The PCR is calculated by dividing the volume (or open interest) of put options by the volume (or open interest) of call options over a specific period.

PCR Trading part 1PCR trading refers to using the Put-Call Ratio (PCR) indicator to assess market sentiment and potentially predict future price movements. It's a contrarian indicator, meaning it suggests trading against the prevailing market sentiment. For example, a high PCR (suggesting a bearish market) might signal an opportunity to buy, as the market might be over-sold.

What is Technical Trading ?Technical trading, also known as technical analysis, involves studying historical price charts and market statistics to identify patterns and trends in order to make informed trading decisions. It focuses on the belief that market prices reflect all available information, and past patterns can help predict future price movements.

SHOBHA LTD#SOBHA
Intraday stock for 30/05/2025
BUY
ENTRY:-1400
SL:-1385
TARGET:-1415
TARGET 2:-1430
Disclaimer:-All views are my personal and only for educational purpose.

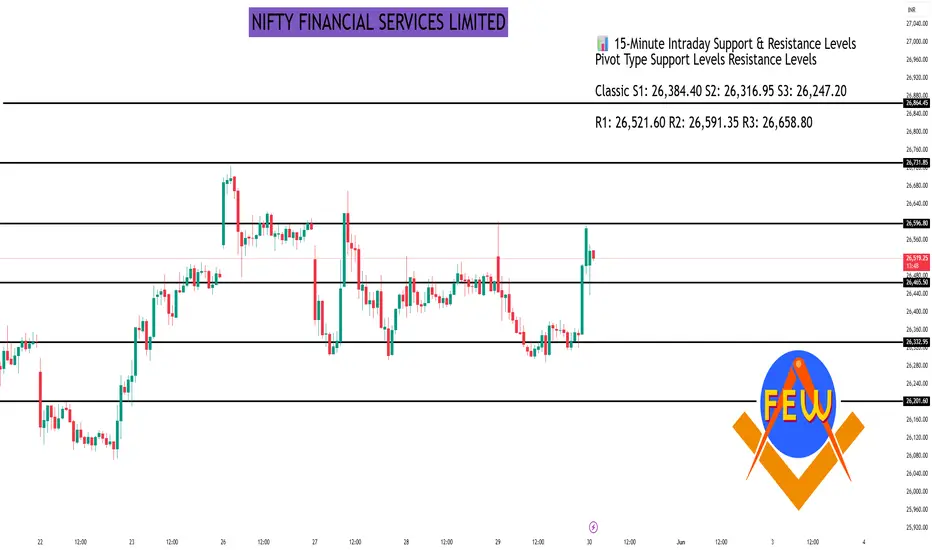
NIFTY FINANCIAL SERVICES LIMITED#FINNIFTY : INSTITUTIONAL LEVELS FOR 30/05/2025
• Overview
A simple yet powerful trading system for active 5-minute timeframe traders, built for quick, confident decisions in fast markets.
• Key Guidelines
Retest Entries: Prefer retests over breakouts.
Multiple Confirmations: Validate trades with 2+ signals.
ATM Options: Stick to at-the-money (ATM) or above for better liquidity and risk control.
• System Logic
Uses volume, historical price action, and ranges to find high-probability entries and exits, reducing guesswork and keeping trading consistent.
• Entry & Exit Signals
Blue Line: Possible long entry.
Red Line: Possible short entry.
Always align with extra confirmations for best results.
• Stop Loss & Target
Long SL: Below the nearest red line.
Short SL: Above the nearest blue line.
Long Target: Next red line above.
Short Target: Next blue line below.
Timeframe
Best for the 5-minute chart.
• Risk Note
▲ Trade responsibly. Use only capital you can afford to lose.
• Community
#Join discussions, share ideas, and grow with like-minded traders!
• Original System
* 100% original, tested in real markets for a true trading edge.