Institutional Trading part 4Institutional trading refers to the buying and selling of securities on behalf of large organizations or institutions like mutual funds, pension funds, and insurance companies. These institutions manage money for a group of people, often trading in large volumes that can significantly impact the market.
Technical

Price Action Trading Price action trading is a strategy where traders make decisions based on the price movements of an asset, rather than relying on technical indicators or other external factors. It involves analyzing historical price patterns and movements to identify potential trading opportunities and predict future price direction.

PCR ( Put Call Ratio) Trading StrategyThe Put Call Ratio (PCR) is a market sentiment indicator calculated by dividing the total volume of put options by the total volume of call options. It's used to gauge whether traders are predominantly betting on a market decline (puts) or rise (calls). A high PCR suggests bearish sentiment, while a low PCR indicates bullish sentiment.

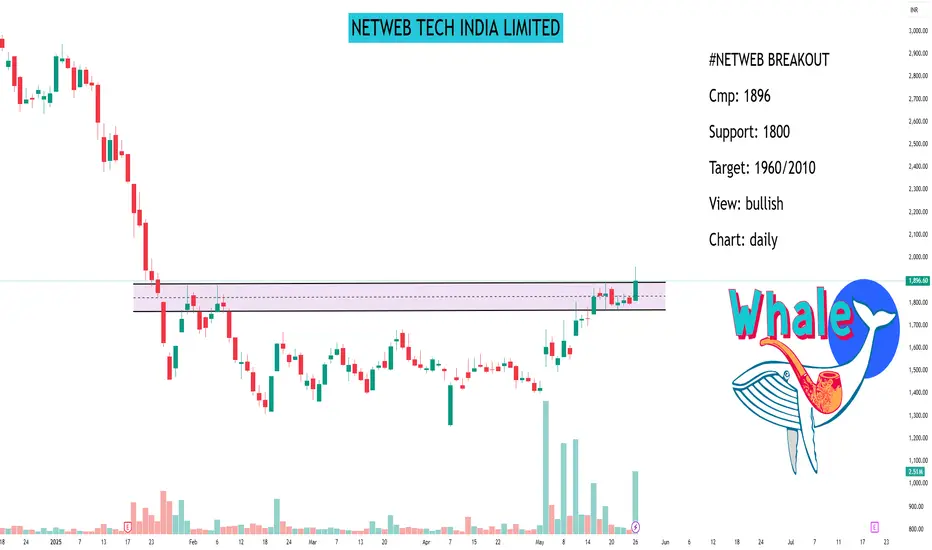
NETWEB TECH INDIA LIMITED#NETWEB BREAKOUT
Cmp: 1896
Support: 1800
Target: 1960/2010
View: bullish
Chart: daily
| Netweb Technologies India is trading 5.51% upper at Rs 1,896.60 as compared to its last closing price. Netweb Technologies India has been trading in the price range of 1,959.75 & 1,823.95. Netweb Technologies India has given -34.03% in this year & -1.85% in the last 5 days. Netweb Technologies India has TTM P/E ratio 74.80 as compared to the sector P/E of 17.79.
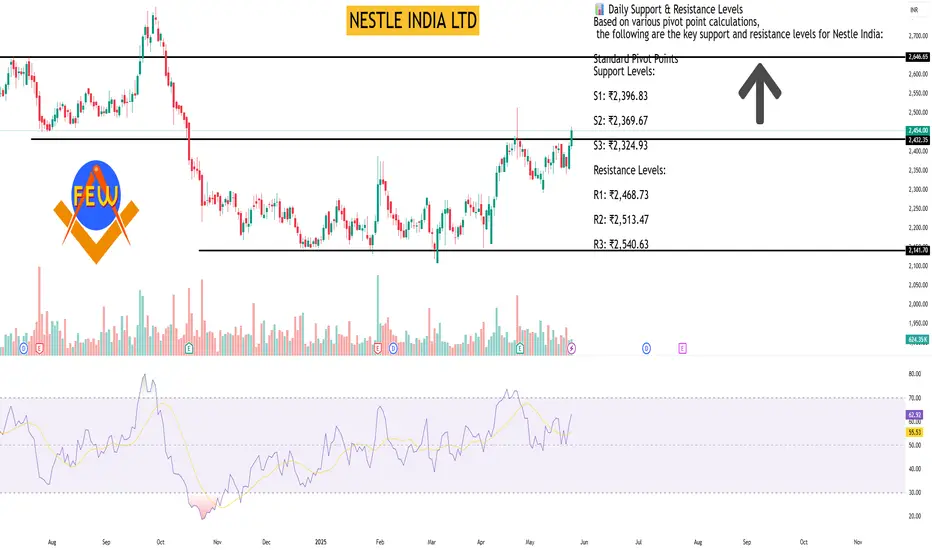
NESTLE INDIA LTDAs of May 26, 2025, Nestle India Ltd. (NSE: NESTLEIND) closed at ₹2,451.00, marking a 1.52% increase from the previous day. The stock's intraday range was between ₹2,405.40 and ₹2,464.90.
📊 Daily Support & Resistance Levels
Based on various pivot point calculations, the following are the key support and resistance levels for Nestle India:
Standard Pivot Points
Support Levels:
S1: ₹2,396.83
S2: ₹2,369.67
S3: ₹2,324.93
Resistance Levels:
R1: ₹2,468.73
R2: ₹2,513.47
R3: ₹2,540.63
Fibonacci Pivot Points
Support Levels:
S1: ₹2,396.83
S2: ₹2,369.37
S3: ₹2,352.40
Resistance Levels:
R1: ₹2,424.30
R2: ₹2,441.27
R3: ₹2,468.73
Camarilla Pivot Points
Support Levels:
S1: ₹2,407.81
S2: ₹2,401.22
S3: ₹2,394.63
Resistance Levels:
R1: ₹2,420.99
R2: ₹2,427.58
R3: ₹2,434.17
📈 Technical Indicators Overview
Relative Strength Index (RSI): 70.998 — approaching overbought territory.
MACD (12,26): 17.89 — bullish crossover.
Stochastic Oscillator (9,6): 85.134 — overbought.
Average Directional Index (ADX): 56.86 — indicating a strong trend.
Moving Averages: The stock is trading above its 5-day (₹2,454.78), 10-day (₹2,436.91), 20-day (₹2,405.42), 50-day (₹2,397.91), 100-day (₹2,374.14), and 200-day (₹2,381.37) simple moving averages, suggesting a strong upward momentum.
🔍 Summary
Nestle India Ltd. is exhibiting strong bullish momentum, trading above key support levels and moving averages. However, technical indicators like RSI and Stochastic Oscillator suggest that the stock is nearing overbought conditions. Investors should monitor these levels closely for potential pullbacks or consolidations.
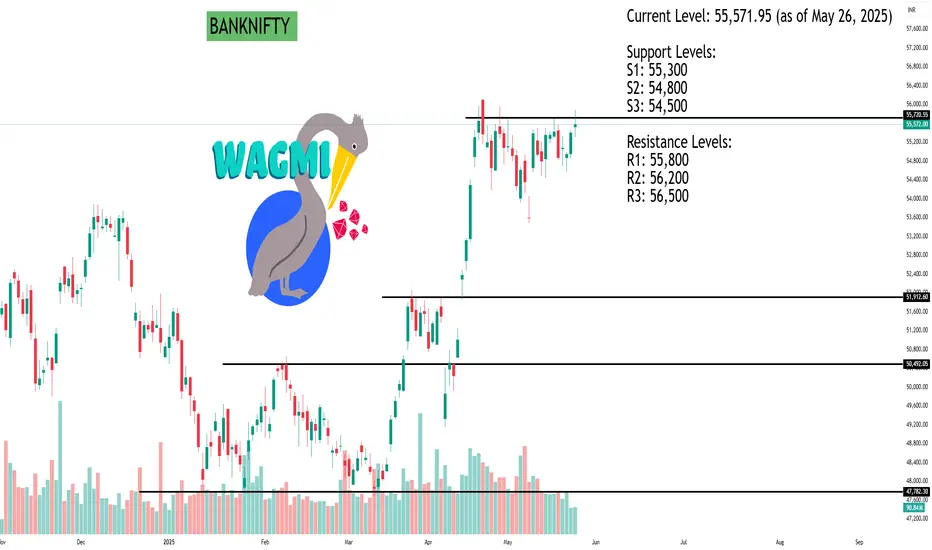
BANKNIFTY Bank Nifty - Intraday Levels
Current Level: 55,571.95 (as of May 26, 2025)
Support Levels:
S1: 55,300
S2: 54,800
S3: 54,500
Resistance Levels:
R1: 55,800
R2: 56,200
R3: 56,500
Intraday Strategy:
Bullish Scenario: If Bank Nifty sustains above 55,800, consider long positions targeting 56,200-56,500.
Bearish Scenario: If Bank Nifty breaks below 55,300, consider short positions targeting 54,800-54,500.
Stop-Loss:
For Long Positions: Below 55,300
For Short Positions: Above 55,800 #NIFTYBANK
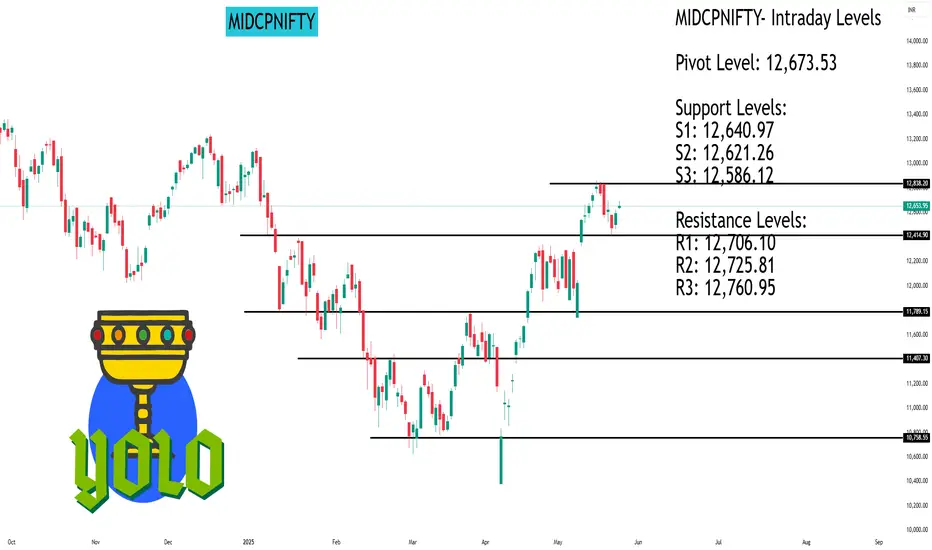
MIDCPNIFTY MIDCPNIFTY- Intraday Levels
Pivot Level: 12,673.53
Support Levels:
S1: 12,640.97
S2: 12,621.26
S3: 12,586.12
Resistance Levels:
R1: 12,706.10
R2: 12,725.81
R3: 12,760.95
Intraday Strategy:
Bullish Scenario:
If MIDCPNIFTY sustains above 12,687.25, consider long positions targeting 12,706.10-12,725.81-12,760.95.
Stop-Loss: 12,682.10
Bearish Scenario:
If MIDCPNIFTY breaks below 12,659.82, consider short positions targeting 12,640.97-12,621.26-12,586.12.
Stop-Loss: 12,682.10
#MIDCPNIFTY
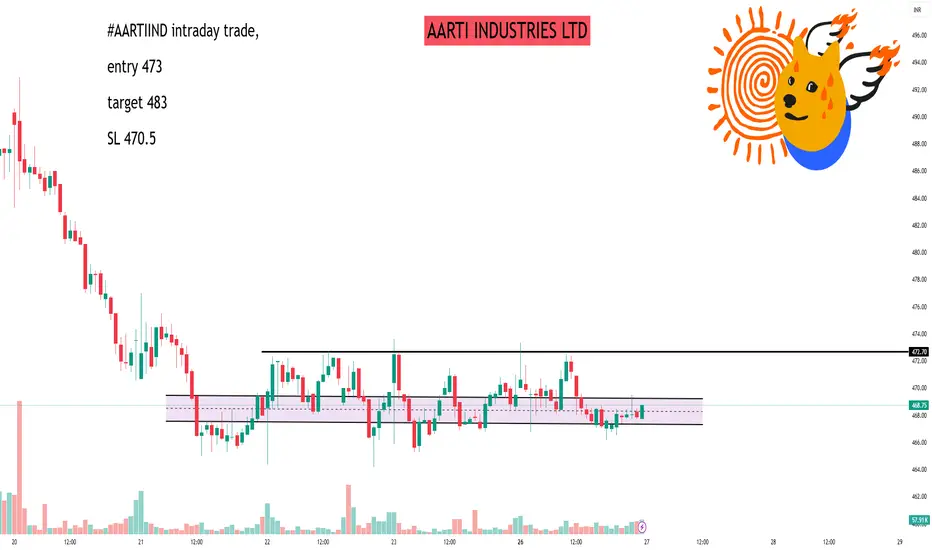
AARTI INDUSTRIES LTD📊 Intraday Support & Resistance Levels (15-Minute Interval)
Based on recent technical data, the following are the key support and resistance levels for AARTIIND:
Support Levels:
S1: ₹466.67
S2: ₹464.97
S3: ₹462.22
Resistance Levels:
R1: ₹472.17
R2: ₹473.87
R3: ₹476.62
These levels are derived from Fibonacci pivot point calculations and are pertinent for intraday trading decisions.
📈 Technical Indicators Overview
Trend Analysis: The stock exhibits a bullish trend in the short to mid-term, with resistance noted around ₹486.90 and support near ₹420.40.
Moving Averages: AARTIIND is trading above its 50-day moving average, indicating upward momentum.
Relative Strength Index (RSI): The RSI is approaching overbought territory, suggesting caution for new long positions.
✅ Trading Strategy Suggestions
Long Positions: Consider entering if the price sustains above ₹472.17 (R1) with strong volume, targeting ₹476.62 (R3).
Short Positions: If the price falls below ₹466.67 (S1), it may test lower supports at ₹464.97 (S2) and ₹462.22 (S3).
Stop-Loss Recommendations:
For Long Trades: Place a stop-loss below ₹466.67.
For Short Trades: Place a stop-loss above ₹472.17.
HLE GLASCOAT LTDHLE GLASCOAT LTD
Hleglas
Break resistance,
Try to sustain above it.
Max loss 10%, 8% risk
Risk here, stock extended from 10 sma,
And near next resistance
Target 20% I'll book if it reache, after half quantity trailing by sma

SHILPA MEDICARE LTDSHILPA MEDICARE LTD
Hidden Channel SHATTERED - Explosive Breakout on SHILPA MEDICARE
Breakout from a well-defined Weekly Counter Trendline (white thick line) with strong bullish candle.
Hidden Broadening Channel Formation (dotted white lines) was also broken in the same move-double breakout confirmation!
* Volume spike-first major surge in weeks, indicating institutional participation.
✰ Consolidation just below major resistance (MTF orange line) played out perfectly. Price broke above previous swing highs.
Next Resistance: *898.05 (Monthly TF resistance). With current momentum, a clean test is highly probable.

Management and PsychologyTrading psychology is the emotional component of an investor's decision-making process, which may help explain why some decisions appear more rational than others. Trading psychology is characterized primarily by the influence of both greed and fear. Greed drives decisions that might be too risky.

Advanced Trading part 2Advanced traders use a range of sophisticated tools to decode market trends. This includes understanding complex chart patterns, trend lines, and technical indicators such as Fibonacci retracements, Bollinger Bands and Ichimoku Clouds.

Technical Trading Technical trading is a broader style that is not necessarily limited to trading. Generally, a technician uses historical patterns of trading data to predict what might happen to stocks in the future. This is the same method practiced by economists and meteorologists: looking to the past for insight into the future.

Database Trading part 3Trading data is typically collected from stock exchanges such as the New York Stock Exchange (NYSE) or NASDAQ. This can be a useful source for trades that are made over the listed exchanges and can provide many different data poitns, such as trade prices and times.

Advanced Trading part 1Advanced trading encompasses sophisticated strategies, tools, and techniques used by experienced traders to gain an edge in the market, often involving complex instruments like options and futures, and multiple technical indicators. It's about developing a trading system, testing and refining strategies, and understanding market micro-structure.

RSI (Relative Strength Index)In trading, RSI stands for Relative Strength Index. It's a momentum indicator used in technical analysis to measure the speed and change of price movements of an asset. RSI helps traders identify potential overbought or oversold conditions, providing signals that can guide their trading decisions.

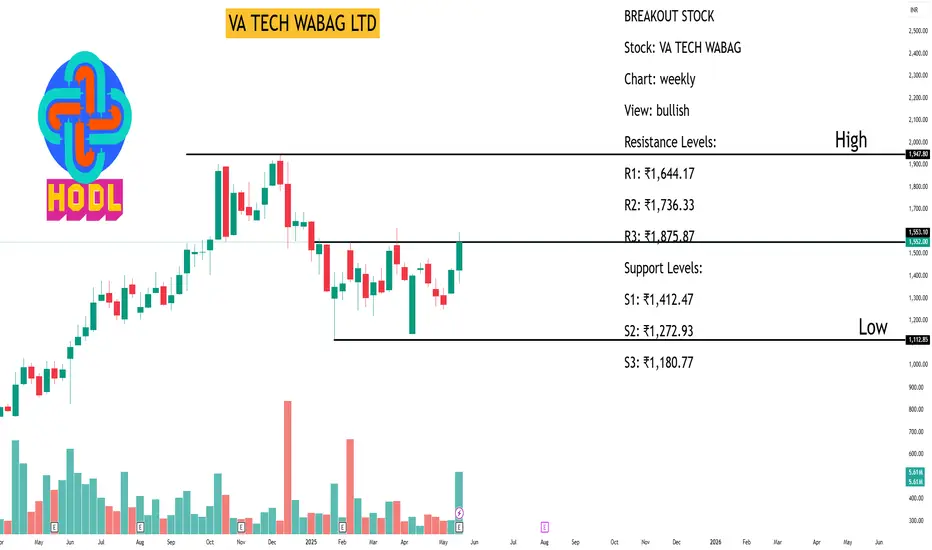
VA TECH WABAG LTDBREAKOUT STOCK
Stock: VA TECH WABAG
Chart: weekly
View: bullish
Resistance Levels:
R1: ₹1,644.17
R2: ₹1,736.33
R3: ₹1,875.87
Support Levels:
S1: ₹1,412.47
S2: ₹1,272.93
S3: ₹1,180.77
▸ Va Tech Wabag is trading 1.78% upper at Rs 1,552.10 as compared to its last closing price.
Va Tech Wabag has been trading in the price range of 1,595.10 & 1,532.80.
Va Tech Wabag has given -5.54% in this year & 8.77% in the last 5 days.
There are 2 analysts who have initiated coverage on Va Tech Wabag.
There are 1 analysts who have given it a strong buy rating & 1 analysts have given it a buy rating. 0.00 analysts have given the stock a sell rating.
The company posted a net profit of 99.50 Crores in its last quarter.Listed peers of Va Tech Wabag include Va Tech Wabag (1.78%), Jitf Infralogistics (-0.70%), Captain Polyplast (0.06%). The Mutual Fund held in Va Tech Wabag was at 2.29% in 31 Mar 2025.
►The Fll holding in Va Tech Wabag was at 18.58% in 31 Mar 2025. The FIl holding has decreased from the last quarter
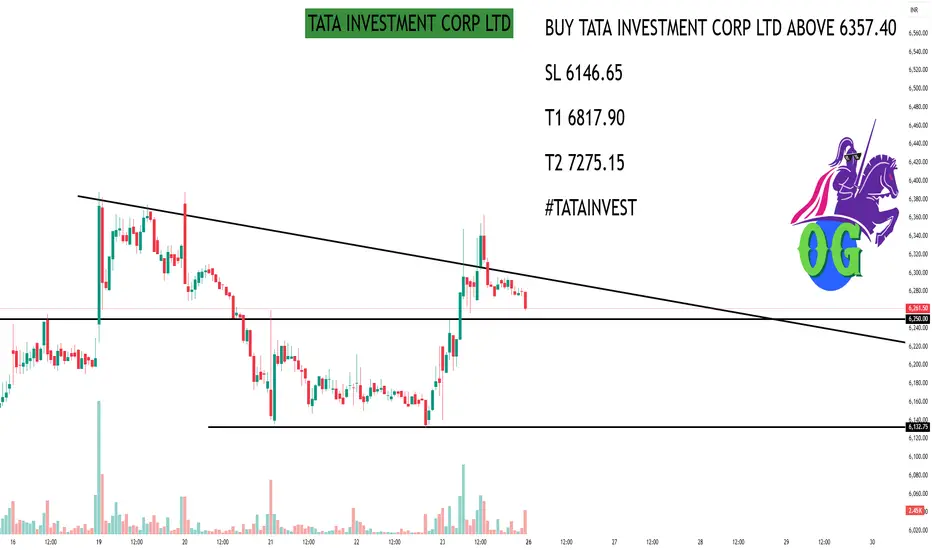
TATA INVESTMENT CORP LTDAs of May 26, 2025, Tata Investment Corporation Ltd. (NSE: TATAINVEST) closed at ₹6,269.00. Here's an overview of its 15-minute intraday support and resistance levels based on technical analysis:
📊 15-Minute Intraday Support & Resistance Levels
While specific 15-minute pivot points are not readily available, we can refer to the daily pivot levels as a proxy for intraday analysis:
Classic Pivot Points:
Pivot Point (P): ₹6,257.33
Resistance Levels:
R1: ₹6,374.66
R2: ₹6,480.33
R3: ₹6,597.66
Support Levels:
S1: ₹6,151.66
S2: ₹6,034.33
S3: ₹5,928.66
These levels can serve as reference points for intraday trading decisions.
🔍 Technical Indicators Overview
RSI (14-day): 57.56 — indicating neutral momentum.
MACD: 27.09 — suggesting bullish momentum.
Stochastic Oscillator: 72.08 — approaching overbought territory.
Supertrend Support: ₹5,861.93 — acting as a dynamic support level.
Parabolic SAR: ₹5,842.13 — indicating an upward trend.
These indicators suggest a cautiously bullish outlook for the short term.
📈 Trading Strategy Insights
Bullish Scenario: A breakout above ₹6,374.66 (R1) with strong volume could signal further upward momentum.
Bearish Scenario: A drop below ₹6,151.66 (S1) may indicate potential downside risk.
Traders should monitor these levels closely and consider additional technical indicators for confirmation.
ICICI PRU LIFE INS CO LTDAs of May 26, 2025, ICICI Prudential Life Insurance Co. Ltd. (NSE: ICICIPRULI) closed at ₹642.20, marking a 3.62% increase from the previous session. Here's a detailed analysis of its weekly support and resistance levels based on various pivot point methodologies:
📊 Weekly Pivot Point Levels
Classic Pivot Points
Pivot Point (P): ₹632.07
Resistance Levels:
R1: ₹654.08
R2: ₹665.97
R3: ₹687.98
Support Levels:
S1: ₹620.18
S2: ₹598.17
S3: ₹586.28
Fibonacci Pivot Points
Pivot Point (P): ₹632.07
Resistance Levels:
R1: ₹645.02
R2: ₹653.02
R3: ₹665.97
Support Levels:
S1: ₹619.12
S2: ₹611.12
S3: ₹598.17
Camarilla Pivot Points
Pivot Point (P): ₹632.07
Resistance Levels:
R1: ₹645.31
R2: ₹648.42
R3: ₹651.52
Support Levels:
S1: ₹639.09
S2: ₹635.99
S3: ₹632.88
🔍 Technical Outlook
Trend Analysis: The stock is currently trading above its central pivot point (₹632.07), indicating a bullish bias.
Key Resistance: A breakout above ₹654.08 (R1) could signal further upward momentum.
Key Support: A decline below ₹620.18 (S1) may suggest a potential bearish reversal.
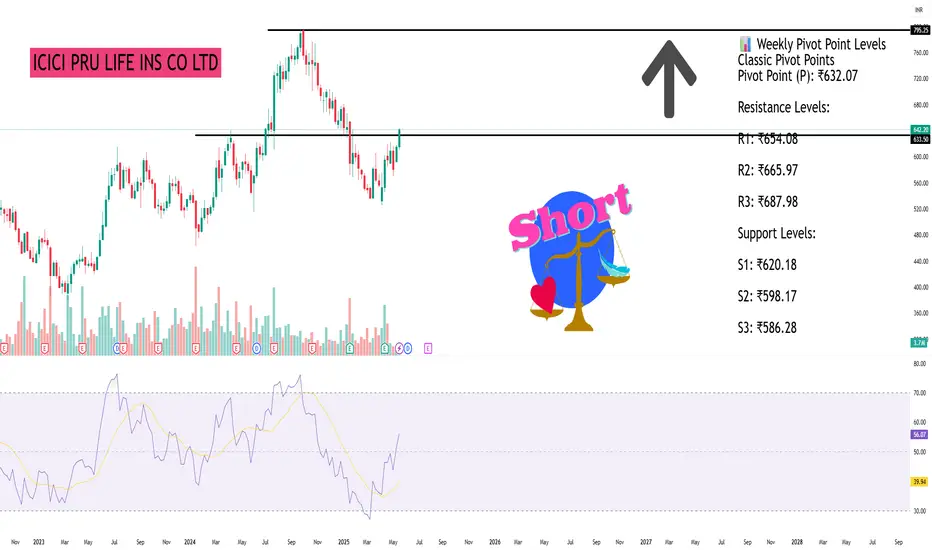
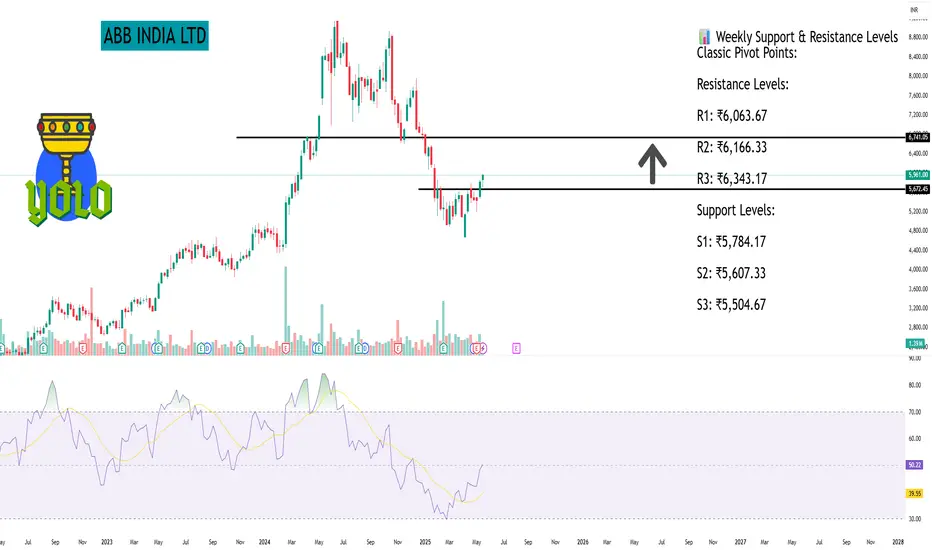
ABB INDIA LTDAs of May 26, 2025, ABB India Ltd. (NSE: ABB) closed at ₹5,961.00. Here's a comprehensive overview of its weekly support and resistance levels based on technical analysis:
📊 Weekly Support & Resistance Levels
Classic Pivot Points:
Resistance Levels:
R1: ₹6,063.67
R2: ₹6,166.33
R3: ₹6,343.17
Support Levels:
S1: ₹5,784.17
S2: ₹5,607.33
S3: ₹5,504.67
Pivot Point: ₹5,941.83
Fibonacci Pivot Points:
Resistance Levels:
R1: ₹5,985.57
R2: ₹6,012.59
R3: ₹6,056.33
Support Levels:
S1: ₹5,898.09
S2: ₹5,871.07
S3: ₹5,827.33
Pivot Point: ₹5,941.83
Camarilla Pivot Points:
Resistance Levels:
R1: ₹5,971.50
R2: ₹5,981.99
R3: ₹5,992.49
Support Levels:
S1: ₹5,950.50
S2: ₹5,940.01
S3: ₹5,929.51
Pivot Point: ₹5,941.83
🔍 Technical Outlook
Trend: ABB India is exhibiting a neutral to mildly bullish trend.
Key Observations:
The stock is trading near its central pivot point, suggesting potential for either a breakout or a pullback.
A decisive move above R1 levels could indicate bullish momentum, while a drop below S1 may suggest bearish tendencies.
Technical indicators such as RSI are indicating buying momentum, suggesting the stock might rise.
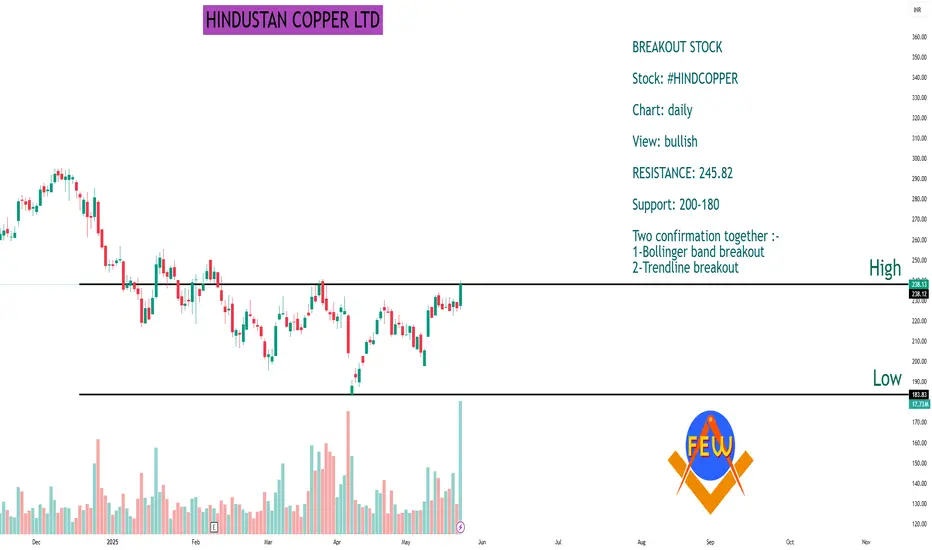
HINDUSTAN COPPER LTDBREAKOUT STOCK
Stock: #HINDCOPPER
Chart: daily
View: bullish
RESISTANCE: 245.82
Support: 200-180
Two confirmation together :-
1-Bollinger band breakout
2-Trendline breakout
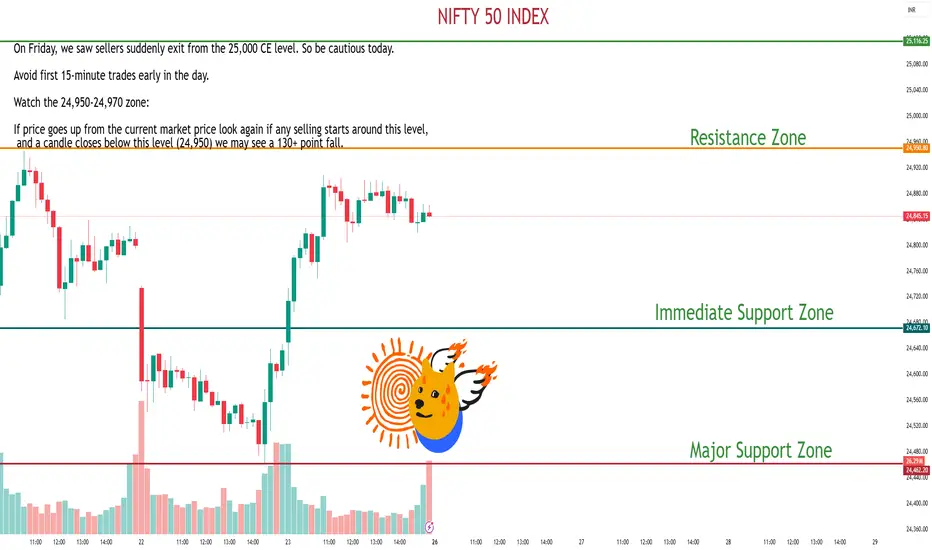
NIFTY 50 INDEXMarket View:
On Friday, we saw sellers suddenly exit from the 25,000 CE level. So be cautious today.
Avoid first 15-minute trades early in the day.
Watch the 24,950-24,970 zone:
If price goes up from the current market price look again if any selling starts around this level, and a candle closes below this level (24,950) we may see a 130+ point fall.
But if 24,950 holds and the 30-minute chart shows higher highs, the market could move up towards 25,120-25,200.
Divergence SecretsDivergence moves in the opposite direction of the technical indicator.
Divergence occurs when there is a high probability of price retracement.
Divergence analysis is recommended only if you observe double top, double bottom, higher high, and lower low formation.
