Advanced Technical Analysis: A Comprehensive Guide1. Principles of Advanced Technical Analysis
At its core, technical analysis is based on three main principles:
Price Discounts Everything: All information — news, fundamentals, market sentiment — is reflected in the price. Advanced TA accepts this as a foundation, emphasizing price action over external factors.
Price Moves in Trends: Markets trend in three ways — uptrend, downtrend, and sideways. Advanced analysis focuses on identifying the start and end of these trends with precision using sophisticated tools.
History Repeats Itself: Patterns, behaviors, and psychology tend to repeat due to human nature. Advanced TA uses pattern recognition and statistical methods to capitalize on these repetitive behaviors.
Advanced TA combines these principles with quantitative methods and behavioral insights to increase accuracy.
2. Advanced Chart Patterns
While basic patterns include head and shoulders, double tops, and triangles, advanced patterns are more nuanced:
Harmonic Patterns: These patterns, like the Gartley, Butterfly, Bat, and Crab, use Fibonacci ratios to identify precise reversal zones. Unlike basic patterns, harmonic patterns offer a mathematically-defined framework for entry and exit.
Elliott Wave Theory: Developed by Ralph Nelson Elliott, this theory identifies recurring waves in price movement — impulsive (trend-following) and corrective (counter-trend) waves. Advanced traders use Elliott Wave to forecast multi-timeframe trends and market cycles.
Market Profile: This tool analyzes the distribution of traded volume at different price levels to identify value areas, points of control, and price acceptance zones. Market Profile is highly useful for intraday and institutional trading strategies.
3. Advanced Technical Indicators
Beyond moving averages and RSI, advanced traders rely on more sophisticated indicators:
Ichimoku Kinko Hyo: Often called the “one-glance indicator,” it provides support, resistance, trend direction, and momentum in one chart. The Kumo (cloud) identifies trend strength and potential reversals.
Fibonacci Extensions & Retracements: Advanced traders use Fibonacci levels not just for retracements, but for projecting price targets and stop-loss levels. Confluences with other indicators improve accuracy.
MACD with Histogram Divergence: While the basic MACD identifies trend and momentum, analyzing divergences between MACD and price uncovers early reversal signals.
Volume-based Indicators: Tools like On-Balance Volume (OBV), Chaikin Money Flow (CMF), and Volume Price Trend (VPT) help identify accumulation or distribution phases, indicating potential breakouts or breakdowns.
Adaptive Indicators: Indicators like Adaptive Moving Average (AMA) and Kaufman’s Efficiency Ratio adjust to market volatility, providing a more responsive approach than static indicators.
4. Multi-Timeframe Analysis
Advanced traders rarely rely on a single timeframe. Multi-timeframe analysis involves examining multiple chart intervals — from monthly to intraday — to identify trends and align trades with higher-probability setups. Key principles include:
Top-Down Approach: Start with a higher timeframe to identify the major trend, then use lower timeframes to refine entries and exits.
Timeframe Confluence: Trades are stronger when multiple timeframes agree on trend direction, support/resistance, and momentum.
Fractal Patterns: Price movements repeat across timeframes, allowing traders to anticipate behavior in smaller or larger scales using fractal analysis.
5. Advanced Price Action Techniques
Price action analysis is the study of raw price behavior without relying heavily on indicators. Advanced techniques include:
Order Flow Analysis: Examining the flow of buy and sell orders in real-time markets to understand institutional activity and anticipate price moves.
Candlestick Confluence: Combining multiple candlestick patterns across higher and lower timeframes to validate reversals or continuation signals.
Support/Resistance with Precision: Using historical highs/lows, pivot points, Fibonacci levels, and volume clusters to identify high-probability zones for entries and exits.
Trend Exhaustion Signals: Recognizing signs of overextension, like long wicks, shrinking volume, or divergence in oscillators, to anticipate reversals.
6. Quantitative and Statistical Methods
Professional technical analysis increasingly incorporates quantitative methods:
Statistical Indicators: Bollinger Bands, Standard Deviation Channels, and Keltner Channels help identify volatility, mean reversion, and breakout points.
Correlation Analysis: Examining how assets or indices move in relation to each other to hedge or amplify trades.
Backtesting and Algorithmic Validation: Advanced traders validate strategies using historical data, Monte Carlo simulations, and statistical models to measure risk and probability of success.
7. Risk Management and Trade Psychology
Advanced technical analysis is incomplete without rigorous risk management:
Position Sizing: Using volatility, ATR, or percentage-based methods to determine trade size.
Stop-Loss Placement: Placing stops beyond key support/resistance, volatility levels, or pattern invalidation points.
Reward-to-Risk Optimization: Targeting trades with at least a 2:1 or 3:1 reward-to-risk ratio ensures long-term profitability.
Psychological Discipline: Advanced traders maintain emotional control, avoid overtrading, and adhere strictly to plan-based trading.
8. Integration with Fundamental and Sentiment Analysis
Though TA focuses on price, advanced practitioners often combine it with fundamental and sentiment insights:
Macro Events: Interest rates, earnings, or geopolitical developments can amplify technical setups.
Market Sentiment Indicators: Commitment of Traders (COT) reports, VIX index, and news sentiment can provide context to technical signals.
Confluence Approach: Trades with alignment between technical setups, fundamental catalysts, and market sentiment tend to have the highest probability.
9. Algorithmic and Machine Learning Approaches
Modern advanced technical analysis increasingly incorporates algorithmic trading and AI:
Pattern Recognition AI: Machine learning models can detect complex chart patterns faster and more accurately than humans.
Predictive Analytics: Using historical price, volume, and alternative data to predict probabilities of trend continuation or reversal.
Automated Execution: Advanced traders often use bots and automated scripts to execute trades when conditions are met, reducing emotional bias and ensuring precision.
10. Key Takeaways
Advanced technical analysis is more than chart reading; it is an integrated science of price, volume, momentum, and psychology. Key principles for mastery include:
Understanding multi-timeframe trends.
Combining advanced indicators, harmonic patterns, and Elliott Wave.
Using quantitative validation and backtesting for strategy reliability.
Integrating price action with institutional order flow and sentiment data.
Implementing strict risk management and psychological discipline.
By combining these tools, techniques, and analytical frameworks, traders can increase the probability of success, adapt to changing market conditions, and make informed decisions beyond simple guesswork. Advanced technical analysis is not about finding “guaranteed” trades but about stacking probabilities in your favor.
Technical_analysis
Mastering Technical Analysis1. Understanding the Foundation of Technical Analysis
Technical analysis is based on three core assumptions:
Price discounts everything – All known information, including fundamentals, news, and market sentiment, is already reflected in the price.
Prices move in trends – Markets tend to trend, and once a trend is established, it is more likely to continue than reverse.
History tends to repeat itself – Human behavior in markets is consistent, leading to recurring patterns.
Mastering technical analysis starts with internalizing these principles and learning to trust price behavior over opinions or predictions.
2. Market Structure and Price Action
At the heart of technical analysis lies price action—the direct study of price movement without excessive indicators. Understanding market structure involves identifying:
Higher highs and higher lows (uptrend)
Lower highs and lower lows (downtrend)
Sideways or range-bound markets
Support and resistance levels are crucial. Support is where demand overcomes supply, while resistance is where selling pressure dominates. These levels often act as decision zones where price reacts sharply.
Candlestick analysis enhances price action reading. Patterns such as doji, engulfing, hammer, and shooting star reveal shifts in market sentiment. Mastery comes from observing these candles in context—not in isolation.
3. Chart Patterns and Their Psychology
Chart patterns visually represent market psychology. Some of the most powerful patterns include:
Trend continuation patterns: flags, pennants, rectangles
Reversal patterns: head and shoulders, double top/bottom, rounding formations
Consolidation patterns: triangles and ranges
Each pattern reflects a battle between buyers and sellers. For example, a head and shoulders pattern signals weakening buying pressure after repeated attempts to push price higher. Mastery lies in recognizing these patterns early and confirming them with volume and price behavior.
4. Technical Indicators: Tools, Not Crutches
Indicators are mathematical calculations derived from price and volume. While useful, over-reliance can create confusion. Mastery means choosing a few complementary indicators:
Trend indicators: Moving averages, ADX
Momentum indicators: RSI, MACD, Stochastic
Volume indicators: Volume profile, OBV
Volatility indicators: Bollinger Bands, ATR
For example, RSI helps identify overbought and oversold conditions, but it works best when aligned with trend direction. Indicators should confirm what price action already suggests, not contradict it.
5. Time Frame Analysis and Top-Down Approach
Professional traders analyze multiple time frames. This top-down approach begins with higher time frames to identify trend direction and key levels, then moves to lower time frames for precise entries.
Higher time frames show trend and structure
Lower time frames show entry and exit precision
This alignment reduces false signals and improves consistency. Mastery involves respecting the dominant trend while timing trades efficiently.
6. Volume and Market Participation
Volume validates price movement. A breakout supported by strong volume has higher reliability than one without participation. Key volume concepts include:
Volume expansion during breakouts
Volume divergence during trend exhaustion
Accumulation and distribution phases
Understanding volume reveals whether institutions are entering or exiting positions. Master traders follow volume because it reflects real commitment, not just price fluctuations.
7. Risk Management: The Core of Mastery
No technical analysis system works without solid risk management. This includes:
Defining risk per trade (usually 1–2% of capital)
Using stop-loss orders logically (below support or above resistance)
Maintaining favorable risk-reward ratios (minimum 1:2)
Mastering technical analysis is less about winning every trade and more about controlling losses. Consistency in risk management separates professionals from amateurs.
8. Trading Psychology and Discipline
Even the best analysis fails without emotional control. Fear, greed, and impatience distort decision-making. Master traders develop:
Discipline to follow rules
Patience to wait for confirmation
Emotional neutrality after wins and losses
A trading journal is a powerful tool. Recording setups, emotions, and outcomes helps identify behavioral patterns and refine strategy over time.
9. Backtesting and Continuous Improvement
Technical mastery requires constant refinement. Backtesting strategies on historical data builds confidence and highlights weaknesses. Markets evolve, and strategies must adapt.
Learning from losses, adjusting parameters, and staying aligned with market conditions ensure long-term growth. Mastery is not a destination—it is a continuous learning process.
10. Integrating Technical Analysis with Market Context
While technical analysis focuses on charts, awareness of broader market context enhances accuracy. Economic events, sector trends, and inter-market correlations influence price behavior. A technically strong setup aligned with favorable market conditions carries higher probability.
Conclusion
Mastering technical analysis is a blend of art and science. It requires deep understanding of price behavior, disciplined risk management, emotional control, and continuous learning. There is no perfect indicator or pattern, but there is consistency in approach. Traders who respect probability, manage risk, and stay adaptable ultimately succeed. Technical analysis is not about predicting markets—it is about preparing for them with clarity, structure, and confidence.

Nifty Near at Make-or-Break ZoneNifty is currently trading near a highly sensitive decision area on the 1-hour timeframe, where a rising support trendline is intersecting with a short-term corrective structure. Price has already formed a sequence of higher highs and higher lows in the recent swing, indicating that the broader intraday trend is still bullish. However, repeated rejection from the rising resistance zone near the recent highs suggests that buyers are losing momentum at higher levels.
The marked “make-or-break” zone around the 26,000–26,050 area is extremely important. This region is acting as a dynamic support, backed by the rising trendline and previous demand. As long as Nifty holds above this support and shows a bullish reaction, a bounce toward the 26,300–26,450 resistance zone remains possible. A sustained move above this resistance would confirm trend continuation and open the path for further upside in the short term.
On the flip side, if Nifty fails to hold this support zone and breaks decisively below it, the structure will weaken significantly. Such a breakdown would invalidate the higher-low formation and could trigger a sharper corrective move toward the 25,700–25,600 area, as indicated by the projected downside path. This would signal a shift from trend continuation to a deeper pullback or short-term trend reversal.
Overall, Nifty is at a point where patience is crucial. Directional clarity will emerge only after price either holds and bounces from the current support or breaks down convincingly below it. Traders should avoid anticipation and wait for confirmation, as this zone is likely to decide the next meaningful intraday move.

[INTRADAY] #BANKNIFTY PE & CE Levels(05/01/2026)A gap-up opening is expected in Bank Nifty, with price opening near the 60,150–60,200 zone, indicating continuation of bullish momentum from the previous session. The index has successfully moved above the psychological 60,000 mark, which now acts as a strong short-term support. Overall structure remains positive, and as long as Bank Nifty holds above this base, the bias stays bullish.
On the upside, a sustained move above 60,550 will be the key trigger for further upside expansion. Holding above this level can activate fresh buying, with upside targets placed at 60,750, 60,850, and 60,950+. Additionally, intraday pullbacks toward the 60,050–60,100 zone can be considered as buy-on-dip opportunities, targeting 60,250, 60,350, and 60,450+.
On the downside, if the index fails to sustain above 60,000 and slips below 59,950, short-term profit booking may emerge. In such a case, selling positions can be considered with downside targets at 59,250, 59,150, and 59,050. Until a clear breakdown occurs, traders should continue to favor buy-on-dips and breakout-based trades, maintaining strict risk management and trailing stops to protect profits.

XAUUSD H1 – Double Tap Liquidity & Reentry Setup🕊️ Market Context
Gold just delivered a beautiful liquidity sweep from the highs at 4148, after multiple CHoCH–BMS transitions confirmed structural bullish intent.
We are now seeing price forming equal lows, tapping the buy zone (4090–4085) — a clean H1 demand block aligned with the 0.618 retracement.
💎 Technical Analysis (SMC Perspective)
Structure:
Higher-timeframe structure remains bullish, following multiple BMS breaks to the upside.
Current pullback is corrective — a typical liquidity sweep to rebalance inefficiency.
BUY ZONE: 4090 – 4085 (SL 4080)
→ H1 Demand (OB) + 0.618 Fib confluence.
→ Watching for M15 CHoCH confirmation before entering long.
Target: 4148
→ Buy-Side Liquidity (BSL) resting above previous highs — likely magnet for the next push.
🪶 Trading Plan
I’ll wait patiently for a clean sweep + M15 confirmation around 4085–4090 to re-enter long.
As long as price respects 4080, my bias remains bullish, targeting the next BSL @ 4148.
No trade if price fails to confirm on lower timeframe — patience over impulse. 💛
💭 Karina’s Note
This setup perfectly reflects the essence of SMC — liquidity engineering before continuation.
It’s not about catching every move; it’s about aligning with the story the market is telling.
This is my personal view based on SMC principles – not financial advice.
✨ Like & Follow for daily London session updates ✨

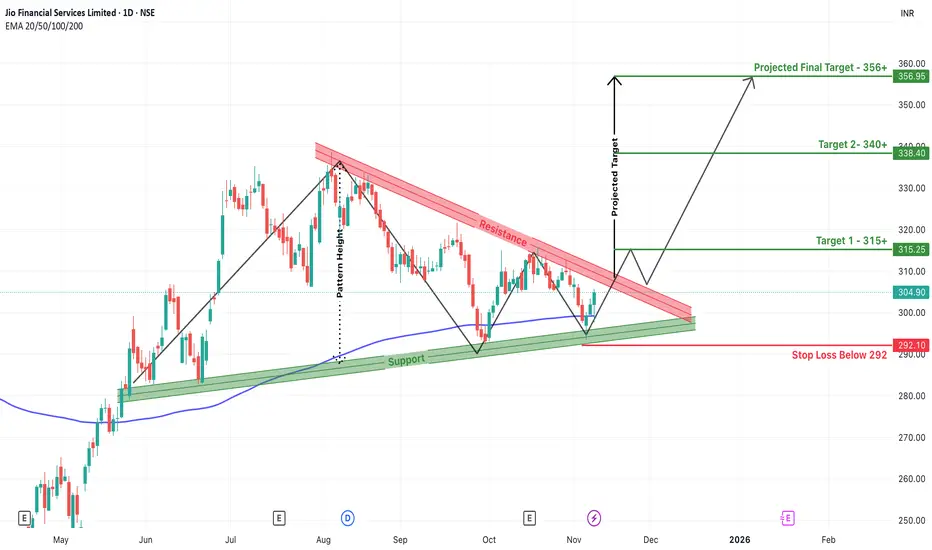
Jio Financial Breakout Watch –Wedge Setup Points to ₹356+ TargetJio Financial Services is currently presenting an exciting opportunity on the charts, with a wedge breakout setup forming after months of consolidation. A wedge is a bullish pattern that typically signals a reversal or continuation of an uptrend, especially when supported by rising volumes and strong market sentiment.
The price has been compressed within a narrowing wedge since August, bouncing between a down-sloping resistance zone and a strong ascending support zone. Each dip has been met with higher lows, indicating strong accumulation near the base of the wedge. The recent price action around ₹300 shows a strong bullish candle attempting to break out of the wedge resistance — a sign of growing buyer interest.
What strengthens this setup is the support confluence with 200 EMA and the lower wedge support. The 200 EMA near ₹299 has particularly held firm, and the breakout is emerging just above it — a healthy technical signal.
If the breakout sustains, we can expect a multi-leg bullish move with:
Target 1: ₹315+
Target 2: ₹340+
Final Target Projection: ₹356+
These targets are calculated based on the height of the wedge, which is then projected upwards from the breakout point. The price structure suggests a potential for an impulsive rally once the wedge breakout is fully confirmed on daily closing.
On the downside, a strict stop loss below ₹292 has been defined — any close below this zone would invalidate the bullish pattern and suggest a deeper retracement. This stop aligns just beneath the key support zone, keeping the risk-reward ratio favorable for positional traders.
In conclusion, Jio Financial is at a critical technical juncture. A confirmed breakout above the wedge could unlock substantial upside toward ₹356+, while maintaining disciplined risk management below ₹292 remains essential. Watch the breakout candle and follow-up volume closely — it could be the start of a new trend leg.
Nifty 50 | Head &Shoulders Pattern – A Breakdown Ahead?Hello everyone! I hope you all are doing great in life and in your trading . Today, I have brought an in-depth analysis of Nifty 50, focusing on a powerful Head & Shoulders pattern that is currently forming on the charts. This pattern is known for signaling a bearish reversal, which increases Supply in the market pushing prices downside. If this pattern plays out as expected, we could witness a strong Downside move in the coming sessions.
Currently nifty is trading at 23,340 levels Where previously buyers had shown interest pushing the market gap up following this pattern is selling pressure these buyers could Exit their position Pushing prices to 23,232 (Target 2) and 23,134 (Target 3).
Disclaimer:-This analysis is for educational purposes only. Please trade responsibly and consult a financial advisor before making any decisions.
If you found this analysis helpful, don’t forget to like, follow, and share your thoughts in the comments below! Your support keeps me motivated to share more insights. Let’s grow and learn together—happy trading!

Technical Analysis of Gopal Snacks Ltd....TRADE FOR LATERINVEST BEFORE READ CAREFULLY / TAKE TRADE ON YOUR OWN RISK
RISK~REWARD PROFILE = 5.91:1
NSE:GOPAL SANEKS Technical chart Observations:-
~Price Correction:-
The stock corrected around 29%, possibly due to the negative news (fire in a warehouse).
The price appears to be approaching a strong psychological support level at ₹335.
~Pattern Formation:-
A potential Head and Shoulders pattern is visible, signaling a bearish reversal that already played out.
The price dropped significantly post-pattern completion.
~Support Level:-
Key support is around ₹322.80, which is highlighted as the entry point for a possible bounce.
Stop-loss (SL) is marked at ₹304.50 to limit downside risk.
~Target Levels (TP):-
~TP1: ₹362.30
~TP2: ₹386.35
~TP3: ₹430.95
~Volume:-
The trading volume on the recent downtrend is moderate, indicating cautious selling.
~Trend:-
Currently in a downtrend but nearing a critical psychological support zone.
Trading Strategy:
Wait for Confirmation: Enter the trade only if the price shows a clear bounce or reversal signs at the ₹322.80 level.
~Risk-Reward:-
Stop-loss: ₹304.50 (downside ~₹18.30 per share).
Target 1 (TP1): ₹362.30 (upside ~₹39.50).
Risk-reward ratio is favorable if TP1 is achieved.
~Notes:-
This is a counter-trend trade (going against the dominant downtrend), so caution is advised.
Monitor closely for any trend continuation or reversal indicators (e.g., candlestick patterns or volume spikes).
The highlighted targets (TP1-TP3) should be treated as milestones—book partial profits at each.
Final Note:
This chart suggests a well-structured trade setup, but execution depends on confirmation of price action near the support zone. Traders should monitor market sentiment, news updates, and technical signals before entering the trade.
Disclaimer:
I am not a SEBI-registered advisor. These levels are for educational purposes only. Please trade at your own risk. Consult a professional financial advisor for tailored advice. Like and share if you found this helpful!
LIKE,SHARE,SUBSCRIBE @Alpha_strike_trader

USOIL(h4) : Buy nowHello Traders,
📈 USOIL chart review :
- H4 candle has got a higher high swing -> trend
🎯In my trading opinion:
- Price will rise to retest zupply zone 78.00, so you can buy here with target R:R =1:1.5
📚 Remember that: Always follow your trading plan regarding entry, risk management, and trade management.
Good luck!

SJVN Analysis for Long Term!NSE:SJVN Analysis!
SJVN Analysis on a Daily Timeframe!
Triangle Pattern formation in SJVN!
Triangle Pattern Breakout in SJVN!
Analysis:
SJVN was trading in a Triangle pattern. Yesterday it gave a powerful breakout to its resistance line with significant amount of volume. Also consider the 20, 50, 100 period EMA as these are also acting as a Support and Resistance as the price is respecting them it is moving ahead with them. Rest of the Analysis is on the chart itself please study it thoroughly.
Trade Setup:
Entry = Current price level is good to Enter but always enter 0.50rs above the previous day high.
Target = 226.64
Stop Loss = Below 136.11 or as per your Risk to Reward
Disclaimer = Consider my analysis for Educational Purpose only.
Before entering into any trade -
1) Educate Yourself
2) Do your research and analysis
3) Define your Risk to Reward ratio
4) Don't trade with full capital

INDIGO - Interglobe Aviation Ltd. - Break Out OpportunityDate : 5-Oct-2023
Rating : Buy
LTP : Rs. 2473.40
Target : Rs. 2745++
Exit Plan : Follow the 7D/13D EMA cross down on closing basis.
NSE:INDIGO has given a break out from its current short term down trend with high volume. Has closed above 20D MA. 7D EMA has crossed 13D EMA. RSI is above 50 and MACD has crossed over the signal line. All these indicates that NSE:INDIGO is ready to fly and further up move will be seen with a possibility of new lifetime high.
NSE:INDIGO can also be looked from long term perspective with a horizon of 3/5 years. Also time to accumulate more if already going long in this.
Disclaimer : I am not a SEBI registered analyst/consultant and not recommending anyone to take any BUY or SELL position in stock market. Investing in stock market is risky and one should do a self analysis and validation before investing in stock market.

ITC Ltd. - Double Break Out TradeDate : 11-Oct-2023
Rating : Buy
LTP : Rs. 448.25
Target: (1) Rs. 455, --> (2) Rs. 480, --> (3) Rs. 500
SL : Rs. 433
Exit Plan : Follow the 7D/13D EMA cross down on closing basis.
NSE:ITC has given double break outs. From its current short term down trend and from double bottom pattern. Have closed above 20D MA. EMA, MACD and RSI giving bullish sign with RSI giving positive divergence.
Disclaimer : I am not a SEBI registered analyst/consultant and not recommending anyone to take any BUY or SELL position in stock market. Investing in stock market is risky and one should do a self analysis and validation before investing in stock market.

Symmetrical Triangle Example using Adani EnterpriseNSE:ADANIENT has created a symmetrical triangle on the chart. Most of the time symmetrical triangle is created when stock is moving side ways (neither moving in up trend nor in down trend). Stock can move to any direction once it comes out of triangle hence it requires caution before placing trade. If stock breaks out (on upper side) than we may see up trend from that point. If stock breaks down (on lower side) than we may see down trend from that point.

Bullish flag pattern breakout in METROPOLIS HEALTHCAREMETROPOLIS HEALTHCARE LTD
Key highlights: 💡⚡
✅On 1 Day Time Frame Stock Showing Breakout of Bullish flag Pattern .
✅ Strong Bullish Candlestick Form on this timeframe.
✅It can give movement up to the Breakout target of 1715+.
✅Can Go short in this stock by placing a stop loss below 1385-.

Salasar Techno Engineering - Cup and Handle Pattern✔️Eveything mentioned in the chart.
You can see a Cup and Handle formation in the chart.
study then invest.
About The Company ✔️
Established in 2006 as a tower manufacturer, Salasar Engineering Limited, has emerged as a fast-growing Steel structure manufacturer & EPC infrastructure company, providing services across telecom, energy and railways sector.

BEL ,Trendline Breakout viewIt's my personal view.
This is for educational purpose only.
This is not buying or selling recomendations.
I am not sebi registerd.

Finolex cables at Breakout level On weekly chartFinolex cables Trading at Rs 531 at Breakout level On weekly chart,
If it break it will be going to be multiyear breakout
Must be on your watchlist..
Do your analysis before take a trade

HG INFRA Technical Analysis HG INFRA Technical Analysis , from last six week looks strong chart , and it is strength showing from after long consolidation. Discl : Do your own study , this is not buy hold or sell recommendation , only for educational purpose only.

USDJPY Sell trade opportunitiesUSDJPY Sell trade opportunities
The pair is currently in a retracement, which provides an opportunity to sell the resistance level as we mark on the chart waiting for the market for a good entry.

Analysis of Sat Industries LtdNSE:SATINDLTD
SAT is engage in many business manufacturing, education, leasing, finance, investments, domestic trading, import & export.
Fundamental Analysis
Leading exporters of FIBCs, PP Bags, fabrics and Box bags with exports spread across 28 countries , including USA, Italy, France, Portugal, Greece and UAE.
Company's 3 YEARS OR 5 YEARS Sales 15.4% OR 28.3% ,
Debt/Equity Ratio -0.4% ,
Debt/EBITDA - 1.5% ,
Interest coverage ratio - 7.4 Time ,
Inventory days & Receivable days are higher than 5 year's back.
From 2018 ROCE is getting better ~ 22%
From 2018 ROE is getting better ~ 18%
Technical Analysis
On the charts the stock breakout strongly Rectangle pattern. With good volumes. Now making you all time highs.
User’s of this server are expected not to misread it directly or indirectly as any buy/sell recommendations. We are not SEBI Registered Investment Advisor & Research Analyst. Do Consult your financial advisor before taking any trading or investing decisions.
Please consider the Risk involved in equity markets. We do not take any responsibility for your profit or loss.

[INTRADAY] #BANKNIFTY PE & CE Levels (27/12/2022)Today will be slightly gap up opening in BANKNIFTY. After opening if banknifty sustain above 42550 this level then possible upside rally of 400-500 points upto 42950 Level. And this rally can extend for another 400 points if it gives breakout of 43050 level. Any downside only expected in case banknifty starts trading below 42450 level.

Chart of the weekChart of the week is Siemens. It is going to breakout after long consolidation in a " W" pattern.
It is a long call if it crosses 2690

Breakout on Apollo TyreIn this chart, I have found a breakout on Apollo Tyre. price faced resistance the market zone on Sep and Nov. Hence, these zones are now to be treated as important support zone. But still it is a simple analysis only and not an recommendation. Please do trading / investing with your own respnsibility. This post is only for educational purpose.
