Unlocking Chart Vision: Why One Breakout Isn’t EnoughRetail traders often gravitate towards the familiar—you’ll notice on the right chart, a classic breakout above the counter trendline (CT) is the “go-to” setup most focus on. This approach is common, but it can signal limited experience or a lack of exposure to complex, multi-pattern scenarios.
As a full-time trader, my scanning process involves viewing charts through a multi-pattern lens, not just relying on a single breakout narrative. On the left chart, you’ll spot another prominent CT in red—this additional hurdle isn’t always visible to less experienced eyes. Notably, a hidden parallel channel (orange) adds further nuance, underscoring the importance of assessing every structure before deciding on bias or trade management.
This post is purely observational—there’s no forecasting or trade advice here. The goal is to highlight why expanding your pattern recognition toolkit and investing more screen time can reveal deeper price action dynamics often missed in simplistic approaches. If you want to bring your technical analysis to a professional level, start looking for what’s not immediately obvious!
Technical Analysis

Gold Holding Above 4100$ Market Prepares for Next Wave ExpansionGold continues to sustain momentum above 4,100$, maintaining its bullish market structure as traders price in expectations of a Fed rate cut in December.
While the US Dollar shows brief recovery, the underlying flow still supports safe-haven demand — especially as global risk sentiment remains fragile and the US government moves closer to reopening.
📊 Technical Overview (H1 – MMFLOW Structure)
Price is currently consolidating within the 4,108$–4,113$ liquidity pocket, where prior breakout demand aligns with short-term Fibonacci retracement (0.382–0.5).
This zone continues to attract buy-side liquidity, suggesting accumulation rather than exhaustion.
As long as 4,085$ remains protected, the bias stays bullish toward 4,172$ – 4,203$ (Fibo 1.272–1.618). However, failure to break above 4,172$ may trigger a short-term reaction sell before the next impulsive leg resumes.
🎯 Trading Plan – MMFLOW Setup
🌸 BUY Scenario (Liquidity Retest)
Buy Zone: 4,086 – 4,084
Stop Loss: 4,080
Targets: 4,090 → 4,095 → 4,100 → 4,110 → 4,120 → 4,130 → 4,150+
🔥 SELL Scenario (Short-Term Reaction Zone)
Sell Zone: 4,172 – 4,174
Stop Loss: 4,180
Targets: 4,165 → 4,160 → 4,150 → 4,140 → 4,130 → 4,120
🧠 MMFLOW TRADING Insight:
“Price is language — liquidity is intent. The market is not random; it’s engineered to test conviction before expansion.”
Bias remains bullish above 4,085$ – any dip into the liquidity base could offer the last accumulation before the next breakout.

XAUUSD / GOLD Analysis – Buy Opportunity Ahead!Gold has formed a strong double-bottom support zone at 4095 – 4090, signaling potential bullish momentum. As long as Gold remains above 4080, the bias stays bullish for short-term buyers.
🧭 Trading Plan:
Buy Zone: 4095 – 4090
Stop Loss: Below 4080 (close basis)
Targets: 🎯 4010, 4030, 4040
💡 Technical Reasoning:
Double-bottom pattern confirmation on 1H/4H timeframe
RSI bouncing from oversold area
Price rejecting key support zone multiple times
Potential bullish divergence forming
⚠️ Risk Management:
Always use proper risk-to-reward management and position sizing. Gold can move fast during high volatility sessions — keep your stops tight and targets realistic.
🔔 Conclusion:
If Gold holds above 4080, buyers could dominate the next leg. Watch price action closely near 4095 – 4090 for entry confirmation.

NATIONAL ALUMINUM ( W ) ROUNDING PATTERN BREAKOUT● Add Your Watchlist ●
📊 Chart to Study For Swing Trading
➡️ STOCK NAME : National Aluminum
▫️Date : 12.11.25
🔸️ Pattern : Rounding Pattern
🔸️Timeframe : Weekly
🔸️Strongly Volume Sathe Brekout
Note : Weekly Candel બંધ નથી થઈ તો બ્રેકઆઉટ જાવળી રાખે તો એંટ્રી કરી શકાય
🔴 Chart is Only For Education Purpose

#NIFTY Intraday Support and Resistance Levels - 12/11/2025Nifty is expected to open with a gap up near the 25,700–25,750 zone, continuing its positive momentum from the previous sessions. The index is approaching a crucial resistance zone, and a sustained move above this level may trigger further upside momentum.
If Nifty sustains above 25,750–25,800, traders can look for long opportunities, with potential upside targets at 25,850, 25,900, and 25,950+. A breakout beyond 26,000 could extend the rally toward 26,150–26,250, signaling a shift into a stronger bullish phase.
On the downside, support lies near 25,700, and below that, 25,600–25,500 will act as a strong demand zone. A break below 25,700 could trigger short-term profit booking toward lower supports.
Overall, with a gap up opening, market sentiment remains bullish, but traders should monitor whether Nifty can sustain above 25,750. Failing to hold this level could lead to range-bound movement or mild retracement, while sustained strength may confirm a fresh breakout toward 26,000+.

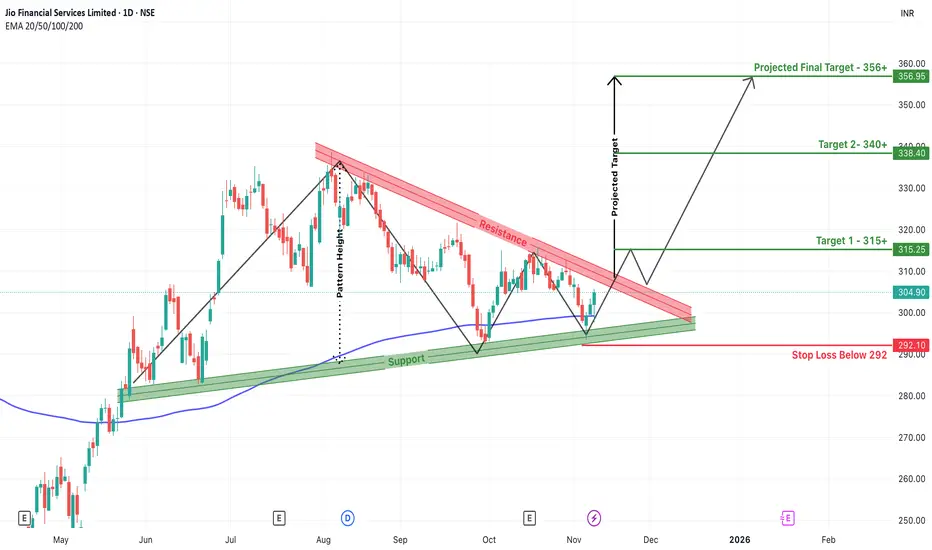
Jio Financial Breakout Watch –Wedge Setup Points to ₹356+ TargetJio Financial Services is currently presenting an exciting opportunity on the charts, with a wedge breakout setup forming after months of consolidation. A wedge is a bullish pattern that typically signals a reversal or continuation of an uptrend, especially when supported by rising volumes and strong market sentiment.
The price has been compressed within a narrowing wedge since August, bouncing between a down-sloping resistance zone and a strong ascending support zone. Each dip has been met with higher lows, indicating strong accumulation near the base of the wedge. The recent price action around ₹300 shows a strong bullish candle attempting to break out of the wedge resistance — a sign of growing buyer interest.
What strengthens this setup is the support confluence with 200 EMA and the lower wedge support. The 200 EMA near ₹299 has particularly held firm, and the breakout is emerging just above it — a healthy technical signal.
If the breakout sustains, we can expect a multi-leg bullish move with:
Target 1: ₹315+
Target 2: ₹340+
Final Target Projection: ₹356+
These targets are calculated based on the height of the wedge, which is then projected upwards from the breakout point. The price structure suggests a potential for an impulsive rally once the wedge breakout is fully confirmed on daily closing.
On the downside, a strict stop loss below ₹292 has been defined — any close below this zone would invalidate the bullish pattern and suggest a deeper retracement. This stop aligns just beneath the key support zone, keeping the risk-reward ratio favorable for positional traders.
In conclusion, Jio Financial is at a critical technical juncture. A confirmed breakout above the wedge could unlock substantial upside toward ₹356+, while maintaining disciplined risk management below ₹292 remains essential. Watch the breakout candle and follow-up volume closely — it could be the start of a new trend leg.
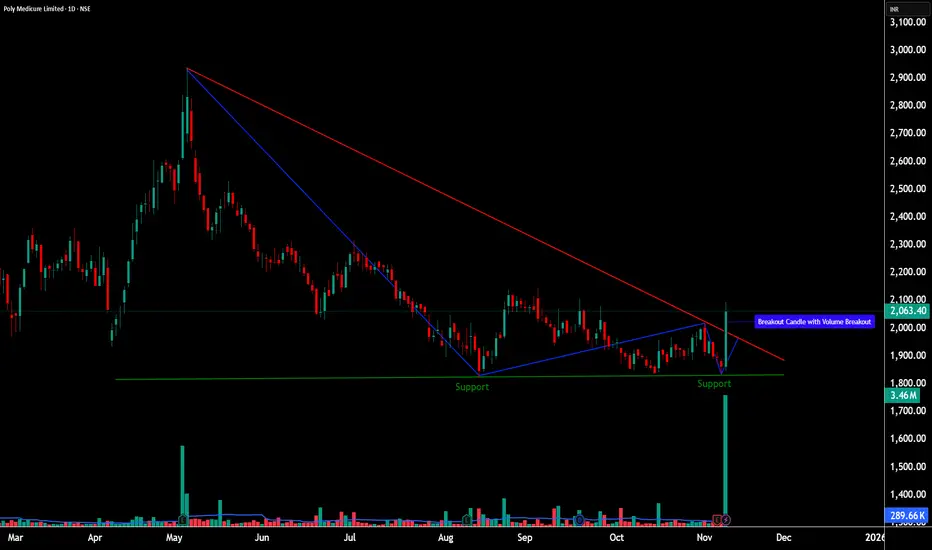
POLYMED - Breakout from Descending Triangle with Volume💹 Poly Medicure Ltd (NSE: POLYMED)
Sector: Healthcare & Diagnostics | CMP: ₹2,063.40 | View: Descending Triangle Breakout + 52-Week Volume Expansion
📊 Price Action
Poly Medicure finally broke out from a six-month descending structure with a sharp bullish candle. The move came after sustained compression near ₹1,800–₹1,850 support and resulted in a clean trendline breakout with the highest daily volume of the year.
Chart Pattern: Descending Triangle (Breakout in Progress)
Candlestick Pattern: Bullish Engulfing (Formed at Lower Boundary of Triangle – Base Support Zone ₹1,800–₹1,850)
📈 STWP Trading Analysis
STWP Trade Setup
Bullish Breakout: ₹2,094.30
Stop Loss: ₹1,829.30
Possible Intraday Demand Zone: 1869.50 - 1850.20
Possible Swing Demand Zone: 1869.50 - 1832.90
Momentum: High
Volume: 52-week breakout
This marks the possible conviction zone — where price, pattern, and participation align perfectly.
🧭 Support & Resistance
Support 1: ₹1,908 – immediate retest zone
Support 2: ₹1,752 – mid-base accumulation area
Support 3: ₹1,659 – final demand base
Resistance 1: ₹2,156 – near-term resistance
Resistance 2: ₹2,249 – previous supply pocket
Resistance 3: ₹2,404 – key breakout target zone
🔢 Fibonacci Levels
Retracement from the ₹3,000 high to ₹1,700 low shows:
38.2% level: ₹2,160
50% level: ₹2,350
📈 Volume & Momentum Setup
RSI: back above 61 — momentum returning
MACD: bullish crossover with growing histogram
CCI: high but justified by volume expansion
The breakout candle printed the highest daily volume in a year, confirming institutional accumulation.
While the weekly chart remains in recovery mode, the daily structure is already in breakout alignment.
🧩 STWP Summary View
Momentum: Strong
Trend: Early Reversal Attempt
Volume: Extremely High
Risk: Moderate (Stop below ₹1,830)
Bias: Bullish above ₹2,100 | Neutral below ₹1,850
________________________________________
⚠️ Disclosure & Disclaimer – Please Read Carefully
This post is created purely for educational and informational purposes and does not constitute investment advice or a buy/sell recommendation.
I am not a SEBI-registered investment adviser. All observations are based on technical studies and publicly available information.
Trading and investing involve risk; please manage position size and stop-loss discipline as per your risk profile.
Always consult a SEBI-registered financial advisor before making trading decisions.
________________________________________
Position Status: No active position in (POLYMED) at the time of analysis.
Data Source: TradingView & NSE India
💬 Found this useful?
🔼 Boost this post if you value clean, structured analysis.
💭 Drop your views — can Torrent Pharma sustain this breakout above ₹3,835?
🔁 Share this with traders who track institutional breakouts.
👉 Follow for more price-action based institutional setups.
🚀 Stay Calm. Stay Clean. Trade With Patience.
Trade Smart | Learn Zones | Be Self-Reliant 📊
________________________________________
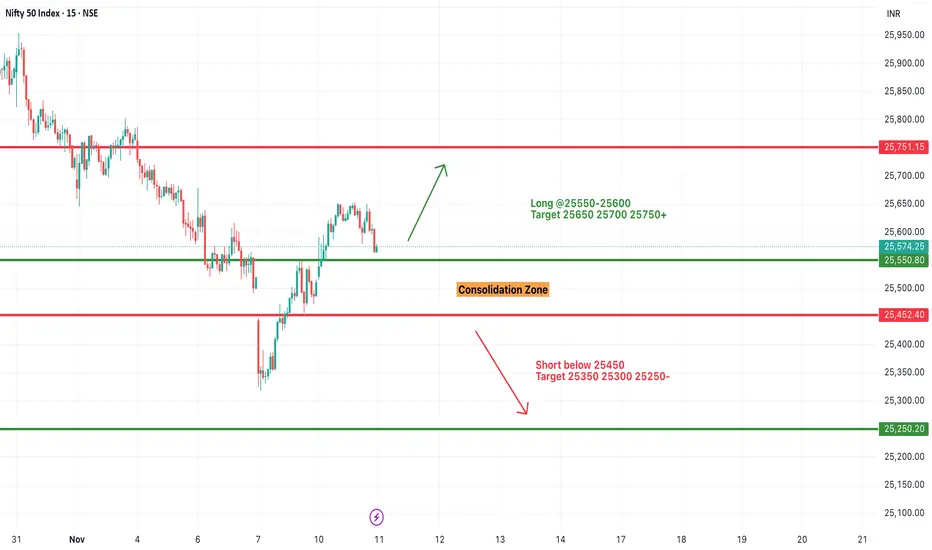
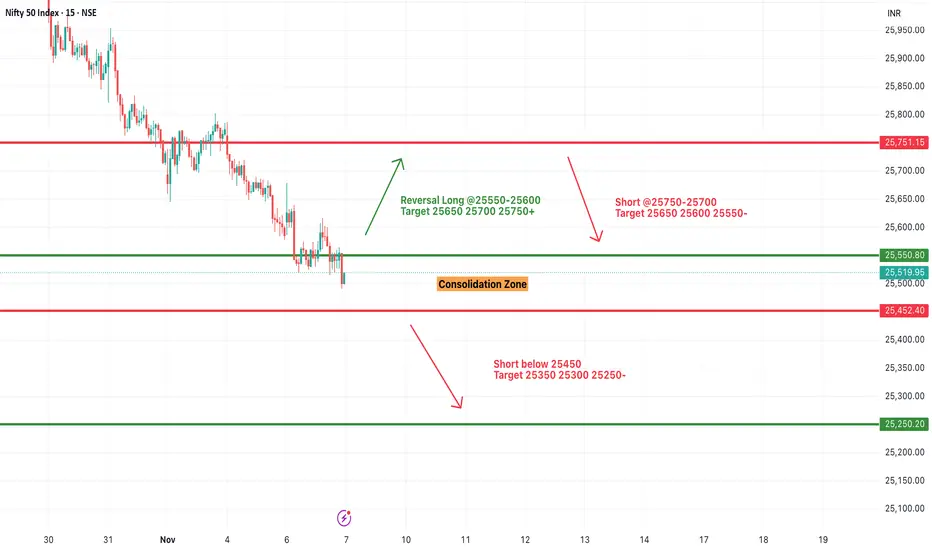
#NIFTY Intraday Support and Resistance Levels - 11/11/2025Nifty is likely to open flat near the 25,550–25,580 zone, with no major changes from yesterday’s levels. The index continues to trade within a tight consolidation range, reflecting indecision between buyers and sellers.
If Nifty sustains above 25,600, it may trigger a mild upside move toward 25,650, 25,700, and 25,750+, marking the upper boundary of the current consolidation phase. A breakout above 25,750 would be required to confirm fresh bullish momentum.
On the downside, support lies at 25,450, and a breakdown below this level could invite selling pressure toward 25,350, 25,300, and 25,250.
Overall, with a flat opening and stable levels, traders should expect sideways to range-bound price action in the first half. Momentum may build only after a decisive breakout above 25,600 or a breakdown below 25,450. Maintaining discipline with stop losses is key in such a narrow-range environment.
[INTRADAY] #BANKNIFTY PE & CE Levels(11/11/2025)Bank Nifty is expected to open flat near the 57,900 zone, indicating indecision after a few sessions of range-bound movement. The index is consolidating within a well-defined range where both buyers and sellers are actively defending key levels.
If Bank Nifty sustains above 58,050, it could trigger fresh buying momentum toward 58,250, 58,350, and 58,450+. A breakout beyond 58,450 will confirm a bullish continuation, opening the way toward higher resistance levels.
On the downside, immediate support lies near 57,900–57,850. A breakdown below 57,900 may invite weakness toward 57,750, 57,650, and 57,550 levels. Sustained trading below 57,550 could extend the fall toward 57,400–57,300.
Overall, with a flat opening, Bank Nifty is likely to remain in a sideways to mildly volatile range until a clear breakout occurs. Traders should focus on 58,050 for a bullish trigger and 57,900 for a bearish confirmation, keeping a tight stop loss on either side due to potential intraday whipsaws.

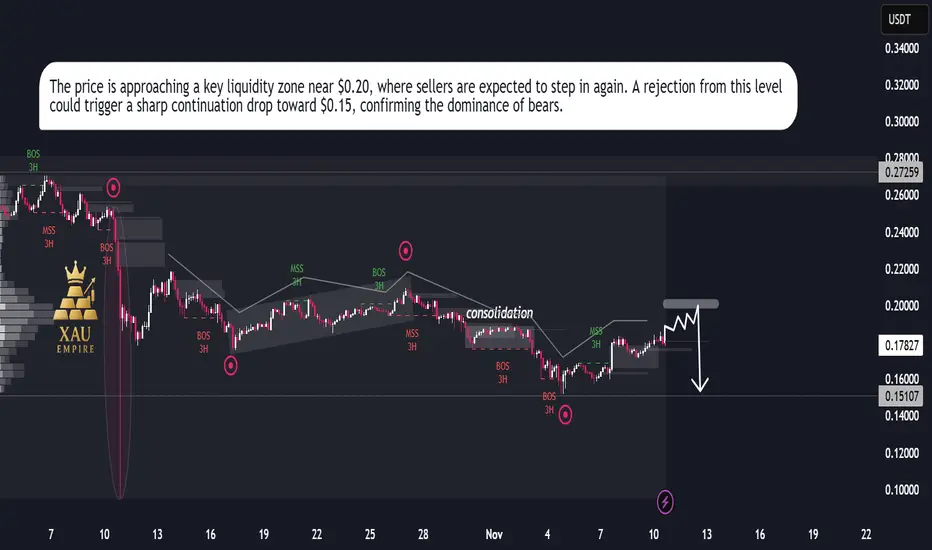
DOGEUSDT – Bearish Setup Toward $0.15DOGEUSDT – Bearish Setup Toward $0.15 📉
Dogecoin remains under strong bearish pressure, following multiple Breaks of Structure (BOS) and Market Structure Shifts (MSS) on the 3H timeframe. After a brief consolidation phase, price continues to respect the descending trend, indicating a lack of bullish strength.
Currently, DOGEUSDT is attempting a minor upward correction, likely to retest the $0.20 supply zone — a region that could act as a liquidity grab before the next major downside move. If price fails to hold above that zone, the market may trigger a sharp drop toward the $0.15 level, confirming continuation of the broader bearish trend.
Momentum remains weak, and sellers continue to dominate short-term rallies — suggesting further downside pressure in the coming sessions.
LATENTVIEWLATENTVIEW is looking good.
It gave breakout of an old resistance and then retested, EMAs are aligned, overall a bullish structure.
Now if it sustains above the trendline then there is probability of an upside move.
Keep it in your watchlist.
✅ If you like my analysis, please follow me here as a token of appreciation :)
in.tradingview.com/u/SatpalS/
📌 For learning and educational purposes only, not a recommendation. Please consult your financial advisor before investing.

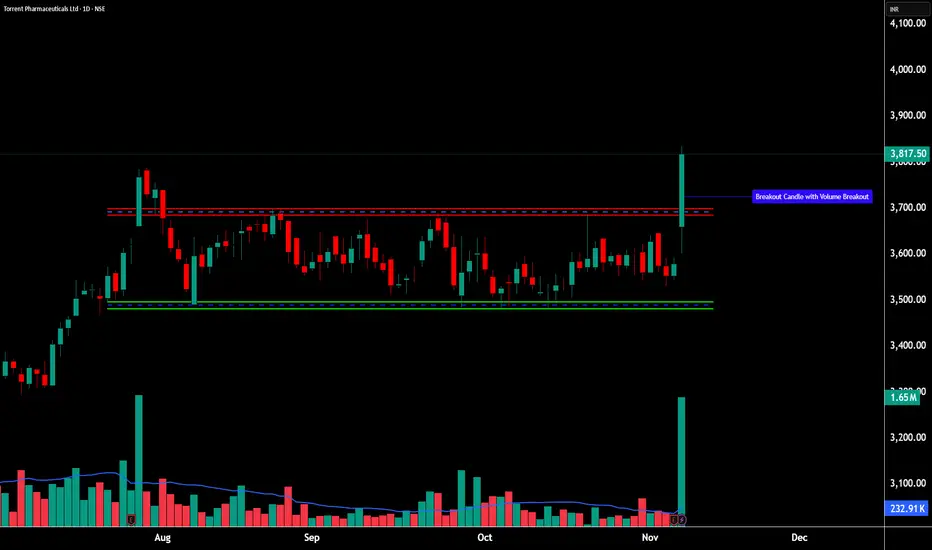
TORNTPHARM - 52-Week Breakout With Institutional Conviction________________________________________
💹 Torrent Pharmaceuticals Ltd (NSE: TORNTPHARM)
Sector: Pharmaceuticals | CMP: ₹3,817.50 | View: 52-Week Breakout With Institutional Conviction
________________________________________
📊 Price Action:
Torrent Pharma delivered a powerful 52-week breakout candle backed by exceptionally high volume, confirming strong institutional participation and renewed leadership momentum within the pharma space.
After consolidating for several weeks between ₹3,400–₹3,650, the stock broke through resistance with a wide-range bullish candle, signaling a structural shift from accumulation to expansion.
The follow-through strength and delivery volume highlight conviction buying, positioning Torrent Pharma for potential short- to medium-term trend continuation.
________________________________________
💼 HNI Trade Levels (STWP Setup):
Aggressive Entry: ₹3,817–₹3,835 | Stop Loss: ₹3,660
Low-Risk Entry: ₹3,770 | Stop Loss: ₹3,594.09
The breakout session recorded 1.65M shares vs 0.23M average, confirming institutional footprints.
Price structure has cleanly shifted into higher territory, with ₹3,665–₹3,700 now acting as the new demand base.
Sustaining above this zone keeps the bias firmly bullish with room for further upside extension.
________________________________________
📉 Chart Pattern Analysis – 52-Week Breakout (Institutional Structure):
Torrent Pharma has been in a multi-week compression phase, forming a tight base under the ₹3,700 resistance zone.
Such base formations often precede high-conviction institutional breakouts, and the explosive candle with volume confirmation validates that the breakout is not speculative but driven by genuine accumulation.
The move aligns with sectoral strength seen across quality pharma counters, where price action is transitioning from range-bound to trending behavior.
This breakout now places Torrent Pharma in the leadership bracket within the pharma index structure, supported by momentum and delivery expansion.
________________________________________
📈 STWP Trading Analysis:
Bullish Breakout: ₹3,817–₹3,835 | Stop Loss: ₹3,660.06
The breakout candle exhibited strong momentum with a 7x volume surge, indicating clear participation from institutions and long-only funds.
Price has decisively closed above short- and medium-term EMAs, confirming trend alignment across daily and weekly timeframes.
Holding above ₹3,665–₹3,700 will maintain the bullish bias, keeping the setup active toward ₹3,935–₹4,015 in the short term.
A sustained close above ₹3,935 can potentially open the next expansion leg toward ₹4,145 levels.
________________________________________
📈 Candlestick Structure – Bullish Strength Confirmation:
The breakout candle represents a strong bullish engulfing formation, signaling complete control by buyers.
The large body-to-wick ratio and volume expansion confirm institutional momentum entry rather than retail-driven strength.
Such candles following a multi-week base often mark early-stage uptrend resumption phases, where risk-to-reward remains highly favorable if trend levels hold.
________________________________________
📏 Fibonacci Analysis:
From swing low ₹3,079 to swing high ₹3,835:
61.8% retracement @ ₹3,436 → Major base support
50% retracement @ ₹3,457 → Structural accumulation zone
23.6% retracement @ ₹3,666 → Confirmed demand zone
Sustaining above the 23.6% level keeps the momentum firmly intact, while a clean close above ₹3,935 validates continuation toward ₹4,145–₹4,185 Fibonacci extension levels.
________________________________________
🧭 STWP Support & Resistance:
Resistances: ₹3,901 | ₹3,984 | ₹4,134
Supports: ₹3,667 | ₹3,518 | ₹3,344
The ₹3,665–₹3,700 area remains the immediate accumulation pocket, aligning with EMA support and Fibonacci confluence.
The breakout above ₹3,835 confirms strength, while supports around ₹3,500 represent deeper institutional demand zones.
________________________________________
📊 STWP Volume & Technical Setup:
Today’s session saw 1.65M shares traded vs 0.23M average, validating strong institutional accumulation and conviction buying.
Indicators confirm trend strength:
RSI (70+) – sustaining above bullish zone.
MACD – positive crossover maintained.
CCI & Stochastic – both elevated, reflecting momentum expansion.
Overall alignment across daily and weekly charts confirms trend continuation potential.
Trend Direction: UPTREND | Volume Confirmation: Strong Institutional Activity
________________________________________
🧩 STWP Summary View:
Final Outlook:
Momentum: Strong | Trend: Bullish | Risk: Moderate | Volume: High
Torrent Pharma’s breakout signifies a transition from accumulation to expansion, supported by clear institutional conviction and strong technical structure.
As long as the price sustains above ₹3,665–₹3,700, the bias remains bullish with targets toward ₹3,935–₹4,145 in the near term.
The setup continues to display a clean risk–reward framework within an evolving leadership trend in the pharma sector.
________________________________________
⚠️ Disclosure & Disclaimer – Please Read Carefully
This post is created purely for educational and informational purposes and does not constitute investment advice or a buy/sell recommendation.
I am not a SEBI-registered investment adviser. All observations are based on technical studies and publicly available information.
Trading and investing involve risk; please manage position size and stop-loss discipline as per your risk profile.
Always consult a SEBI-registered financial advisor before making trading decisions.
________________________________________
Position Status: No active position in (TORNTPHARM) at the time of analysis.
Data Source: TradingView & NSE India
💬 Found this useful?
🔼 Boost this post if you value clean, structured analysis.
💭 Drop your views — can Torrent Pharma sustain this breakout above ₹3,835?
🔁 Share this with traders who track institutional breakouts.
👉 Follow for more price-action based institutional setups.
🚀 Stay Calm. Stay Clean. Trade With Patience.
Trade Smart | Learn Zones | Be Self-Reliant 📊
________________________________________
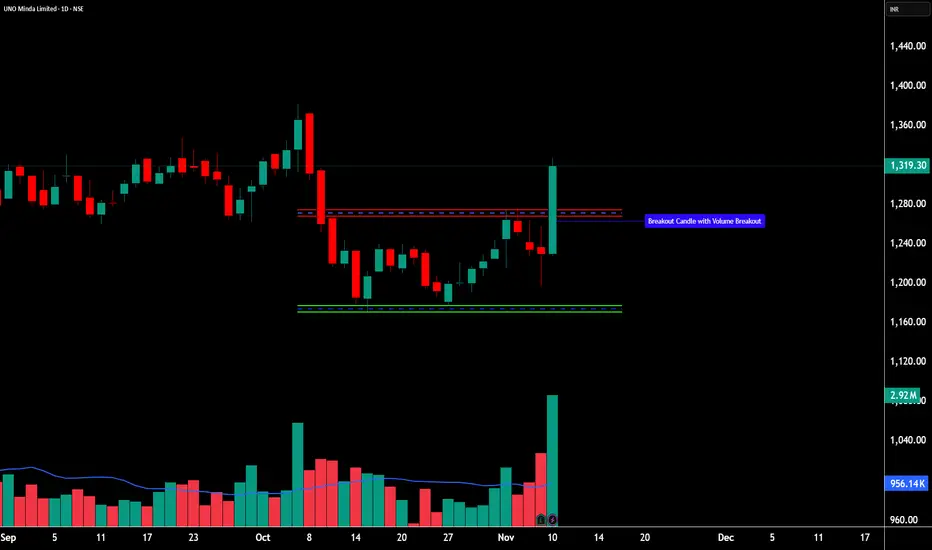
UNOMINDA - Institutional Breakout After Price Compression________________________________________
💹 UNO Minda Ltd (NSE: UNOMINDA)
Sector: Auto Components | CMP: ₹1,319.30 | View: Institutional Breakout After Price Compression
________________________________________
📊 Price Action:
UNO Minda has delivered a strong breakout candle after a prolonged phase of price compression within a rising channel, confirming a shift from consolidation to directional momentum.
The stock rebounded sharply from the ₹1,190 zone and pierced through the upper trendline with an exceptionally high volume spike, signaling renewed institutional interest.
This breakout structure now positions the stock for a potential continuation move as long as price sustains above the ₹1,255–₹1,270 support base.
________________________________________
💼 HNI Trade Levels (STWP Setup):
Aggressive Entry: ₹1,319–₹1,327 | Stop Loss: ₹1,238.57
Low-Risk Entry: ₹1,297 | Stop Loss: ₹1,210.74
The breakout candle recorded volume of 2.9M vs 0.95M average, confirming heavy accumulation and strong HNI participation.
The near-term momentum bias remains bullish, supported by both volume expansion and favorable price structure.
________________________________________
📉 Chart Pattern Analysis – Compression Breakout (Bullish Structure):
Over the past few weeks, UNO Minda formed a rising channel pattern characterized by narrowing ranges and lower volatility — a classic price compression structure.
This phase often precedes large directional moves, and the breakout above ₹1,310 confirms the volatility expansion phase.
Such structures typically indicate early-stage accumulation by institutional hands before momentum expansion begins.
The confirmation of breakout with both volume and candle strength reflects clear smart money participation.
________________________________________
📈 STWP Trading Analysis:
Bullish Breakout: ₹1,319–₹1,327 | Stop Loss: ₹1,195.20
The breakout candle displayed strong momentum and 3x volume expansion, validating aggressive buying from higher timeframes.
Price action has now closed firmly above short- and mid-term EMAs, aligning all major timeframes — Daily, Weekly, and Monthly — in a unified uptrend.
Holding above ₹1,255–₹1,270 will maintain the bullish bias, keeping the setup active toward ₹1,379–₹1,420 in the near term.
A decisive close above ₹1,355 could further accelerate the next leg of the uptrend, extending the move toward ₹1,455.
________________________________________
📈 Candlestick Structure – Bullish Engulfing Confirmation:
The current breakout candle is a strong bullish engulfing formed after a brief sideways phase — signaling renewed dominance of buyers.
Such candles, especially when paired with volume spikes and EMA crossovers, mark the beginning of institutional-led expansion legs.
The price-volume confluence validates that the short-term correction phase has likely ended, and the stock is transitioning into an active swing momentum phase.
________________________________________
📏 Fibonacci Analysis:
From swing low ₹1,114 to swing high ₹1,327.8:
61.8% retracement @ ₹1,190 → Strong support zone defended.
78.6% retracement @ ₹1,255 → Current breakout retest area.
100% extension @ ₹1,327 → Confirmed expansion level.
Sustaining above ₹1,255 keeps the structure intact and supports continuation toward the ₹1,379–₹1,420 target band.
________________________________________
🧭 STWP Support & Resistance:
Resistances: ₹1,355 | ₹1,391 | ₹1,456
Supports: ₹1,255 | ₹1,191 | ₹1,155
The ₹1,255–₹1,270 zone remains a high-probability demand pocket, supported by both Fibonacci confluence and recent volume base formation.
The ₹1,355–₹1,390 zone acts as a minor resistance band, where partial booking or temporary supply may appear before momentum resumes.
________________________________________
📊 STWP Volume & Technical Setup:
Today’s breakout session recorded 2.92M shares vs 0.95M average, confirming exceptional institutional participation.
Indicators such as RSI (68.7) and MACD bullish crossover reinforce the continuation potential.
Stochastic and CCI both remain in strong zones, consistent with trend alignment across timeframes.
Trend Direction: UPTREND | Volume Confirmation: Strong Institutional Activity
________________________________________
🧩 STWP Summary View:
Final Outlook:
Momentum: Strong | Trend: Bullish | Risk: Moderate | Volume: High
UNO Minda has transitioned from a consolidation phase into a clean institutional breakout setup.
The combination of price compression, breakout volume, and bullish engulfing confirmation signals a fresh impulse wave beginning within the existing uptrend.
Holding above ₹1,255–₹1,270 will sustain the bullish structure, with potential upside toward ₹1,420–₹1,455 zones in the coming sessions.
________________________________________
⚠️ Disclosure & Disclaimer – Please Read Carefully
This analysis is intended solely for educational and informational purposes and does not constitute investment advice or a buy/sell recommendation.
I am not a SEBI-registered investment adviser. All observations are based on chart study, technical structure, and publicly available data.
Trading involves risk; please manage position size, stop-loss levels, and discipline as per your risk appetite.
Consult a SEBI-registered financial advisor before acting on any trade setup.
________________________________________
Position Status: No active position in (UNOMINDA) at the time of analysis.
Data Source: TradingView & NSE India
💬 Found this useful?
🔼 Boost this post to help more traders learn from structured setups.
💭 Drop your insights — how do you view this breakout’s sustainability?
🔁 Share with traders who value clean, volume-backed analysis.
👉 Follow for more price structure + institutional logic breakdowns.
🚀 Stay Calm. Stay Clean. Trade With Patience.
Trade Smart | Learn Zones | Be Self-Reliant 📊
________________________________________
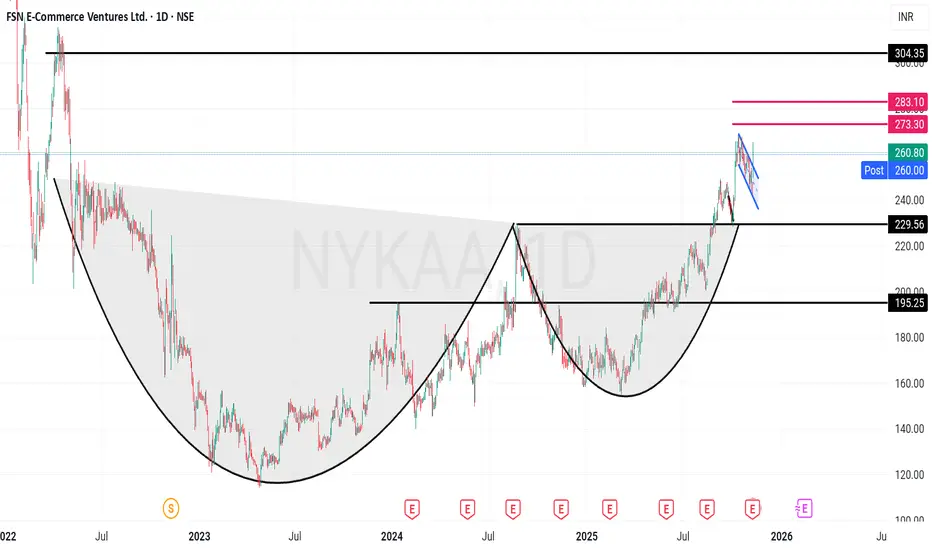
Nykaa - Strong Growth Cup & Handle with Detailed fundamentalsFSN E-Commerce Ventures Limited (Nykaa) – Technical & Fundamental Analysis
Company Overview:
FSN E-Commerce Ventures Limited (Nykaa) is a digitally native consumer technology platform, delivering a content-led, lifestyle retail experience. Since its incorporation in 2012, the company has focused on designing a differentiated brand discovery journey for its consumers. It offers a diverse portfolio of beauty, personal care, and fashion products, including owned-brand products manufactured in-house. Nykaa provides an omnichannel experience to cater to consumer preferences and convenience.
Technical Analysis
Chart Patterns: Cup and handle breakout; Today 1-hour parallel channel breakout
Current Market Price (CMP): ₹260
Targets: ₹301, ₹350
Support Levels: ₹230, ₹195
Recent News & Highlights
✅Q1 FY26 Results: Consolidated net profit surged 142% YoY to ₹23.30 Cr; revenue up 23.4% to ₹2,155 Cr
✅Arbitration Win: Nykaa Fashion received ₹10 Cr compensation from arbitration award
Q1 FY26 Guidance: Management anticipates consolidated net revenue growth at lower end of mid-twenties range YoY
✅Fashion Segment Target: Company expects EBITDA breakeven in fashion by FY26
✅Organic Portfolio Expansion: Aims to increase organic portfolio by 30% annually to reach ₹6,000 Cr GMV
✅Q4 FY25 Performance: EBITDA ₹133 Cr vs ₹93.28 Cr YoY; EBITDA margin improved to 6.47% from 5.59%
✅Corporate Action: NCLT approved merger of Iluminar Media (LBB) into Nykaa Fashion
Analytical Summary
Operational Excellence: Revenue growth of 24.5% YoY with net profit doubling to ₹66.08 Cr demonstrates strong execution and operating leverage. The company is scaling both beauty and fashion verticals while expanding margins.
Capital Structure: Debt increased 41% to ₹961 Cr, but debt-to-equity remains negligible at 0.04, showing conservative leverage. ROE at 5.9% suggests room for improvement in capital efficiency.
Valuation Risk: PE of 675.77 and PB of 40.5 reflect aggressive growth expectations. EV/EBITDA of 117.5 leaves minimal margin of safety, requiring caution for long-term investors.
SWOT Analysis
Strengths (16 Factors):
Rising net and operating cash flows for 2 consecutive years
Strong EPS growth; quarterly profit margins expanding
Improving RoCE, ROE, and ROA
Consistent revenue growth for past 2 quarters
Clean governance; zero promoter pledge
Weaknesses (3 Factors):
Promoter shareholding dilution
Expensive valuation (PE > 40) limits margin of safety
Opportunities (1 Factor):
Increasing FII/FPI shareholding validates institutional interest
Disclaimer
This analysis is for educational and informational purposes only. It does not constitute investment advice. Trading and investing in stocks involve risks, and individuals should conduct their own due diligence or consult with a qualified financial advisor before making any investment decisions. The author is not responsible for any gains or losses arising from the use of this analysis.
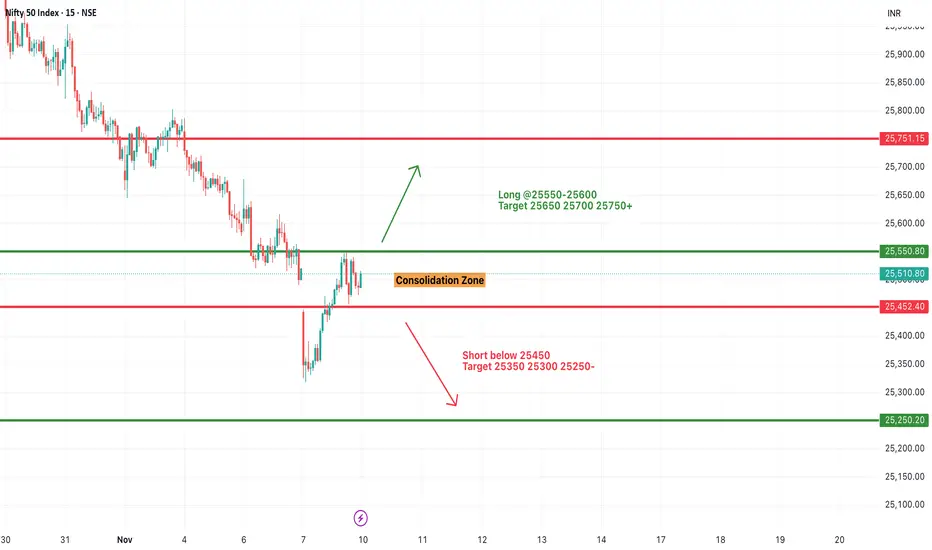
#NIFTY Intraday Support and Resistance Levels - 10/11/2025Nifty is expected to open flat to slightly gap up near the 25,500–25,550 zone, showing early signs of stability after the recent correction. The index is currently trading within a consolidation range, where both buyers and sellers are actively defending key levels.
If Nifty sustains above 25,550–25,600, it may trigger a short-covering rally toward 25,650, 25,700, and 25,750+. A breakout above 25,750 could further strengthen the momentum and shift sentiment toward the bullish side.
On the downside, immediate support lies near 25,450, and a breakdown below this level may lead to a retest of 25,350, 25,300, and 25,250 zones. Sustained weakness below 25,250 would open the door for deeper corrections.
Overall, with a flat to slightly gap up opening, Nifty may witness a range-bound to mildly positive session in the first half. Traders should watch for a breakout above 25,600 for long opportunities or a breakdown below 25,450 for short setups, while maintaining tight stop losses in this consolidation phase.
[INTRADAY] #BANKNIFTY PE & CE Levels(10/11/2025)Bank Nifty is expected to open flat near the 57,900 zone, signaling a balanced sentiment between bulls and bears after last week’s mixed movement. The index is currently trading within a broad consolidation range where both upside and downside breakouts can offer directional moves.
If Bank Nifty sustains above 58,050, it may trigger fresh buying momentum toward 58,250, 58,350, and 58,450+, indicating continuation of the recovery trend. A decisive close above 58,450 could further strengthen bullish momentum.
On the other hand, if the index slips below 57,900, pressure could increase toward 57,750, 57,650, and 57,550. A break below 57,450 may invite stronger selling pressure with potential downside targets at 57,250 and 57,050.
Overall, with a flat opening, Bank Nifty is likely to remain in a sideways consolidation phase during the initial hours. Traders should focus on breakout above 58,050 for a bullish move or breakdown below 57,450 for bearish continuation, maintaining a strict stop loss due to potential intraday volatility.

Monthly analysis for Nifty: 09/11/25I tried to make it as elaborate as I could to give a clear picture of the Nifty trend in November. If there is any doubt or question, you can drop in the comment section.
Right now, it is in between the zone of cluster of support/resistance

Sharing my Secret Trading Mindset with Price actionIn this 18 minute video I will try to change the way you trade by sharing my trading experience using charts older than 3 months .

Rising Wedge Formation | Bullish Engulfing💹 BSE Ltd (NSE: BSE)
Sector: Financial Services | CMP: ₹2,678.30 | View: Rising Wedge + Bullish Exhaustion Setup
📊 Price Action:
BSE Ltd witnessed a powerful uptrend from ₹2,020 to ₹2,718, supported by heavy institutional participation and strong price momentum.
The stock recently posted a 20-day volume breakout, followed by a bullish engulfing candle, signaling strong buying strength at lower levels.
However, post this rally, the price structure has developed into a Rising Wedge pattern, indicating momentum exhaustion and potential short-term consolidation.
The recent rejection near ₹3,030 swing high suggests supply pressure building at upper resistance zones, aligning with the wedge’s narrowing structure.
💼 HNI Trade Levels (STWP Setup):
Aggressive Entry: ₹2,678–₹2,718 | Stop Loss: ₹2,425
Low-Risk Entry: ₹2,595 | Stop Loss: ₹2,415
The near-term trend remains upward but stretched.
HNI and swing traders should monitor the ₹2,595–₹2,650 zone closely — this area represents both the 61.8% Fibonacci retracement and the wedge support base.
Sustaining above it will keep the setup active; a breakdown below ₹2,595 could shift the structure into a corrective phase.
📉 Chart Pattern Analysis – Rising Wedge (Bearish Reversal Bias):
The current structure represents a Rising Wedge formation, identified by two upward-sloping, converging trendlines.
This pattern often develops after strong rallies, marking the final leg of an existing uptrend before a corrective phase begins.
In BSE’s case, the wedge indicates that buying momentum is weakening as the range tightens, while volumes remain high — a sign of profit booking within strength.
The confirmation trigger for reversal would be a breakdown below ₹2,595. Until then, the structure remains short-term bullish but with an elevated risk of pullback.
A breakdown could potentially extend retracement toward ₹2,525–₹2,450.
📈 STWP Trading Analysis:
Entry: ₹2,678–₹2,718 | Stop Loss: ₹2,425.50
The breakout candle displayed exceptional strength with a 20.3M volume surge against a 5.65M average, confirming institutional footprints and momentum expansion.
The price is currently sustaining above its short- and mid-term EMAs, with trend alignment visible across the daily and weekly timeframes.
Holding above ₹2,644–₹2,595 (critical Fibonacci and structural zone) will maintain the bullish bias, keeping the setup active toward ₹2,783–₹2,888 in the near term.
A sustained close above ₹2,888 could further extend the move toward ₹3,030, whereas a breakdown below ₹2,595 may trigger pattern invalidation and shift bias toward ₹2,525–₹2,450 support zones.
📈 Candlestick Pattern – Bullish Engulfing at Apex:
A Bullish Engulfing Candle formed on 4 Nov 2025, initiating the final upward leg from ₹2,443 to ₹2,718.
While it reflected strong buying enthusiasm, the placement of this candle near the apex of the wedge signals possible buyer exhaustion.
Such engulfing candles late in a trend often act as final thrust candles, marking distribution zones rather than breakout initiation.
This makes it essential for traders to track whether follow-up candles sustain strength or fade under resistance.
📏 Fibonacci Analysis:
From swing low ₹2,021.50 to swing high ₹3,030.0:
61.8% retracement @ ₹2,644 → Key structural support.
50% retracement @ ₹2,525 → Ideal pullback level.
38.2% retracement @ ₹2,406 → Deeper retracement aligned with wedge base.
The stock currently trades near the 61.8% golden zone, making ₹2,595–₹2,644 a crucial area for short-term trend control.
A close below this range may invite a deeper retracement, while sustained strength above ₹2,678 could revive momentum toward ₹2,888–₹3,030.
🧭 STWP Support & Resistance:
Resistances: ₹2,783 | ₹2,888 | ₹3,059
Supports: ₹2,595 | ₹2,525 | ₹2,406
The ₹2,980–₹3,020 range acts as a weak resistance zone, where mild profit booking or supply pressure may emerge if momentum continues upward.
On the downside, the ₹2,020–₹2,070 belt continues to serve as a strong structural support zone, backed by historical accumulation and institutional demand footprints.
📊 STWP Volume & Technical Setup:
Today’s volume stood at 20.3M shares vs 5.65M average, signaling heavy institutional activity and potential position rotation post-breakout.
RSI remains elevated near 69, while Stochastic (90) suggests short-term overbought conditions — hinting at a likely consolidation phase ahead.
MACD continues to stay in the bullish zone but shows flattening momentum, consistent with the wedge’s tightening structure.
Trend Direction: UPTREND (Weakening) | Volume Confirmation: High with Distribution Bias
🧩 STWP Summary View:
Final Outlook:
Momentum: Strong | Trend: Bullish | Risk: High | Volume: High
BSE Ltd remains structurally bullish but technically stretched after a steep rally and volume breakout. The Rising Wedge formation, combined with the Bullish Engulfing near the top, reflects a maturing uptrend with signs of short-term exhaustion. Holding above ₹2,595 keeps the pattern valid, but traders should remain cautious of volatility and potential profit booking as the structure nears completion.
⚠️ Disclosure & Disclaimer – Please Read Carefully
This post is created solely for educational and informational purposes and should not be interpreted as investment advice or a buy/sell recommendation.
I am not a SEBI-registered investment adviser. All views are based on technical analysis and publicly available market data.
Trading involves significant risk. Always apply risk management, follow position sizing discipline, and consult a SEBI-registered financial advisor before acting on any trade.
Position Status: No active position in (BSE) at the time of this analysis.
Data Source: TradingView & NSE India
💬 Found this useful?
🔼 Give this post a Boost to help more traders discover structured, professional analysis.
💭 Drop your insights — will BSE’s wedge resolve in continuation or correction?
🔁 Share this with your trading circle to promote disciplined chart-based analysis.
👉 Follow for more institutional-style breakdowns blending price action, structure, and volume logic.
🚀 Stay Calm. Stay Clean. Trade With Patience.
Trade Smart | Learn Zones | Be Self-Reliant 📊

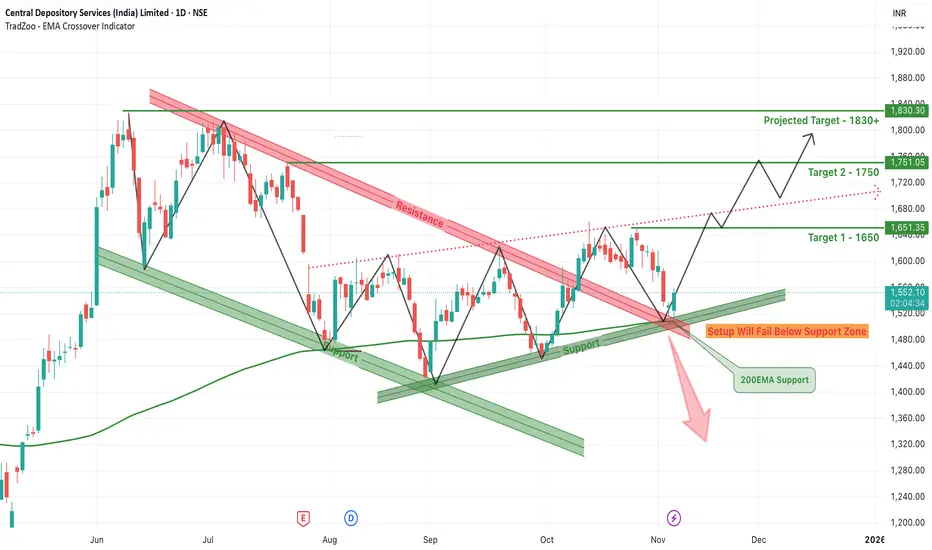
CDSL Breakout from Falling Wedge – Can It Rally to 1830+?CDSL has recently broken out from a classic falling wedge pattern, a bullish technical setup that often signals a trend reversal or continuation of the broader uptrend. After months of being compressed between a descending resistance and a well-established support line, the stock has now pierced through the upper resistance zone with notable bullish momentum.
The wedge had formed over several months, creating lower highs and relatively equal or slightly rising lows. The pattern was further supported by a confluence with the 200 EMA, which acted as a critical dynamic support near the breakout zone. This alignment of technical indicators added strength to the breakout confirmation seen recently.
With this breakout, CDSL has now opened doors for higher targets. The immediate Target 1 is set at ₹1650, which also aligns with a recent horizontal resistance zone. Once this is breached, the next move could extend toward Target 2 at ₹1750, a level where previous price action has shown hesitation. If momentum continues to build and the broader market supports the move, the final projected target of ₹1830+ becomes achievable in the short to medium term.
However, it’s crucial to note that the support zone below ₹1480 is acting as a critical invalidation point for this bullish setup. Any strong breakdown below this zone, especially with volume, would fail the bullish structure and may push the stock back into consolidation or a deeper correction. Traders must also watch the red dotted trendline, which represents a former resistance turned possible retest zone.
Overall, the technical landscape is now favoring the bulls, especially after the breakout confirmation and support from the 200 EMA. Traders and investors should monitor price action near the projected levels and manage risk accordingly, while riding the momentum above the wedge resistance.
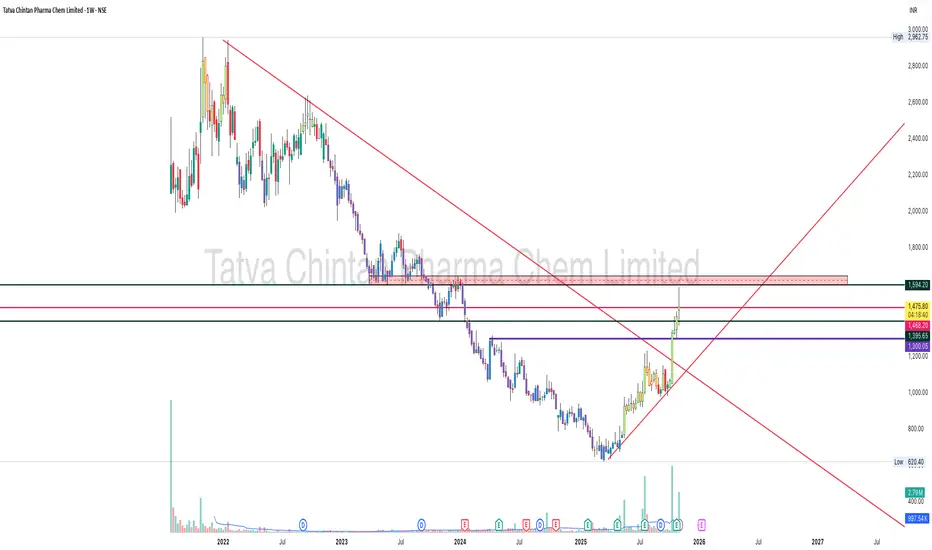
Tatva Chintan #Screener — Trend Reversal Before The CrowdTatva Chintan – Major Trendline #Breakout After Long Downtrend 📈🔥
Tatva Chintan Pharma has broken a multi-year falling trendline, ending a prolonged downtrend phase since 2021.
This breakout is backed by strong price momentum + volume expansion, indicating accumulation and potential reversal into a long-term uptrend.
📌 Breakout Zone: ~₹1350 – ₹1400
📌 Current Price: ~₹1467
📌 Structure: Breakout + retest + continuation
📌 Momentum: Trading above 50 & 200 EMA on weekly 👌
Key Levels
Immediate Resistance:
₹1468 (current zone)
₹1594
Support Zones
₹1395
₹1343
₹1311 (major retest zone)
As long as price sustains above ₹1310-1340 range, bullish structure remains intact ✅
Why This Breakout Matters
✅ Multi-year trendline breach
✅ Higher-lows forming since 2024 bottom
✅ Strong accumulation volume
✅ Pharma sector strength visible
✅ Potential trend reversal from long accumulation base
This kind of pattern often leads to multi-month swing opportunities if trend sustains.
View
Bias remains bullish until structure breaks.
Watching for follow-through above ₹1500 zone for extended upside.
📒 Educational chart analysis — not investment advice.
#NIFTY Intraday Support and Resistance Levels - 07/11/2025Nifty is likely to open with a gap down near the 25,450 zone, reflecting continued weakness and bearish sentiment in the market. The index remains under selling pressure, trading below key resistance levels, which suggests that bears are still in control in the short term.
If Nifty sustains below 25,450, it may extend the decline toward 25,350, 25,300, and 25,250, where a temporary pullback could occur. A breakdown below 25,250 will further intensify weakness, opening the way for deeper targets around 25,150–25,100.
On the upside, immediate resistance lies near 25,550–25,600. A sustained move above this level could trigger a short-covering rally toward 25,650 and 25,750, but the broader trend will remain bearish unless the index reclaims 25,750 decisively.
Overall, with a gap down opening near 25,450, the sentiment is expected to remain negative to range-bound. Traders should watch for a break below 25,450 for continuation trades on the downside and consider a reversal only if Nifty manages to hold above 25,550 with strong momentum. Maintaining strict stop losses is advised due to potential volatility in the early session.
[INTRADAY] #BANKNIFTY PE & CE Levels(07/11/2025)Bank Nifty is expected to open slightly gap down near the 57,450–57,500 zone, indicating mild bearish sentiment after failing to hold higher levels in the previous session. The index remains under short-term pressure but is approaching an important support area where a reversal attempt could emerge.
If Bank Nifty manages to sustain above 57,550–57,600, a short-covering move can lift prices toward 57,750, 57,850, and 57,950+ levels. A breakout above 57,950 will further confirm bullish reversal momentum.
However, if the index slips below 57,450, it may trigger fresh weakness toward 57,250, 57,150, and 57,050, where buyers may try to defend the zone again.
Overall, with a slightly gap down opening, the market sentiment remains neutral-to-weak, but watch for a potential reversal near the 57,450–57,500 support area. Traders should avoid early trades and wait for directional confirmation above 57,600 or below 57,450 before taking new positions, keeping tight stop losses in this consolidation range.
