[INTRADAY] #BANKNIFTY PE & CE Levels(09/10/2025)Bank Nifty is likely to open with a gap-up around the 56,000 level, continuing its bullish tone from the previous sessions. The index is trading within a defined range, with 55,950 acting as immediate support and 56,450 as a key resistance zone.
If Bank Nifty sustains above 56,050–56,100 after opening, it may trigger a fresh upside move toward 56,250, 56,350, and 56,450+. A breakout above 56,450 will further strengthen the momentum and can extend the rally toward 56,750–56,950+.
On the downside, if the index slips below 55,950–55,900, selling pressure may emerge, leading to a decline toward 55,750, 55,650, and 55,550-.
Overall, the bias remains positive with a gap-up opening, but traders should monitor price action near the 56,450 resistance zone. A breakout on either side will decide the next directional move — bullish above 56,450 and bearish below 55,900.
Technical Analysis

GOLD M30 – Bulls Defend $4,000, Eyes on 4,100+Gold’s historic surge above the $4,000 psychological barrier is now consolidating, with buyers defending the 3996$ support (Fibo 0.618 reaction). The structure remains bullish, while intraday traders are eyeing the next reaction zones for both continuation and scalp opportunities.
📊 Technical Levels to Watch (Fibo Matrix – M30)
3996$ Support Zone: Breakout retest + Fibo 0.618 → must-hold for bulls.
4018 – 4020: First intraday resistance, potential short-term reaction.
4043$: Expansion-based psychological barrier.
406x – 407x: Key SELL Reaction Zone (Fibo 1.5 – 1.618) → scalp rejection likely.
4095$+: Upper liquidity expansion, next major target if momentum extends.
🎯 Francis Trade Plan
✅ BUY Setup:
Entry: 3996 – 4000 zone.
Targets: 4018 → 4043 → 406x.
SL: Below 3984.
⚠️ SELL Setup (Short-term scalp only):
Entry: 406x – 407x reaction.
Targets: 4020 → 4000.
SL: Above 4096.
🔑 Francis View
The breakout at $4,000 signals strength, and bulls still dominate.
👉 Dips into 3996 support remain attractive BUY opportunities.
👉 Short-term scalpers can prepare for reaction SELLs around 406x – 407x.
📌 Bias: Bullish above $3996 – 4,100 zone remains the next liquidity magnet.

[INTRADAY] #BANKNIFTY PE & CE Levels(08/10/2025)Bank Nifty is expected to open flat near the 56,200 level after a strong rally in the previous sessions. The index has been consolidating within a narrow range, suggesting a pause before the next directional move.
On the upside, a sustained move above 56,450–56,500 could trigger a bullish breakout, leading to an upside toward 56,650, 56,850, and 56,950+. A breakout above 56,950 will further strengthen the bullish momentum and may push the index toward new short-term highs.
On the downside, immediate support lies around 56,050–55,950. A breakdown below this zone may lead to mild selling pressure, dragging the index toward 55,750, 55,650, and 55,550-.
Overall, the sentiment remains cautiously positive. Traders should wait for a confirmed breakout or breakdown from the current consolidation zone before initiating fresh positions, while maintaining strict stop-loss levels.

Maruti SuzukiMaruti might touch around 16,250 tomorrow but beyond that a breakout is not expected much, as there has been a drop in the volume.

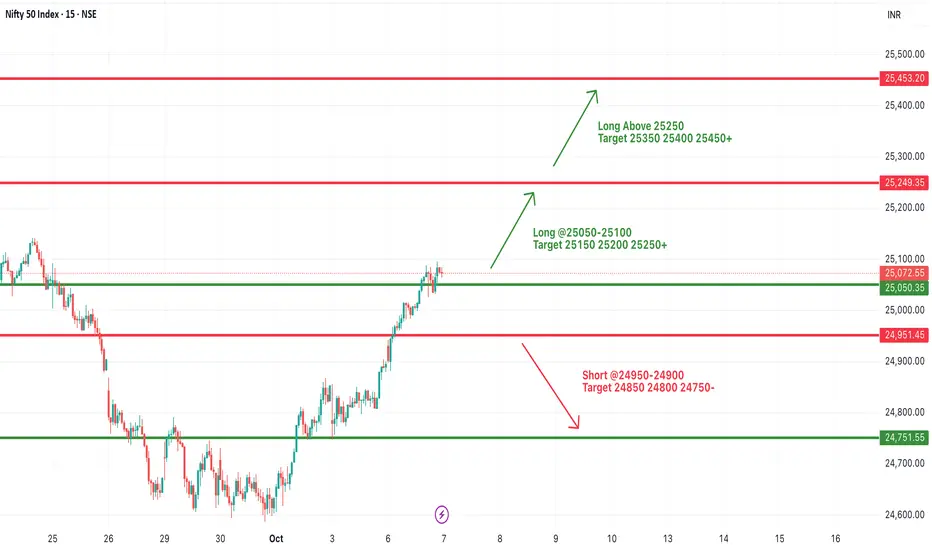
#NIFTY Intraday Support and Resistance Levels - 07/10/2025Nifty is likely to open with a gap-up around the 25,100 level, continuing its strong upward momentum from the previous sessions. The index has shown consistent higher lows, indicating strong buying interest and a positive undertone in the market.
If Nifty sustains above 25,050–25,100, it can extend the rally toward 25,150, 25,200, and 25,250+. A breakout above 25,250 will further strengthen the bullish trend, potentially leading to higher targets near 25,350–25,450+.
On the downside, immediate support is placed at 24,950–24,900. A breakdown below this zone may invite mild profit booking, taking the index lower toward 24,850 and 24,750-.
Overall, the sentiment remains bullish with a gap-up opening, and traders should look for buying opportunities on dips while maintaining a strict stop-loss below 24,900 for intraday setups.
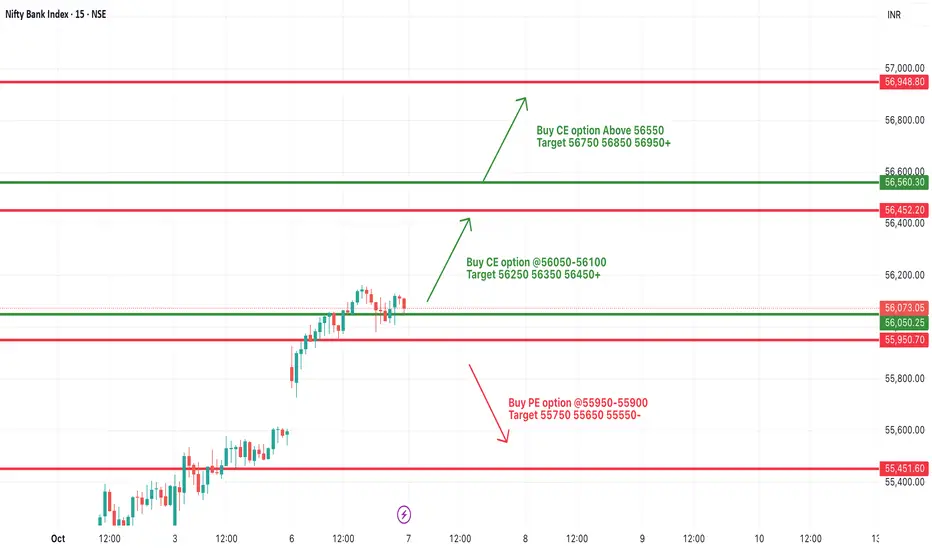
[INTRADAY] #BANKNIFTY PE & CE Levels(07/10/2025)Bank Nifty is expected to open with a gap-up near the 56,100 level, continuing its recent bullish momentum. The index has been forming higher highs and higher lows, indicating strong buying interest from lower levels.
If Bank Nifty sustains above 56,050–56,100, it could extend its upside move toward 56,250, 56,350, and 56,450+. A breakout above 56,650 will likely trigger a stronger rally, pushing the index toward 56,850–56,950+ levels in the short term.
On the downside, immediate support is placed around 55,950–55,900. A drop below this zone may lead to some intraday profit booking, taking the index toward 55,750, 55,650, and 55,550-.
Overall, the sentiment remains positive with a gap-up opening, but traders should stay cautious near resistance levels and manage positions with strict stop-losses. The bias remains bullish as long as the index holds above 55,900.
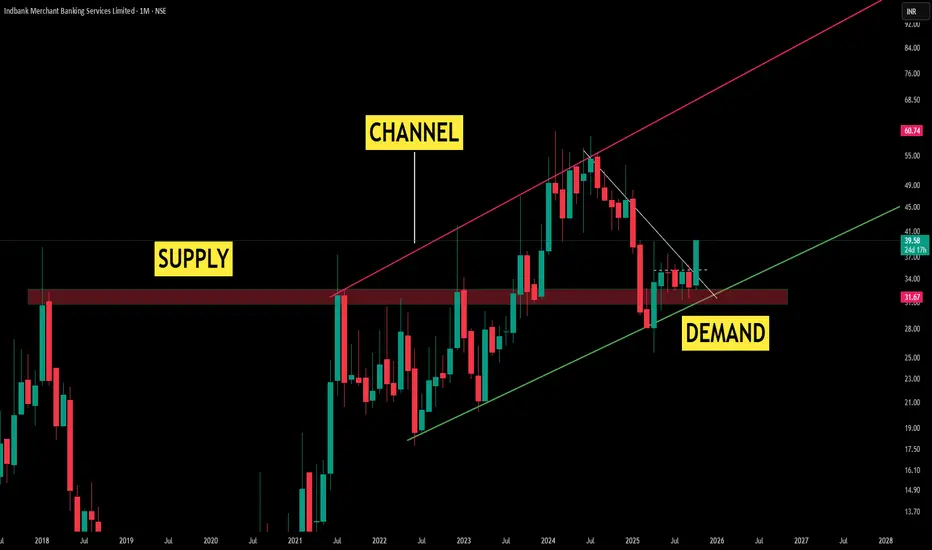
Monthly Market Regime: Supply-to-Demand Shift Framed by ParallelTheme 1: Regime Shift
A prior supply pocket has matured into a demand base as monthly closes repeatedly sustained above the zone
Theme 2: Channel Governance
A clean, supportive parallel channel has developed; price has been guided by its rails, offering objective context for expansion and contraction phases on the higher timeframe
Theme 3: Higher Highs, Higher Lows
Successive higher highs align with the channel’s upper boundary acting as dynamic headwinds, while higher lows respect the supportive green line, preserving trend health.
Theme 4: Counter Trendline (CT)
The white CT outlines the corrective path within the advance, visually separating pullback structure from primary momentum
Disclaimer: Technical analysis provides probability-based insights. Always implement proper risk management and consider multiple timeframe confirmations before executing trades.
XRP Breaks Above $3 – Bullish Momentum BuildsOverview:
XRP has officially closed the week above the $3 mark, a psychological resistance now turning into support. This is a major technical shift suggesting renewed bullish control.
🔑 Key Levels to Watch:
Support: $3.00
Short-Term Target: $3.20
Major Resistance / Magnet: $3.60 (All-Time High)
📊 Market Structure:
XRP appears to be breaking out of a consolidation zone between $2.70 and $3.00. This range held for several weeks, and a clean breakout could fuel a strong continuation toward previous highs.
🐂 Bullish Scenario:
Continued higher highs with volume could open the path to $3.20 and eventually $3.60.
A successful retest of the $3 level as support would further validate the breakout.
⚠️ Risk Note:
Watch for any fakeouts or low-volume rallies. A drop below $3 would negate the breakout and put the $2.70 support back in play.
📅 Outlook:
With Q4 2025 underway, a rally toward the ATH at $3.60 could be driven by both technical momentum and market sentiment.
💬 What’s your take? Are we heading for a new ATH this quarter?
📌 #XRP #Crypto #Altcoins #Breakout #TechnicalAnalysis #Q4Outlook

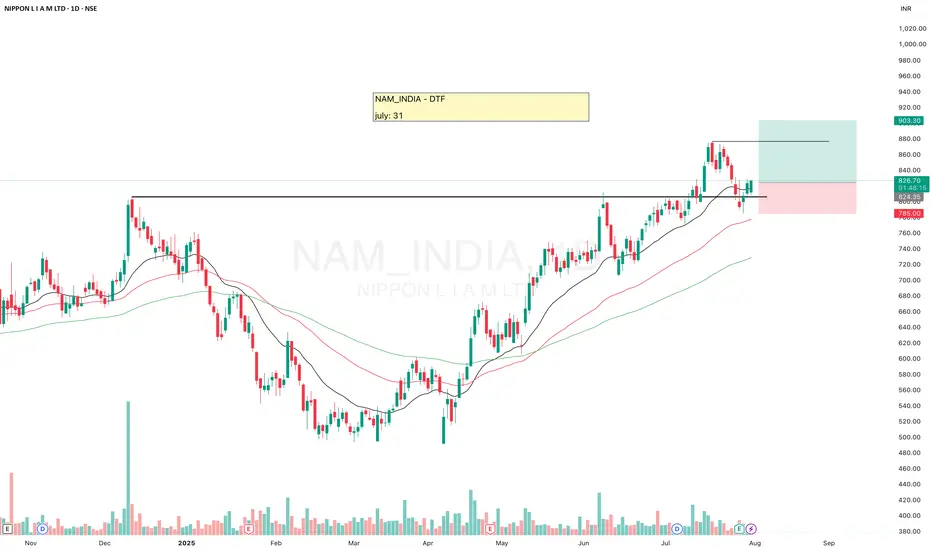
NAM_INDIA (NIPPON L I A M LTD)NAM_INDIA looks good.
It has re-tested the resistance, and seems to be ready for another upside move.
Must use the SL.
✅ If you like my analysis, please follow me here as a token of appreciation :)
in.tradingview.com/u/SatpalS/
📌 For learning and educational purposes only, not a recommendation. Please consult your financial advisor before investing.
ASTER DM (Aster DM Healthcare)ASTER DM looks strong.
It faced resistance near 604–610, broke out on 3rd July, and then re-tested that level.
The stock is trading above all key EMAs (20, 50, 100, 200) and has been in a long-term uptrend for nearly 5 months.
With recent strong results, there’s a probability of an upside move. Keep it on your watchlist.
✅ If you like my analysis, please follow me as a token of appreciation :)
in.tradingview.com/u/SatpalS/
📌 For learning and educational purposes only, not a recommendation. Please consult your financial advisor before investing.

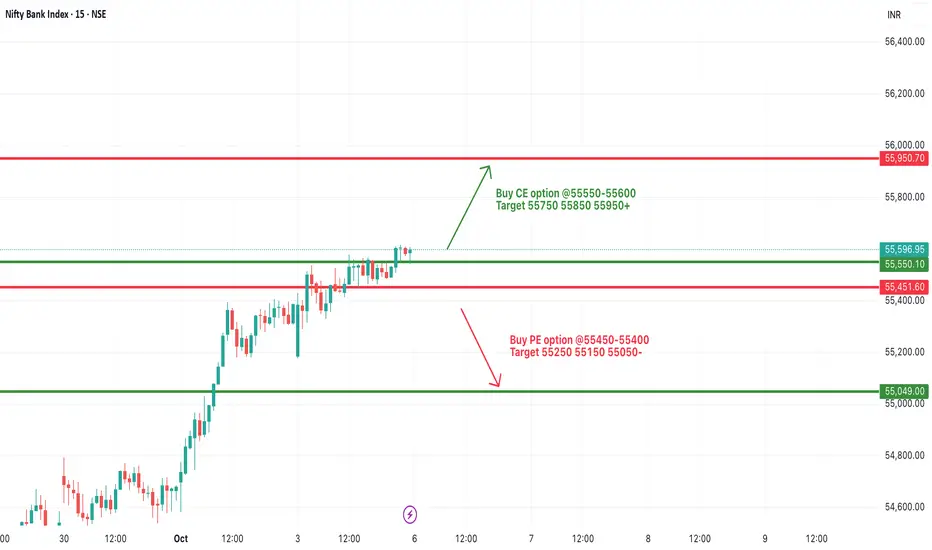
[INTRADAY] #BANKNIFTY PE & CE Levels(06/10/2025)Bank Nifty is expected to open flat around the 55,550 level after a strong rally in the previous sessions. The index has been consolidating near the resistance zone, indicating that today’s move could decide the next short-term direction.
If Bank Nifty sustains above 55,550–55,600, it may resume its upward momentum, opening the path toward 55,750, 55,850, and 55,950+. A breakout and close above 56,000 will further strengthen bullish sentiment and attract fresh buying interest.
On the downside, immediate support lies at 55,450–55,400. A breakdown below this range may lead to a corrective dip toward 55,250, 55,150, and 55,050-. Traders should watch for a breakout or breakdown from this consolidation zone before initiating directional trades.
Overall, the sentiment remains cautiously positive with a flat opening, but traders are advised to wait for confirmation before taking aggressive positions.
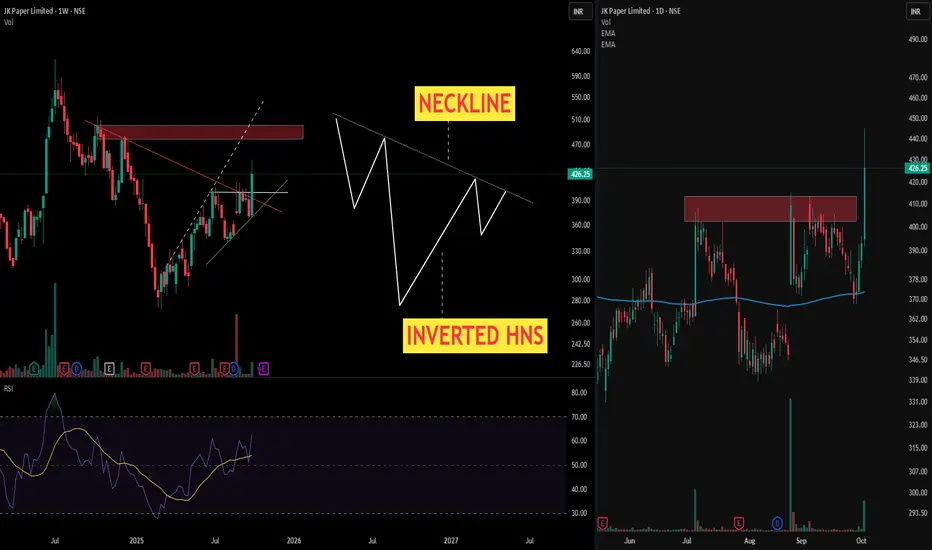
Inverted Head and Shoulders - Tale of a Bullish Reversal Pattern> Chart presents a textbook Inverted Head and Shoulders pattern on the weekly timeframe—one of the most reliable bullish reversal formations in technical analysis. This sophisticated pattern structure demonstrates the gradual shift from bearish exhaustion to bullish momentum, offering astute traders a high-probability setup.
> Anatomical Breakdown of the Pattern
- Left Shoulder: Initial decline to approximately ₹280 levels, followed by a relief rally—representing the first phase of selling pressure exhaustion
- Head: The decisive low zone forming the deepest trough—marking the capitulation point where maximum bearish sentiment peaks
- Right Shoulder: Higher low formation, demonstrating diminishing selling pressure and emerging buying interest
- Neckline: The critical resistance zone connecting the intermediate highs—serving as the pattern's confirmation level
> The Right side chart showcase the Daily time frame movement forclear outlook on Multi time frame basis .
Disclaimer: Technical analysis provides probability-based insights. Always implement proper risk management and consider multiple timeframe confirmations before executing trades.
Gold Outlook: Eyeing $4,000 – Fibo Expansion Zones in PlayGold continues to benefit from safe-haven demand as political risks in Washington and mixed U.S. data keep investors cautious. The metal is trading inside a clear bullish channel, with Fibonacci projections suggesting further upside before any major correction.
📊 Technical Deep Dive – H4 Structure
🔹 Fibonacci Confluence
The current rally respects 0.618 retracement at $3,820 and 0.786 retracement near $3,872, confirming algorithmic order flow.
Next expansion points are sitting at Fibo 1.5 – 1.618 ($3,995 – $4,003), a major liquidity target where reactions are likely.
🔹 Liquidity Pockets
$3,820 – $3,828: Historical demand block + Fibo 0.618, strong buy reaction zone.
$3,860 – $3,872: Active reaction layer, intraday support if retested.
$3,995 – $4,003: Key sell reaction zone, a liquidity grab area before possible retracement.
🔹 Candle & Flow
Breakout candles show strong momentum, pushing price toward untested liquidity.
However, multiple tests of $3,895 signal distribution pressure ahead of the $4,000 test.
🎯 Trade Playbook
🟢 Bullish Setup (Main Play)
Entry: $3,860 – $3,872
Targets: $3,895 → $3,995 → $4,003
Stop: Below $3,850
🔵 Deep Buy Setup (Aggressive)
Entry: $3,820 – $3,828
Targets: $3,872 → $3,895
Stop: Below $3,808
🔴 Countertrend Short (Scalp)
Entry: $3,995 – $4,003
Targets: $3,970 → $3,950
Stop: Above $4,010
⚡ Key Insights
Watch for a $4,000 liquidity sweep – could trigger either breakout continuation or sharp pullback.
If $3,860 support fails, deeper correction into $3,820 is expected before next rally.
H4 close above $3,895 strengthens bullish bias toward $4,003+.
📌 Question for traders: Will Gold break $4,000 and run, or is this a setup for a liquidity trap before correction? Share your view 👇

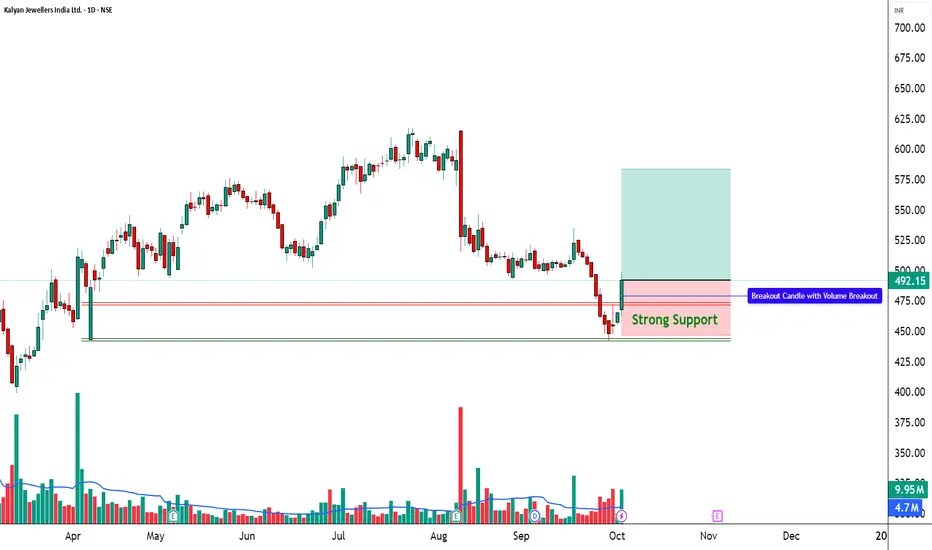
Kalyan Jewellers | RSI Breakout + High Volume Alert________________________________________
📈 Kalyan Jewellers | RSI Breakout + High Volume Alert 🚨
🔹 Entry Zone: ₹492.15
🔹 Stop Loss: ₹446.55 (Risk ~45.60 pts)
🔹 Supports: 470.48 / 448.82 / 434.93
🔹 Resistances: 506.03 / 519.92 / 541.58
________________________________________
🔑 Key Highlights
✅ Strong Bullish candle after a sharp downtrend
✅ Volume spike (9.95M vs avg 4.7M) – smart money activity detected
✅ RSI breakout – momentum shifting towards bulls
✅ Bollinger Band squeeze-off breakout expected – volatility expansion on cards
________________________________________
🎯 STWP Trade View
📊 Structure suggests short-term rebound rally possible towards ₹506–520 if momentum sustains.
⚠️ Strong supports at ₹470–448 should be watched for risk control.
________________________________________
💡 Learning Note
This setup shows how RSI breakouts with volume confirmation often lead to trend reversals. Adding multi-level support–resistance zones gives a clear trade map for both traders & investors.
________________________________________
⚠️ Disclosure & Disclaimer – Please Read Carefully
The information shared here is meant purely for learning and awareness. It is not a buy or sell recommendation and should not be taken as investment advice. I am not a SEBI-registered investment adviser, and all views expressed are based on personal study, chart patterns, and publicly available market data.
Trading—whether in stocks or options—carries risk. Markets can move unexpectedly, and losses can sometimes exceed the money you have invested. Past performance or past setups do not guarantee future results.
If you are a beginner, treat this as a guide to understand how the market works and practice on paper trades before risking real money. If you are experienced, always assess your own risk, position sizing, and strategy suitability before entering trades.
Consult a SEBI-registered financial adviser before making any real trading decision. By engaging with this content, you acknowledge full responsibility for your trades and investments.
💬 Found this useful?
🔼 Give this post a Boost to help more traders discover clean, structured learning.
✍️ Drop your thoughts, questions, or setups in the comments — let’s grow together!
🔁 Share with fellow traders and beginners to spread awareness.
👉 “If you liked this breakdown, follow for more clean, structured setups with discipline at the core.”
🚀 Stay Calm. Stay Clean. Trade With Patience.
Trade Smart | Learn Zones | Be Self-Reliant 📊
________________________________________
Gold Trading Plan | Limited Downside, Key Fibo Zones in Play🌍 Market Context
Gold is facing renewed selling pressure after yesterday’s bounce from the $3,820 area.
Risk-on sentiment and fresh USD buying are weighing on XAU/USD.
However, expectations of Fed rate cuts later this year and geopolitical tensions remain supportive, limiting deeper downside moves.
📊 Technical Analysis – Fibo Matrix Setup
🔴 SELL Reaction Zones
386x – 388x (Fibo retracement 0.5 – 0.618 + 0.786 confluence)
→ Intraday SELL scalp zone with strong rejection probability.
3881 – 3892 (Fibo 1.5 – 1.618 downtrend extension)
→ Key SELL liquidity zone for deeper rejection.
🟢 BUY Support Zones
3820 – 3819 (short-term recovery base) → Initial intraday support.
3795 – 3793 (Fibo 1.5 – 1.618 recovery zone) → Major liquidity pocket, ideal for BUY setups if tested.
🎯 Trading Scenarios
1️⃣ SELL Setup
Entry: 386x – 388x (watch rejection candlesticks).
Target: 3820 → 3795.
Stop Loss: Above 3892.
2️⃣ BUY Setup
Entry: 3795 – 3793 with bullish confirmation.
Target: 3860 → 3880.
Stop Loss: Below 3785.
⚡ Key Notes
USD momentum is crucial – if dollar strength continues, Gold may retest 379x zones.
Fed’s rate cut outlook and geopolitical headlines remain the “floor” for Gold.
Stick to clear Fibo reaction zones for best risk-to-reward setups.
💬 Community Insight:
Do you expect Gold to hold 3820 before bouncing, or will we see a flush into 379x liquidity?
Drop your setups below 👇

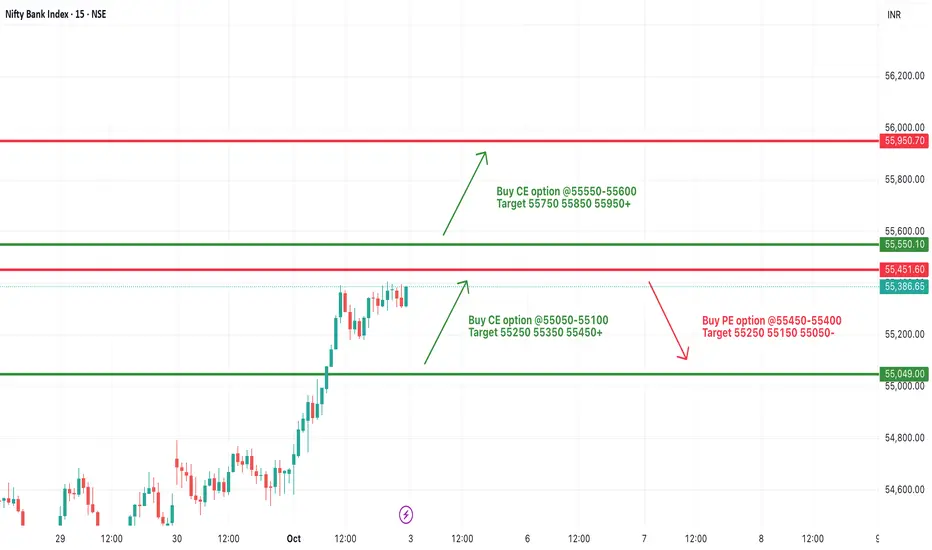
[INTRADAY] #BANKNIFTY PE & CE Levels(03/10/2025)Bank Nifty is expected to open with a gap-up above the crucial 55,550 level, which could trigger fresh bullish momentum. If the index sustains above 55,550, it may extend its rally toward 55,750, 55,850, and 55,950+, strengthening the upward bias. A breakout above 56,000 will further confirm bullish dominance, opening the way for higher levels.
On the downside, immediate support lies at 55,450–55,400. A slip below this zone may invite some profit booking, dragging the index toward 55,250, 55,150, and 55,050-. Failure to hold 55,000 could shift momentum back in favor of bears.
Overall, the setup indicates bullish strength with a gap-up opening above 55,550. However, traders should be cautious of sharp reversals near resistance zones and maintain strict stop-losses while trailing profits as targets are achieved.
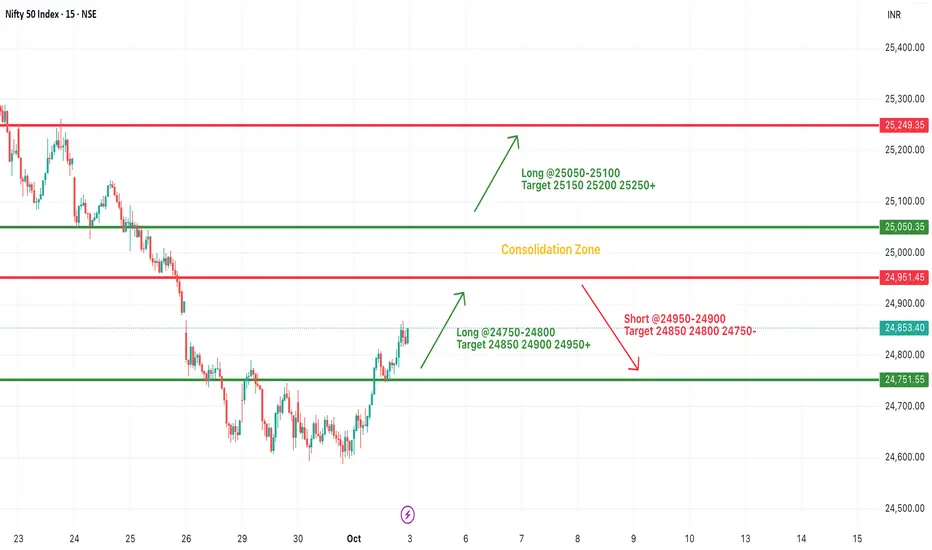
#NIFTY Intraday Support and Resistance Levels - 03/10/2025Nifty is set to open with a gap-up near the 24,950 level, placing it close to a key resistance zone. If the index sustains above 24,950–25,000, it can trigger further upside momentum toward 25,050, 25,150, and 25,200+. A breakout above 25,250 will strengthen the bullish sentiment, potentially extending the move toward 25,300–25,350 levels.
On the downside, immediate support lies around 24,850–24,800, and a failure to hold these levels may lead to profit booking. A break below 24,750 could invite selling pressure, dragging the index toward 24,700 and 24,650-.
Overall, with a gap-up opening near resistance, today’s session is likely to remain volatile. Sustaining above 24,950 will favor bulls, while rejection from this level may bring quick reversals. Traders should focus on breakout confirmations with strict stop-losses.
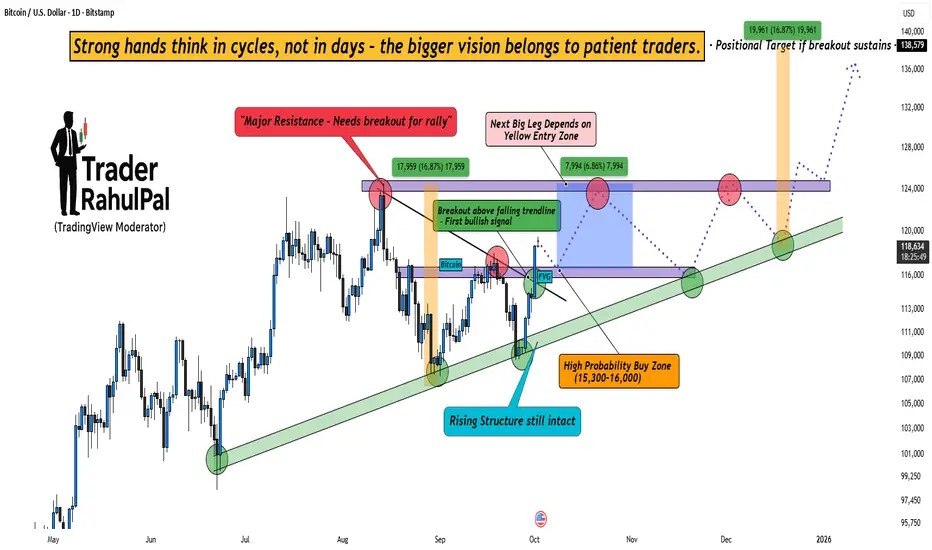
Bitcoin Cycle Play – The Setup That Could Change the Game!Bitcoin is currently showing clear bullish intent , but the real game lies in patience. The chart highlights a decisive breakout above the falling trendline , which is the first bullish signal after weeks of uncertainty.
At the same time, the rising structure is still intact , reminding us that the bigger trend remains strong. Smart money never chases candles – instead, it waits for the high probability zones . In this case, the 15,300–16,000 range could become the golden buying zone for long-term players.
However, one key hurdle remains – the major resistance overhead . Only if Bitcoin breaks and sustains above this zone, the door opens for the positional target near 138,000+ .
The psychology is simple : weak hands focus on short-term noise, but strong hands think in cycles and structures . Every dip tests conviction, but those who hold the bigger vision are the ones who capture the massive moves.
Rahul’s Tip : Don’t rush behind every breakout. Wait for zones where probability aligns with psychology . That’s where the wealth-building trades lie.
Disclaimer: This analysis is for educational purposes only and should not be taken as financial advice. Please do your own research or consult your financial advisor before investing.
Analysis By @TraderRahulPal (TradingView Moderator) | More analysis & educational content on my profile
👉 If you found this helpful, don’t forget to like and follow for regular updates.
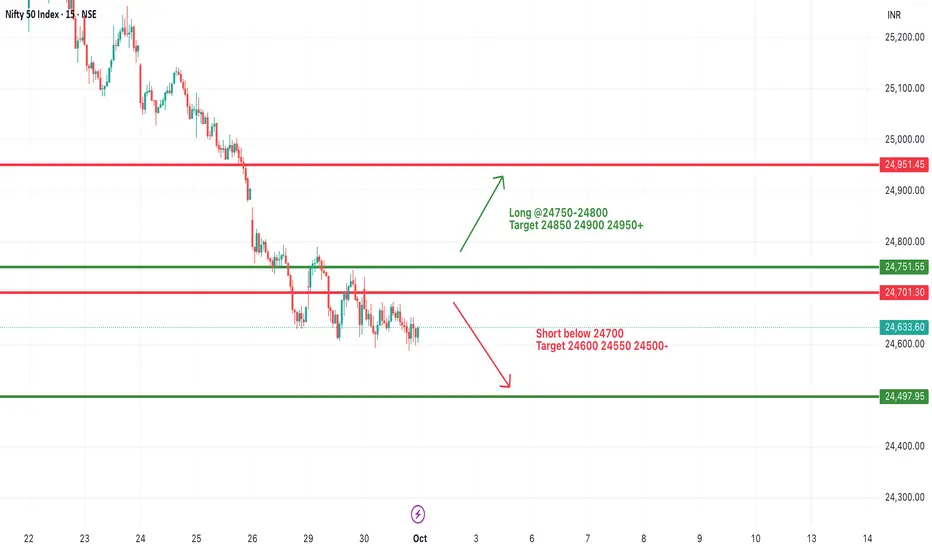
#NIFTY Intraday Support and Resistance Levels - 01/10/2025Nifty is expected to witness a slightly gap-up opening near the 24,700 level, which will be crucial to watch as it aligns with an immediate resistance zone. Sustaining above 24,750–24,800 may trigger upward momentum, pushing the index toward 24,850, 24,900, and 24,950+. A breakout above these levels will strengthen the bullish sentiment and may open the way for higher levels.
On the downside, if Nifty fails to hold above 24,700 and slips below 24,650–24,600, it could invite selling pressure. In such a case, the index may drift lower toward 24,550 and further to 24,500-. A deeper breakdown below 24,500 can extend the weakness and confirm continuation of the broader downtrend.
Overall, Nifty remains in a cautious zone, and the movement around 24,700 will decide whether the day favors a recovery bounce or continuation of weakness. Traders should stay alert around these levels with strict stop-losses.
[INTRADAY] #BANKNIFTY PE & CE Levels(01/10/2025)Bank Nifty is expected to open flat around the 54,650–54,700 zone, signaling consolidation after recent volatility. The index is trading close to crucial support and resistance levels, and today’s movement will depend on which side breaks first.
On the upside, sustaining above 54,550–54,600 can trigger further momentum, taking the index toward 54,750, 54,850, and 54,950+. A strong breakout above 55,050 will add more strength and may push Bank Nifty toward higher levels.
On the downside, a break below 54,450–54,400 can lead to selling pressure, dragging the index to 54,250, 54,150, and 54,050-. Weakness below these levels can extend the downtrend.
Overall, Bank Nifty is likely to trade within a defined range in the early session. A breakout on either side will set the trend for the day, and traders should maintain strict stop-losses with a focus on key levels

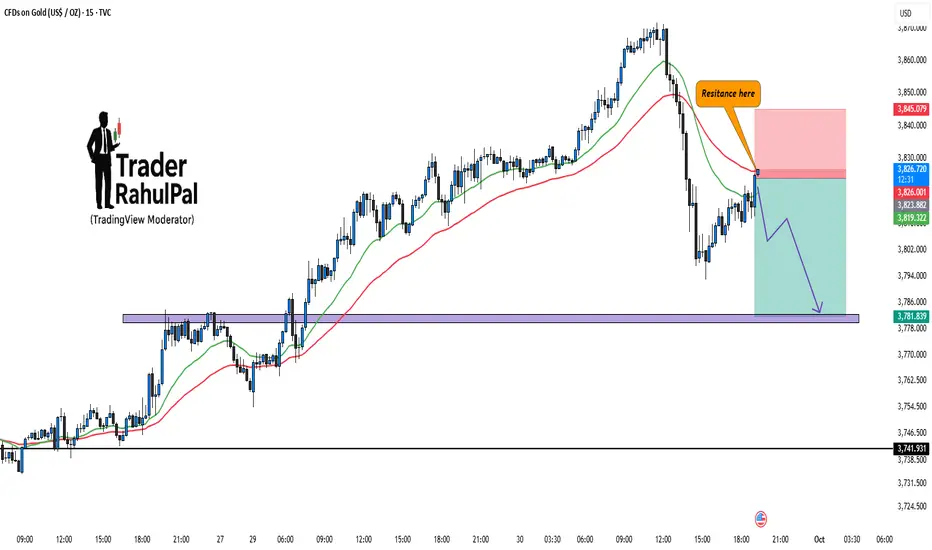
Gold – Resistance at 3840, Contra Move in Play?Gold has approached the 3825 and at high around 3840 resistance zone where sellers are likely to step in. Price rejection from this area can trigger a downside move toward the 3775–3780 support zone.
Currently, the setup favors a contra play, with risk defined above the resistance zone and reward potential aligning with the lower support.
Disclaimer: This analysis is for educational purposes only and should not be considered financial advice. Please do your own research or consult your financial advisor before trading.
CNXPSUBANK looks strongCNXPSUBANK index nearby the old resistance.
It gave the breakout of recent resistance near 7250 price zone and retested it and now looks strong.
If it gives the breakout of Old resistance(7550) then there is a probability of a good upside move.
Keep it in your watchlist.
✅ If you like my analysis, please follow me as a token of appreciation :)
in.tradingview.com/u/SatpalS/
📌 For learning and educational purposes only, not a recommendation. Please consult your financial advisor before investing.

GMR Airports Ltd – Bullish Bounce from Support ZoneThe chart of GMR Airports Ltd (Daily timeframe) is showcasing a well-respected ascending channel pattern, where price is currently bouncing off the lower support trendline, indicating a continuation of the bullish structure. This setup provides a compelling long opportunity if confirmed with price action.
• Uptrend Channel Structure Remains Intact
GMR Airports has been moving within a clearly defined uptrend channel with multiple touches at both resistance and support zones. The current bounce is happening near the support line, which has previously acted as a strong reversal point — suggesting that buyers are stepping in again.
• Twizzer Bottom Candlestick at Support
A key bullish candlestick pattern, the Twizzer Bottom, has formed right at the trendline support. This candlestick combo is known for reversal potential, especially at critical zones like this. The confluence of support + reversal pattern adds strong conviction to the bullish setup.
• EMA Support Alignment
The price also aligns closely with the 50-day EMA (blue line) and is above the 200-day EMA (red line) — a typical bullish sign in trend-following strategies. This alignment reinforces the uptrend bias and increases the odds of an upside continuation.
• Upside Targets Clearly Marked
- The initial target is placed at ₹93+, which corresponds to the last swing high.
- Target 2 is marked at ₹97+, aligning with the 52-week high.
- If price breaks through the upper resistance channel with momentum, the final target may extend higher, potentially entering price discovery mode.
• Risk Management is Well Defined
- The stop-loss is marked below ₹85, just under the previous swing low and trendline support.
- A close below this level will indicate a long setup failure, and the structure will need re-evaluation.
- This gives a favorable risk-reward ratio for swing traders entering at current levels.
• Conclusion – Watch for Momentum Confirmation
If follow-through buying occurs in the coming sessions, this could lead to a sharp upward move back toward the upper channel resistance. Traders should wait for volume expansion and strong candle closure above ₹88 for further confirmation. The overall bias remains bullish until the lower channel is broken convincingly.
