#BANKNIFTY PE & CE Levels(29/01/2026)Bank Nifty is expected to open flat, indicating a pause in momentum after the recent sharp recovery from lower levels. Such flat openings generally signal indecision in the market, especially when the index is trading close to an important resistance zone. At present, Bank Nifty is hovering near the 59550–59600 area, which has acted as a strong supply zone in recent sessions. This makes today’s trade more level-driven, with higher chances of range-bound movement and sudden volatility around key levels.
From a broader structure perspective, the index has bounced strongly from the sub-58500 region, mainly due to short covering. However, as price approaches higher resistance zones, fresh buying strength needs confirmation. Until that happens, the market may either consolidate in a narrow range or show false breakouts followed by quick reversals. Traders should avoid anticipating moves and instead react to confirmed price action.
On the bullish side, if Bank Nifty manages to sustain above 59550 on a 15-minute closing basis, it would indicate that buyers are gaining control despite the overhead supply. In such a scenario, call options can be considered above 59550. The first upside target would be around 59750, which is a minor resistance and a good zone for partial profit booking. If momentum continues, the next levels to watch are 59850 and then 59950 or higher. Near the 60000 psychological level, strong profit booking is expected, so trailing stop-loss becomes crucial for long positions.
On the bearish side, failure to hold above 59550 followed by a breakdown below the 59450–59400 zone would indicate rejection from higher levels. This would open the door for a corrective move. In that case, put options can be considered around 59450–59400. The immediate downside targets would be 59250 and then 59150. If selling pressure increases, the index could drift toward the 59050–59000 support zone. A clear break below 59050 would weaken the structure further, though such a move would likely require negative global cues or heavy institutional selling.
For intraday traders, the zone between 59450 and 59550 should be treated as a no-trade area, as price action here can be choppy and misleading. The best trades are expected only after the market shows clear acceptance above resistance or below support. Partial profit booking at every target and strict risk management are essential due to the possibility of sudden spikes on either side.
Overall, Bank Nifty is at a crucial decision point. Sustained trade above 59550 favors bullish continuation, while rejection and breakdown below 59400 may lead to a pullback. The session is likely to be volatile but structured, rewarding traders who stick to levels, wait for confirmation, and avoid emotional or over-leveraged positions.
Technical Analysis

COAL INDIA (1W) – Breakout From Long Consolidation | Key Levels 🟢 What’s Happening on the Chart?
• COAL INDIA was in a strong uptrend earlier and then entered a long sideways consolidation
• Price formed a solid base with multiple rejections from the same zone
• Recently, price broke and reclaimed the key resistance area
• Old resistance is now acting as new support (very bullish sign)
📌 Key Levels (Simple & Clear):
• Support: ₹420–₹430
• Resistance: ₹470–₹500
• Major Supply Zone: ₹500–₹520
• Trend Invalid Below: ₹410 (weekly close)
📈 Price Action Insight:
• Strong bullish weekly candle
• Breakout + retest structure visible
• Buyers are in control as long as price holds above support
💡 Bias:
• Bullish above ₹420
• Expect consolidation or continuation towards higher levels
⸻
⚠️ Disclaimer
This chart analysis is only for educational purposes.
I am not a SEBI-registered advisor.
This is not a buy or sell recommendation.
Trading and investing involve market risk.
Always do your own research or consult a SEBI-registered professional.
⸻
❤️ If this analysis helps, do like & save for future reference
(Weekly levels work best when saved 👀📌)

Bitcoin at Demand: Where Most Traders Panic and Smart Money WaitWhen I look at this chart, I don’t see weakness.
I see price reacting exactly where it should .
Bitcoin is sitting above a clearly defined demand zone, and instead of collapsing, price is slowing down and compressing.
That usually tells me the market is absorbing liquidity, not distributing .
Key things I’m focusing on:
Price is holding above ascending demand , which shows buyers are still defending structure.
Reactions from the demand zone are clean , not impulsive, a sign of controlled participation.
Overhead supply is present , which explains the compression instead of an instant breakout.
RSI bullish divergence adds confidence that downside momentum is weakening near demand.
My mindset here:
I’m not chasing moves.
I’m not panicking into demand.
I’m simply watching how price behaves here , because this zone decides whether the next move expands or fails.
As long as structure holds, patience matters more than prediction.
Disclaimer:
This analysis is for educational purposes only. Not financial advice. Always manage your risk.

Bitcoin Is Reacting, Not Breaking, Patience Before the Next MoveWhen I look at this chart, I don’t see panic or trend failure. I see price pulling back into a clearly defined demand area within a rising structure and responding from it. That matters. If sellers were truly in control, price wouldn’t pause here, it would slice through demand without hesitation. Instead, Bitcoin is holding above structure, absorbing selling pressure, and stabilising.
The repeated rejections from the upper supply zone show that resistance exists, but the key point is this: sellers are unable to push price into a breakdown. Momentum has cooled, volatility has compressed, and RSI has reset without price collapsing, all signs of balance, not weakness.
This phase feels slow and uncomfortable, especially for traders who expect constant movement, but historically this is where the market builds the base for its next decision. I’m not interested in chasing price near resistance, and I’m not interested in panic selling into demand. I want to observe how price behaves here, because reactions at structure tell the real story. As long as Bitcoin continues to respect this rising demand and doesn’t accept below it, the broader structure remains intact and upside expansion stays on the table. A clean break below structure would force me to rethink, until then, patience is the position. Sometimes the best trades don’t come from predicting the next candle. They come from waiting while price proves who is actually in control.
Disclaimer: This analysis is for educational purposes only and not financial advice. Always manage risk and trade according to your own plan.

XAUUSD (Gold) | Bull vs Bear Scenerio | 28th Jan'2026XAUUSD (Gold) | Technical Outlook | 28 Jan 2026
Gold (XAU/USD) is trading near 5,291, maintaining a strong bullish trend across intraday, daily, and higher timeframes. Price is holding firmly above all major moving averages (MA5–MA200), confirming trend strength. Momentum indicators (MACD, ADX, ROC, Bull/Bear Power) support further upside, while oscillators (RSI, Stoch RSI, CCI, Williams %R) remain overbought, indicating strong momentum with chances of short-term pullbacks. Volatility remains high (ATR ~59), so key levels are crucial.
Key Levels
Support: 5,232 | 5,198 | 5,135 | 5,101
Resistance: 5,295 | 5,330 | 5,392
Intraday Pivot: 5,232
Breakout & Breakdown
Bullish (Breakout):
Buy Above: 5,295
Targets: 5,330 → 5,392 → 5,400
Trend continuation above resistance
Bearish (Breakdown):
Sell Below: 5,232
Targets: 5,198 → 5,135
Below 5,100 → 5,000–4,950 (correction zone)
Conclusion
Overall trend remains bullish. Buy-on-dips above support is preferred, but avoid chasing near highs due to overbought conditions. Trade strictly on breakout or breakdown confirmation with proper risk management.
Disclaimer :For educational purposes only. Gold trading involves high risk. Always use stop-loss and trade as per your risk appetite.

Gold at ATH before FOMC shakeout first or straight breakout?🧭 Macro Snapshot
Donald Trump maintains a hardline stance, increasing military presence in the Middle East → geopolitical risk remains elevated.
Tonight’s key focus: Federal Reserve
Political pressure and questions around Fed independence.
DXY continues to weaken, retesting major historical support (2020–2022) → supportive for gold.
👉 Conclusion: Geopolitics + a weaker USD set the bullish bias, while the Fed determines short-term volatility.
📊 Intraday Range to Watch
Upper range: 5,280 – 5,305
Lower range: 5,190 – 5,160
→ High probability of range trading and liquidity absorption ahead of the Fed decision.
🟢 Support
5,220–5,225 | 5,150–5,165 | 5,080–5,085 | 5,050–5,060
🔴 Resistance
5,280–5,294 | 5,300 | 5,315 | 5,380–5,385
⚠️ Strategy Notes
Expect possible fake moves / stop hunts within the range.
Avoid chasing highs or catching tops without confirmation.
Focus on price reaction at key levels and stay disciplined.
Summary: Gold is fundamentally supported, but today the key is how price reacts within 5,160–5,305.
Be patient — wait for confirmation — trade the reaction.

Part 1 Institutional vs. Technical What Is an Option?
An option is a contract that gives you the right, but not the obligation, to buy or sell an underlying asset at a specific price before a specific time.
There are two types:
• Call Options
A call gives you the right to buy the asset at a predetermined price.
You buy calls when you expect the market to go up.
• Put Options
A put gives you the right to sell the asset at a predetermined price.
You buy puts when you expect the market to go down.
The price at which the transaction occurs is called the strike price, and the last date the option is valid is the expiry.

#NIFTY Intraday Support and Resistance Levels - 28/01/2026A gap-up opening in Nifty 50 reflects a positive overnight sentiment, likely driven by global cues or short-covering from lower levels. However, even after the gap-up, the index is still trading within a well-defined range, which means today’s move will be highly level-based rather than a straight trending day unless a strong breakout is seen.
Market Structure & Key Zones
The 25200–25250 zone is acting as a crucial pivot area for the session. This zone has repeatedly worked as both support and resistance in the recent past, making it a decisive region for intraday direction.
If Nifty holds above 25250, it signals strength and confirms that buyers are willing to defend higher levels.
Failure to sustain above this zone may drag the index back into the lower support band.
Bullish Scenario (Above 25250)
If price sustains above 25250, long positions can be considered with a bullish bias.
Upside targets are placed at:
25350 – first resistance and intraday booking zone
25400 – minor supply area
25450+ – strong resistance and previous rejection zone
A clean break and sustain above 25450 can further strengthen bullish momentum, but near these levels, profit booking is expected. Hence, partial exits and trailing stop-loss are advised.
Bearish Scenario (Below 25200)
If the index rejects the 25250–25200 zone and slips below 25200, bearish momentum can build up quickly. In such a case, short positions become favorable with downside targets at:
25100 – first support
25050 – intraday demand zone
25000 – major psychological and technical support
A decisive breakdown below 25000 would weaken the structure further and may invite panic selling, though bounce attempts can also emerge from this level due to its psychological importance.
Trading Approach for the Day
Despite the gap-up opening, Nifty is still not in a clear trend. The index needs price acceptance above resistance to continue upward. Until then, expect volatile, two-way moves around key levels.
Best approach for today:
Avoid chasing the gap
Trade only after confirmation near support/resistance
Book partial profits at each target
Keep strict stop-losses due to whipsaw risk
Overall, the bias remains cautiously positive above 25250, while below 25200 the tone turns weak. Discipline and level-based execution will be the key to navigating today’s session successfully.

#BANKNIFTY PE & CE Levels(28/01/2026)A gap-up opening in Bank Nifty indicates a positive start to the session, supported by short-covering and fresh buying interest from lower levels. The index has opened above the immediate intraday support zone, which suggests that bulls are attempting to regain control after recent consolidation. However, despite the gap-up, the market is still trading within a broader range, so confirmation through price sustain is crucial before assuming a strong trending move.
From a technical structure point of view, the 59050–59100 zone is acting as a major demand and decision area. Holding above this region keeps the bullish bias intact for the intraday session. If Bank Nifty sustains above 59050, buying Call options becomes favorable, with upside targets placed near 59250, followed by 59350, and then 59450+. These levels correspond to previous supply zones and minor swing highs, where profit booking or partial exit should be considered due to potential resistance.
A stronger bullish continuation will only be confirmed if the index manages to break and sustain above 59550. Above this level, momentum buying can accelerate, opening the path towards 59750, 59850, and eventually 59950+, which is a major resistance area marked by previous rejections. This zone is critical, as failure to cross it decisively may again push the index back into consolidation or minor correction.
On the downside, 59450–59400 is the first intraday support. A breakdown below this zone may trigger short-term weakness, making Put options attractive with targets around 59250, 59150, and 59050. If selling pressure increases and Bank Nifty slips below 58950, the structure turns weaker, and further downside targets open up towards 58750, 58650, and 58550, which are stronger demand zones from where bounce-back attempts can emerge.
Overall, the gap-up opening reflects positive sentiment, but the market is still trading near crucial resistance bands. Traders should avoid chasing the gap and instead focus on price acceptance above key levels. A sustained move above resistance confirms bullish strength, while rejection from higher zones can quickly lead to a pullback. Maintaining strict stop-losses, booking partial profits near targets, and trading strictly based on levels will be essential due to expected volatility around these zones.

USDJPY – A Global Repricing Phase, Not a Random MoveWhen I look at USDJPY, this move doesn’t feel random to me. It looks like part of a broader global adjustment phase rather than something driven by this pair alone.
Price Context:
Price spent a long time reacting from a major supply zone before showing a clear structure shift. Since then, the market has been respecting an ascending channel, with higher highs and higher lows.
Why this move makes sense:
As global risk sentiment shifts and interest rate expectations change, currencies often move together. That’s why similar moves are visible across multiple FX pairs, this is a broad-based repricing, not a pair-specific reaction.
Current Structure:
The recent pullback into demand and trend support looks like a healthy retracement, not a breakdown. As long as this structure holds, the broader trend remains intact.
Disclaimer: This analysis is for educational purposes only and does not constitute financial advice. Trading involves risk.

GBPUSD – Support Holding, Watching Reaction From RangeGBP/USD has reacted from a well-defined support zone, an area where buyers have stepped in multiple times before. Price is currently trading between clear support and resistance, indicating a short-term range environment.
As long as this support holds, upside reactions toward the resistance zone remain possible. A clean break below support, however, would weaken this structure and change the short-term bias.
This is a reaction-based zone, not a prediction. Let price confirm the next move.
Disclaimer: This analysis is for educational purposes only and does not constitute financial advice. Trading involves risk. Please manage risk responsibly.

#NIFTY Intraday Support and Resistance Levels - 27/01/2026A gap-up opening near the 25200 zone in Nifty indicates an attempt by the market to stabilize after recent selling pressure, but the broader structure still suggests a range-bound to weak undertone unless key resistance levels are decisively crossed. The gap-up itself is not a confirmation of trend reversal; instead, it places the index right at an important decision-making area, where both buyers and sellers are active. The initial 30 minutes of trade will be critical to judge whether the gap sustains or starts filling.
From a technical perspective, the 25250–25300 region is acting as a major intraday resistance. This zone has previously seen supply and rejection, which means any upside move without volume support may struggle here. A reversal long setup becomes valid only if Nifty sustains above 25250, with follow-through buying. In such a case, upside targets can be projected towards 25350, 25400, and 25450+, where partial profit booking is advisable due to overhead supply and previous breakdown levels.
On the downside, 25200–25150 is the immediate support band. Failure to hold above this level, especially if the gap starts getting filled, can invite fresh selling pressure. A breakdown below 25200 opens up a short-selling opportunity, with downside targets around 25100, 25050, and 25000. These levels are psychologically and technically important, and price reactions here should be watched closely for potential intraday bounces.
If selling momentum intensifies and Nifty breaks below 24950, it would signal continuation of the broader bearish structure. Below this level, the index may slide towards 24850, 24800, and 24750, where stronger demand zones are placed. These lower levels can act as temporary support, but trend reversal should only be considered after clear price confirmation and structure change.
Overall, the market is showing a gap-up within a corrective or consolidation phase, not a confirmed bullish trend yet. Traders should remain level-driven, avoid chasing the opening move, and wait for price acceptance above resistance or breakdown below support. Tight stop-losses, partial profit booking, and disciplined risk management are essential, as volatility and false breakouts are likely around the current zone.

Next week: Will gold listen to the Fed… or the White House?🔎 Context
Next week could be highly volatile as monetary policy and geopolitics converge.
Donald Trump signaled a potential 100% tariff on Canadian goods if Canada moves closer to trade deals with China—raising trade-war risks.
At the same time, military assets are being deployed en masse around Iran, heightening concerns that tensions could escalate.
👉 Safe-haven flows may return, with gold potentially opening the week gap-up and early buying.
🧠 Quick take
Primary trend: Bullish
At elevated prices: a short, sharp shakeout is possible to absorb liquidity
No top/bottom calls—watch price reactions at key zones
📌 Key levels to watch
🟢 Supports: 4920–4900 | 4890–4882 | 4850–4830 | 4660–4640
🔴 Observation resistances: 5006–5030–5090 | 5110–5115 | Current ATH
🎭 Weekly scenarios (reference only)
Early week: Gap-up / early push
Pre-FOMC: Chop & liquidity sweep
Then: Deep shakeout or base-building and continuation
👉 Distribution at the top—or just a pause before the next leg higher?

Biocon: Range to Trend Expansion in ProgressBiocon’s weekly chart highlights a well-structured range-bound consolidation transitioning into a rising trend. Over the past several quarters, the stock has repeatedly faced supply near the upper resistance zone around 400–420, as marked by multiple rejections. This clearly establishes a strong overhead resistance where sellers have historically dominated.
On the downside, price action has respected a rising support trendline, forming higher lows over time. Each dip toward this support zone has attracted fresh buying interest, indicating accumulation at lower levels. This combination of flat-to-rising resistance and rising support reflects improving demand strength and a gradual tightening of price structure.
The recent pullback toward the support area near 360–370 is technically healthy rather than bearish. Such retracements often act as retest phases, allowing the market to absorb supply before attempting the next directional move. As long as Biocon holds above this rising support, the broader bullish structure remains intact.
A decisive weekly close above the resistance band (420+) would confirm a breakout from this prolonged consolidation. Post-breakout, the chart opens room for a strong upside expansion, with projected targets gradually extending toward the 460–500 zone based on the height of the prior range and trend continuation principles.
From a risk perspective, the setup stays valid while price sustains above the rising trendline. A breakdown below this support would delay the bullish thesis and could push the stock back into consolidation. Until then, Biocon remains in a favorable positional structure, where patience around support and confirmation near resistance can offer high-quality risk–reward opportunities for medium- to long-term traders and investors.

XAUUSD 4HR T/F ----- FORMATION OF ARC ---
xauusd 4hr t/f analysis------
formation of arc and it`s dual direction structure bow current situation we can expect breakdown of down side then we can see previous demand interchange into supply like structure mapping let`s see

#NIFTY Intraday Support and Resistance Levels - 23/01/2026A flat opening is expected in Nifty 50, indicating continuation of the ongoing consolidation after the recent sharp sell-off and recovery attempts. The index is currently trading in a well-defined range, where buyers and sellers are both active near key levels, resulting in choppy price action. This kind of opening usually suggests that the market is waiting for fresh triggers and confirmation before committing to a directional move, especially after multiple volatile sessions.
From a technical standpoint, the 25250–25300 zone is acting as an important intraday support and decision-making area. If Nifty manages to sustain above 25250, it signals short-term strength and opens the door for a reversal-based long trade. In such a case, upside targets can be expected near 25350, followed by 25400 and 25450+, where previous supply zones are placed. However, traders should note that this upside is likely to face resistance near 25450, which remains a strong hurdle unless there is a clear breakout with volume.
On the downside, the 25450–25400 zone continues to behave as a strong resistance area. Any rejection or failure to sustain above this region can trigger selling pressure again. Short positions can be considered near 25450–25400 with a cautious approach, aiming for pullbacks towards 25350, 25300, and 25250. This makes the upper range a selling-on-rise zone rather than a breakout-buying zone, unless price decisively closes above resistance.
If Nifty breaks and sustains below 25200, the structure may turn weak once again. A breakdown below this level can accelerate downside momentum towards 25100, 25050, and 25000, which are important psychological and technical supports. Any sharp move into these lower levels could invite temporary bounces, but overall sentiment would remain cautious as long as the index trades below the major resistance zones.
Overall, the broader view suggests a range-bound market with mild bearish undertones, where aggressive trades should be avoided. Traders are advised to focus on level-based trades, book partial profits quickly, and keep strict stop-losses. Patience will be key, as a clear directional move is likely to emerge only after Nifty breaks out decisively from this consolidation range.

#BANKNIFTY PE & CE Levels(23/01/2026)A flat opening is expected in Bank Nifty, indicating a pause after the recent volatile swings and suggesting that the market is entering a short-term consolidation phase. Price action over the last few sessions clearly shows sharp intraday moves on both sides, followed by quick pullbacks, which reflects indecision and lack of strong directional conviction among participants. This kind of structure usually favors level-based trading rather than aggressive trend-following trades, especially during the first half of the session.
From a technical perspective, the 59050–59100 zone is acting as a crucial intraday pivot and demand area. As long as Bank Nifty holds above this region, the bias remains mildly positive with scope for a gradual upside move. Sustained trading above 59100 can trigger fresh long interest and short covering, which may push the index towards 59250, followed by 59350 and 59450+. However, this upside is likely to be slow and grindy, not impulsive, unless there is a strong breakout candle with volume confirmation above the higher resistance.
On the flip side, the 59450–59400 zone continues to behave as a strong supply and selling area. Any rejection from this region, especially if the price forms long upper wicks or fails to sustain above it, can invite renewed selling pressure. In such a scenario, PE buying near 59450–59400 becomes valid, with downside targets towards 59250, then 59150, and 59050. This makes the 59400–59500 band a critical area where traders should be extremely cautious and avoid chasing breakouts without confirmation.
If selling pressure intensifies and Bank Nifty breaks decisively below 59050, the structure may again turn weak. A breakdown below this support can open the gates for a deeper correction towards 58950–58900, and further down to 58750, 58650, and 58550. These lower levels are strong higher-timeframe supports, so any sharp fall into these zones could again attract bounce-based buying, keeping volatility elevated.
Overall, the broader trend still leans sideways to mildly bearish, with repeated failures near resistance and limited follow-through on rallies. Traders should focus on support-resistance reactions, avoid overtrading during choppy moves, and wait for clear confirmation before committing to large positions. A disciplined approach with strict risk management will be crucial, as Bank Nifty is likely to remain range-bound with sudden spikes on either side during the session.

GBPUSD – Breakout Retest Looks Healthy, Bulls in ControlGBP/USD has been trading below a falling resistance trendline for quite some time. Recently, price managed to break above this trendline, which is the first sign that selling pressure is weakening.
After the breakout, price did not continue straight up. Instead, it came back for a retest, and that retest is holding well so far. This is usually a healthy sign, showing that buyers are willing to step in at higher levels instead of letting price fall back below structure.
What Price Is Telling Us:
Price is respecting the previous resistance as support and forming higher lows. Sellers are trying, but they are unable to push price back below the trendline. This behavior often appears when the market is preparing for continuation rather than reversal.
As long as price holds above this zone, the bullish bias remains intact, with upside levels marked on the chart. A clean breakdown below the structure would invalidate this view.
This is a structure-based idea, not a prediction. Let price do the work.
If this analysis helped you, like, follow, and comment for more clean Forex breakdowns.
Disclaimer: This analysis is for educational purposes only and does not constitute financial advice. Trading involves risk, and past performance does not guarantee future results. Please manage risk responsibly.

USDCHF – Gap Down From Resistance, Price Testing Key Support!USD/CHF was trading near a well-defined resistance zone where price has faced repeated rejection in the past. This clearly showed that sellers were active at higher levels and the market was struggling to sustain upside momentum.
From this resistance, the market opened with a gap down, which often signals aggressive selling and position unwinding rather than a slow intraday move. The gap was also supported by short-term U.S. dollar weakness, as the market adjusted expectations around risk sentiment and interest rates. When dollar weakness aligns with technical resistance, price usually reacts sharply.
After the gap down, price moved lower toward a major support zone, an area where buyers have previously stepped in. This makes the current zone a key decision point, either buyers defend again, or further downside continuation opens up.
This move is a result of both technical rejection and fundamental pressure, not random price action.
Disclaimer
This analysis is for educational purposes only and does not constitute financial advice. Trading involves risk, and past performance does not guarantee future results. Please manage risk responsibly.

SUPREMEIND – STWP Equity Snapshot 📊 SUPREMEIND – Technical & Educational Snapshot
Ticker: NSE: SUPREMEIND
Sector: 🧪 Chemicals / Plastics
CMP: 3,500.80 ▲ (+4.15% | 22 Jan 2026)
Learning Rating: ⭐⭐⭐⭐☆ (Neutral–Range with Recovery Bias)
Chart Pattern Observed: 📊 Range Structure with Recovery from Demand
Candlestick Pattern Observed: Bullish Engulfing
📊 Technical Snapshot
SUPREMEIND is attempting a short-term stabilisation after a sharp corrective phase, with the latest daily candle showing a strong bullish response from lower demand zones. RSI is placed near 52.5, indicating neutral momentum with early signs of internal strength but no overbought pressure yet. Stochastic is around the mid-zone, suggesting recovery from oversold conditions rather than trend exhaustion. Bollinger Bands remain wide, reflecting elevated volatility and a market still adjusting after the decline, while price continues to trade below major supply zones — keeping the broader structure range-bound with recovery bias. MACD remains subdued, highlighting that momentum improvement is still developing rather than fully established. Price is currently interacting near the CPR band, which is relatively wide, typically associated with range-bound or two-sided price action. As long as price remains within or below the CPR zone, upside moves may face supply pressure, while sustained acceptance above the CPR pivot would be required to signal any meaningful directional shift.
📊 Volume Analysis
🔹 Current Volume: ~536K
🔹 Average Volume (20-period): ~252K ✅
💥 Volume is running at more than 2× the recent average, confirming active participation during the rebound from demand.
💡 Interpretation: Higher-than-average volume near support zones suggests genuine buying interest and supply absorption. However, for any sustained move toward upper range resistance, similar volume expansion will be required near higher levels to confirm acceptance.
🔑 Key Levels – Daily Timeframe
Support Areas: 3373 | 3258 | 3194
Resistance Areas: 3552 | 3616 | 3731
These are zones where price has paused or reacted earlier.
What’s Catching Our Eye: Sharp demand-led rebound with strong participation.
What to Watch For: Acceptance above CPR and nearby resistance.
Failure Zone: Loss of the recent demand base.
Risks to Watch: Overhead supply and wide CPR.
What to Expect Next: Range-bound move with recovery bias.
Bullish Case: Sustained Demand absorption may support recovery.
Bearish Case: Failure to hold Demand base risks deeper reversion.
Momentum Case: Strong Rebound momentum, needs follow-through.
STWP Equity Snapshot – SUPREMEIND
Intraday Setup:
Entry: 3,500.8
Invalidation level: 3,237.11
Reference 1: 3,817.23
Reference 2: 4,028.18
Swing Setup (Hybrid Model – 2–5 days):
Entry: 3,500.8
Invalidation level: 3,151.67
Reference 1: 4,199.06
Reference 2: 4,722.75
STWP View: Momentum: Strong | Trend: Range | Risk: High |Volume: High
Learning Note: Focus on structure, risk per trade and clean reviews – not prediction.
Disclaimer:
Educational view only. Not a Buy/Sell recommendation. Please consult a SEBI-registered advisor before making any decision. STWP is not responsible for trading decisions based on this post.
💬 Did this help you read the chart better?
🔼 Boost | ✍️ Comment | 🔁 Share with a learner
👉 Follow STWP for clean chart-reading insights
🚀 Stay Calm. Stay Clean. Trade With Patience.

POLICYBZR - STWP Equity Snapshot📊 STWP Equity Snapshot – PB Fintech Ltd (POLICYBZR)
(Educational | Chart-Based Interpretation)
POLICYBZR continues to trade within a well-defined range structure, with repeated rejection from the 1960–2000 supply / distribution zone and consistent buyer activity emerging near the 1650–1609 demand / value zone. The stock has once again reverted from upper supply and is currently attempting a recovery from this demand region. The area around 1720–1740 now acts as a near-term balance zone. Holding above this region keeps the recovery attempt structurally valid and allows price to test higher reaction zones near 1755 and 1790, where selling pressure has appeared previously. However, sustained acceptance above these levels would be required to improve directional confidence. On the downside, continued weakness below 1650, and especially below 1609, would signal structural weakness and increase the probability of deeper mean reversion within the range. Until either boundary is resolved, price action should be viewed as rotation rather than trend development.
Recent market conditions reflect a neutral but stabilising environment. The recent strong bullish candle highlights buyer response from demand, but not trend confirmation. Bollinger Band behaviour shows that price is emerging from a compressed phase, with early expansion attempts visible, though follow-through remains limited. The BB squeeze context indicates potential for movement, but direction remains undecided. RSI near 45–46 reflects balanced momentum, consistent with a range-bound market rather than a trending phase. Price interaction with short-term averages suggests short-term stabilisation, while the wide CPR structure reinforces expectations of two-sided activity, consolidation, and rotational price behaviour instead of immediate directional continuation.
Volume analysis adds important context to the recovery attempt. Participation has improved during the recent bounce from demand, indicating active buyer involvement rather than a low-liquidity reaction. At the same time, volume intensity remains moderate (Vol X near 1.0), with no signs of climax or exhaustion. Selling phases have not been accompanied by aggressive volume expansion, suggesting controlled supply rather than panic distribution. Overall, volume behaviour supports range stability and validates the demand-side response, while still falling short of confirming accumulation or breakout intent.
From a short swing perspective, POLICYBZR remains structurally neutral as long as price trades between the 1650–1609 demand zone and the 1960–2000 supply zone. Acceptance above intermediate resistance would be required to shift bias toward higher range expansion. Conversely, sustained acceptance below 1609 would elevate downside risk and suggest continuation of mean reversion toward lower structural levels. Until such confirmation occurs, consolidation and rotational movement within the range should be expected.
Final Outlook (Condition-Based):
Momentum is improving but not decisive, the trend remains range-bound, risk is elevated due to overhead supply, and volume is supportive but non-confirmatory.
💡 STWP Learning Note
In range markets, demand reactions show interest — only acceptance above supply confirms intent.
⚠️ Disclaimer
This post is shared strictly for educational and informational purposes. It is not investment advice or a recommendation. Please consult a SEBI-registered financial advisor before making any financial decision.
🚀 Stay Calm. Stay Clean. Trade With Patience.

ASTRAL - STWP Equity Snapshot📊 STWP Equity Snapshot – Astral Ltd (ASTRAL)
(Educational | Chart-Based Interpretation)
ASTRAL continues to trade within a broader range-bound structure, with price oscillating between well-defined supply and demand zones rather than establishing a sustained trend. After facing rejection near the 1593–1600 supply zone, price moved into a corrective phase and recently reacted from the 1333–1293 demand region, where buyers have previously stepped in. The current price is stabilising near the 1424 balance area, which now acts as an important near-term reference. Holding above this zone keeps the structure intact and allows price to retest higher reaction zones near 1441–1470, where selling pressure has emerged earlier. On the downside, sustained weakness below 1367, and more importantly below the 1333 demand zone, would increase downside risk and reinforce the broader range structure. Until price decisively exits either boundary, movement should be viewed as rotation within the range rather than trend development.
Indicator readings reflect a mixed but stabilising environment. The recent strong bullish candle with open near the low signals short-term buyer response from demand rather than trend confirmation. Bollinger Band behaviour highlights prior volatility contraction, with early signs of expansion emerging, though follow-through remains limited. The BB squeeze context suggests the market is transitioning from compression toward potential movement, but direction is still undecided. RSI near 47 indicates balanced momentum, neither weak nor strong, aligning with the ongoing range structure. Price interaction with short-term averages shows attempts at stabilisation, while a wide CPR structure reinforces the expectation of two-sided trade and consolidation rather than immediate directional continuation.
Volume behaviour provides constructive but cautious confirmation. Participation has expanded during the recent rebound, indicating active involvement from buyers near demand rather than a low-volume reaction. At the same time, volume intensity remains within a healthy range (Vol X ~1.4–1.5), with no signs of climax or exhaustion. Selling phases have not shown aggressive volume expansion, suggesting supply pressure is controlled. Overall, volume dynamics support range stability and recovery attempts but stop short of confirming accumulation or breakout intent.
From a short swing perspective, ASTRAL remains structurally neutral as long as price trades between the 1333–1293 demand zone and the 1593–1600 supply zone. Acceptance above intermediate resistance levels would be required to improve directional confidence toward higher range-expansion zones. Conversely, sustained acceptance below 1293 would elevate downside risk and shift focus toward deeper structural demand. Until either boundary is resolved, consolidation and rotation within the range should be expected.
Final Outlook (Condition-Based):
Momentum is improving but not decisive, the trend remains range-bound, risk stays elevated due to proximity to both demand and supply, and volume is supportive but not confirming a directional shift.
💡 STWP Learning Note
Range markets reward patience and structure awareness more than prediction.
⚠️ Disclaimer
This post is shared strictly for educational and informational purposes. It is not investment advice or a recommendation. Please consult a SEBI-registered financial advisor before making any financial decision.
🚀 Stay Calm. Stay Clean. Trade With Patience.

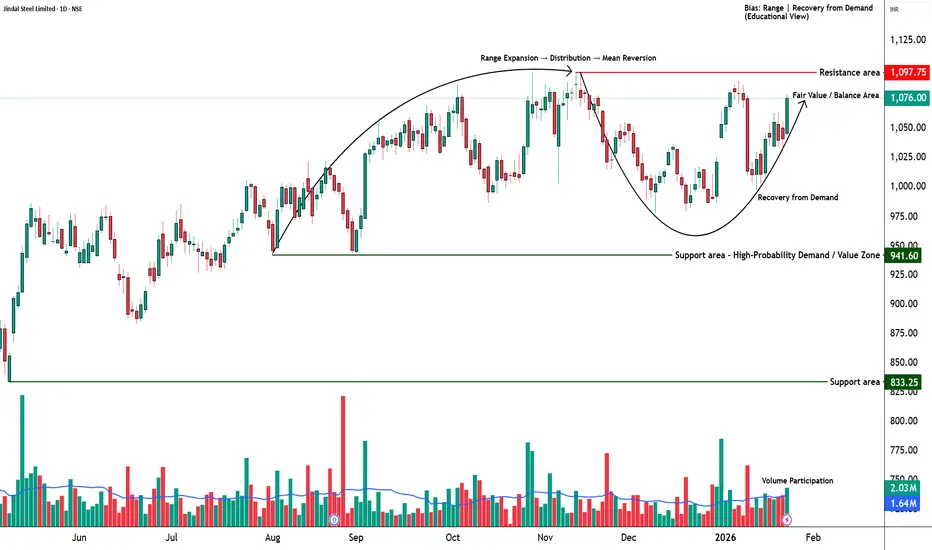
JINDALSTEL - STWP Equity Snapshot📊 STWP Equity Snapshot – Jindal Steel Ltd (JINDALSTEL)
(Educational | Chart-Based Interpretation)
JINDALSTEL is trading within a broader upward structure while navigating a short-term recovery from a recent corrective phase. Price has rebounded strongly from the 1031–1019 demand zone, an area that has historically attracted buyers and acted as structural support. The current price is stabilising near the 1079 balance area, which now serves as a key near-term reference for structure. Holding above this zone keeps the short-term structure constructive and allows price to test higher reaction zones near 1089–1101, where prior supply has emerged. Acceptance above these zones would be required to improve directional confidence. On the downside, any sustained weakness below 1053 initially, and more importantly below 1031, would increase downside risk toward deeper demand and signal a return to range-bound or corrective behaviour. As long as price remains above the primary demand zone, the broader uptrend framework remains intact.
Indicator readings from the green dashboard support a developing bullish structure but with conditions. The presence of a strong bullish candle reflects renewed buyer initiative after consolidation, while Bollinger Band behaviour highlights a prior compression phase now transitioning into early expansion. The BB squeeze context increases the relevance of the current move, suggesting improving volatility conditions rather than a late-stage rally. RSI near 60 indicates strengthening internal momentum without entering stretched or overbought territory, supporting continuation potential while keeping exhaustion risk contained. Price holding above short-term trend measures and VWAP reinforces near-term stability. However, interaction with a wide projected CPR structure suggests that the market environment still favours balance and consolidation, meaning follow-through and acceptance matter more than single-session strength.
Volume behaviour adds an important layer of confirmation. Participation has expanded during bullish candles, indicating active buyer involvement rather than a low-liquidity bounce. Volume intensity remains around healthy levels (Vol X ~1.3), showing interest without signs of climax or emotional excess. Recent pullbacks have not been accompanied by aggressive selling volume, suggesting that supply is being absorbed rather than distributed. Overall, volume dynamics support a controlled recovery and align with accumulation-type behaviour rather than exhaustion.
From a short swing perspective, JINDALSTEL maintains a constructive bias as long as price holds above the 1031–1019 demand zone. If acceptance improves above nearby supply, higher range-expansion reference zones around 1192–1278 come into focus over the coming sessions. Conversely, sustained acceptance below 1019 would elevate downside risk and indicate a shift from recovery into a deeper corrective or range phase. Until such a failure occurs, consolidation above demand should be viewed as structural digestion rather than weakness.
Final Outlook (Condition-Based):
Momentum is strong and improving, the broader trend remains upward, risk stays elevated due to nearby supply and a wide CPR environment, and volume remains supportive but requires continued follow-through.
💡 STWP Learning Note
Strong candles initiate moves; structure and acceptance decide sustainability.
⚠️ Disclaimer
This post is shared strictly for educational and informational purposes. It is not investment advice or a recommendation. Please consult a SEBI-registered financial advisor before making any financial decision.
🚀 Stay Calm. Stay Clean. Trade With Patience.