3330 Liquidity Zone – A Fresh Bullish Structure is Emerging!The 3330 liquidity zone continues to prove its strength as gold rebounds sharply from this level, forming a clean new bullish structure on the M30 timeframe. Buyers are now pushing price to trade around 334x, and if this momentum holds, the next upside targets lie at the FIB – CP Zones above 335x and 336x.
On the higher timeframe, the corrective wave is still in play, but short-term price action is opening opportunities for both BUY & SELL setups, provided we time our entries with precision.
Market Context & Key News
Today, the market will be watching the Trump–Putin meeting, which could trigger sharp geopolitical-driven moves.
This Friday also brings the usual liquidity sweep, adding to potential volatility.
That’s why MMFLOW recommends observing the trend closely to pick safe entry points and avoid getting caught in false breaks.
Trading Plan
1. SELL Zones
3355 – Prime OBS SELL ZONE, expecting strong reaction.
3362 – Higher resistance, aligned with the descending trendline. Note: Best to take entries here if reached during Asia or early London; late London/NY session tests are prone to false break traps.
2. BUY Zones
Watch 3334 – 3336 for early BUY entries on lower timeframes.
Safe stop-loss: below 3330.
If 3330 breaks → wait patiently for BUY opportunities around 331x.
Action Strategy
Prioritise early BUYs at 3334–3336 with confirmation signals.
SELL at 3355 or 3362 if clear rejection occurs.
Manage risk strictly – SL below 3330 for BUYs and above 3365 for SELLs.
💡 MMFLOW NOTE: This is gold – volatility can erupt at any moment. Control your emotions, wait for precise setups, and you’ll gain the edge.
Technical Analysis

XAUUSD consolidates, awaiting a reboundFollowing last night’s US PPI data coming in higher than expected (0.2% vs. 0.0%), XAUUSD faced strong selling pressure as markets priced in expectations that the Fed will keep interest rates higher for longer. This boosted the US Dollar and Treasury yields, pushing gold down to around 3,346 USD.
Technically, price is still moving within a wide sideways range between 3,284 and 3,450 USD, but the short-term trend remains capped by a descending trendline from recent highs. The 3,346 USD zone is acting as a trendline touchpoint, potentially leading to a sideways accumulation around 3,312 – 3,346 before a mild rebound.
If the 3,284 USD support holds, the probability of a technical bounce toward 3,346 – 3,379 USD is high, especially as buyers may use the range’s lower boundary to accumulate positions. Conversely, a break below 3,284 USD could trigger stronger selling pressure toward 3,254 USD.

BTCUSDT – Uptrend ContinuesThe chart shows that Bitcoin (BTC) is moving within a strong ascending channel , with strong support at 117,300 USD. The current pattern indicates that each time the price tests this support level, BTC bounces back strongly, showing that buying pressure is dominant. The price has continuously broken through key resistance levels and is now heading towards 130,000 USD , where it may encounter strong resistance .
Regarding the news, although there are no direct events impacting Bitcoin today, the global cryptocurrency market continues to benefit from the stability of other risk assets and growing interest in assets like Bitcoin. Expectations for cryptocurrency adoption in major countries and the increase in Bitcoin investment funds are also driving the uptrend.
Currently, BTC is facing resistance at 3,407 USD, and if it breaks through successfully, it could continue to rise towards 3,450 USD. However, strong support remains at 3,330 USD, which could lead to a bounce if there is a minor pullback.
Strategy:
Buy around 117,300 USD, with a target of 130,000 USD.
Stop loss below 117,000 USD to protect the position in case the support is broken.

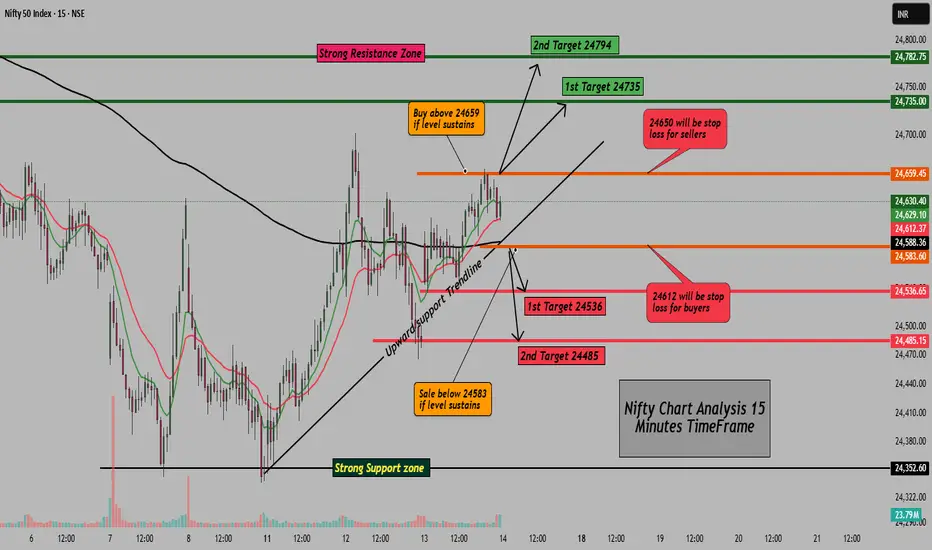
Nifty Intraday Analysis, Key Levels & Trade Plan for 14 Aug 2025Good Morning Traders,
Yesterday, Nifty maintained a bullish tone throughout the session, respecting the upward support trendline and closing near the higher levels. Price action stayed above key psychological support zones, hinting at buying interest on dips. Resistance near the 24,660 area acted as a hurdle, and today’s session will decide whether bulls can take control for higher targets or sellers will step in at resistance.
Important Levels for Nifty (15-Minutes Timeframe):
Intraday Support Zone: 24,583 – 24,536
Intraday Resistance Zone: 24,659 – 24,735
Buy Setup:
Buy above 24,659 if the level sustains for at least 15 minutes .
Targets: 24,735 / 24,794
Stop Loss: 24,612
Sell Setup:
Sell below 24,583 if the level sustains for at least 15 minutes .
Targets: 24,536 / 24,485
Stop Loss: 24,650
Trend Bias: Neutral-to-bullish above 200 EMA; bearish bias if price sustains below it .
Note: Levels are for reference. When a trade setup forms, I will update it in the live market, stay tuned .
Disclaimer: This analysis is for educational purposes only. Please do your own research or consult a financial advisor before trading .
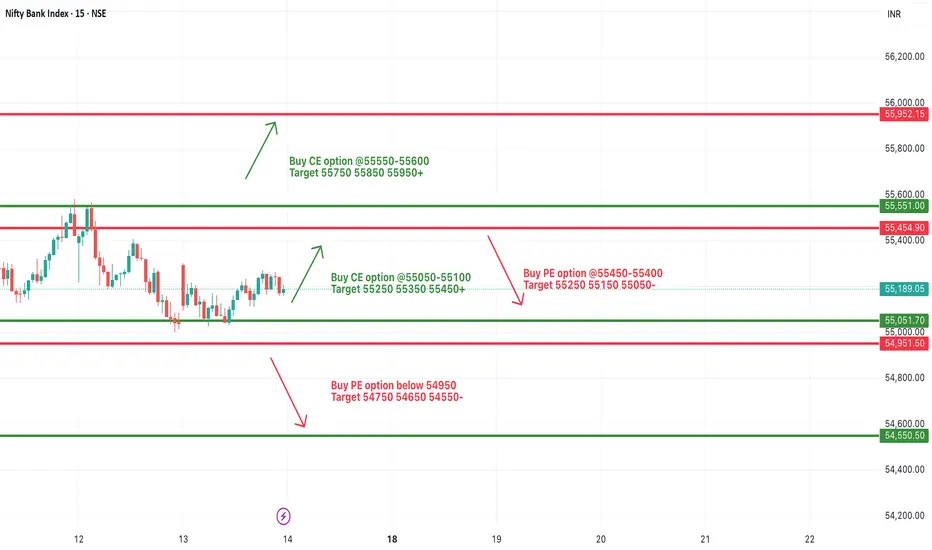
[INTRADAY] #BANKNIFTY PE & CE Levels(14/08/2025)Bank Nifty is expected to open flat today, with no significant changes from yesterday’s levels. The key upside zone remains at 55,050–55,100, where a sustained move above could trigger bullish momentum toward 55,250, 55,350, and 55,450+. A further breakout above 55,550–55,600 may extend gains toward 55,750, 55,850, and 55,950+.
On the downside, weakness may emerge if the index slips below 55,450–55,400, opening targets at 55,250, 55,150, and 55,050-. A break below 54,950 could intensify selling pressure toward 54,750, 54,650, and 54,550-. Traders should monitor these pivot levels closely and trade in the direction of the breakout while keeping strict stop losses.
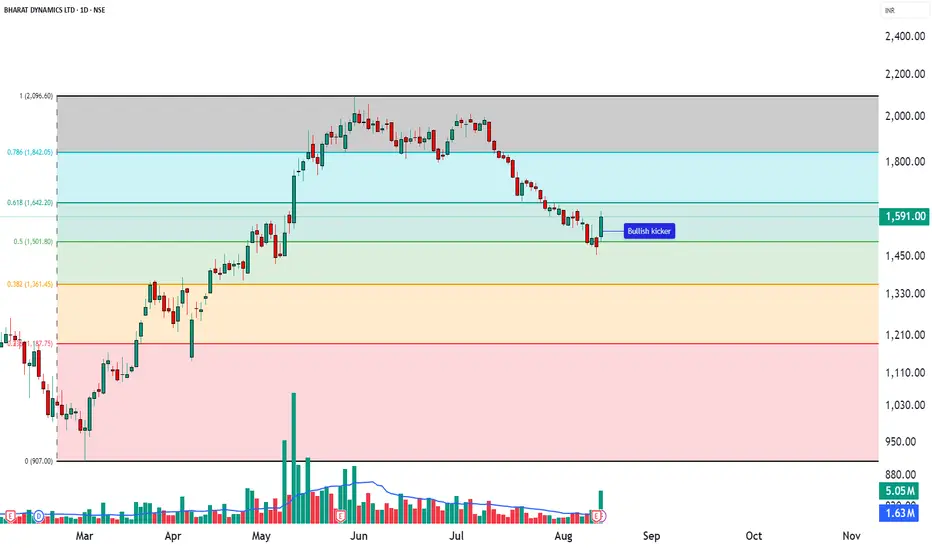
BDL - “Bullish Kicker Candlestick – Educational Analysis” ________________________________________
📊BDL – Technical & Fundamental Educational Snapshot
Ticker: NSE: BDL | Sector: 🏭 Defence & Aerospace
CMP: ₹1,591 ▲ (as of 13 Aug 2025)
Rating: ⭐⭐⭐⭐ (Moderately Bullish Setup – Educational Purposes Only)
Pattern Observed: 📈 Bullish Kicker Candlestick Pattern
________________________________________
Bullish Kicker Candlestick – Educational Analysis (BDL, NSE)
The Bullish Kicker is a strong reversal candlestick pattern, signaling a sudden shift from bearish to bullish sentiment. Studying this pattern helps traders understand price action and momentum dynamics.
________________________________________
Key Features:
Gap up from previous candle → sudden change in market sentiment.
No overlap between candle bodies → shows aggressive bullish control.
Bears initially in control, but strong buying pushed the price higher.
________________________________________
💡 Volume Confirmation
Kicker candle volume: 5.05M, compared to 20-day average of 1.63M.
Higher-than-average volume indicates strong participation and validates momentum from an educational perspective.
________________________________________
Support & Resistance Zones
📈Support Zones: 1525, 1460, 1417
📉 Resistance Zones: 1633, 1676, 1741
Patterns near strong support or after a downtrend are typically more reliable for educational analysis.
________________________________________
🔍 Indicator Insights
RSI: 42 – recovering from oversold levels.
VWAP: Bullish – indicates intraday support and momentum.
These indicators provide additional context for studying the pattern, not for direct trading decisions.
________________________________________
⚖️ Trade Planning Concepts (Educational Only)
Entry Concept: Observe the close of the kicker candle, or wait for the next candle to break above its high.
Stop Loss Concept: Slightly below the low of the kicker candle (~1502).
Reference Levels: Nearby resistance zones (1633, 1676, 1741) or risk-reward frameworks.
________________________________________
💡 Risk Management Concepts
Limit risk per study trade (e.g., 1–2% of capital).
Patterns may fail if subsequent price action invalidates the momentum.
________________________________________
Note: Bullish Kickers often follow impactful news or earnings. Observing volume and confirmation indicators is essential to understand price action dynamics.
________________________________________
⚠️ Disclaimer – Please Read Carefully
The information shared here is meant purely for learning and awareness. It is not a buy or sell recommendation and should not be taken as investment advice. I am not a SEBI-registered investment advisor, and all views expressed are based on personal study, chart patterns, and publicly available market data.
Trading — whether in stocks or options — carries risk. Markets can move unexpectedly, and losses can sometimes be larger than the money you have invested. Past performance or past setups do not guarantee future results.
If you are a beginner, treat this as a guide to understand how the market works — practice on paper trades before risking real money. If you are an experienced trader, remember to assess your own risk, position sizing, and strategy suitability before entering any trade.
Data, prices, and analysis are based on information available as of 12 August 2025, and market conditions can change at any time. Always verify with reliable sources and consult a SEBI-registered financial advisor before making any real trading decision.
By reading, watching, or engaging with this content, you acknowledge that you take full responsibility for your own trades and investments.
________________________________________
💬 Found this useful?
Drop your thoughts, questions, or setups in the comments — let’s grow together!
🔁 Share this post with fellow traders and beginners to spread clean, structure-based learning.
✅ Follow simpletradewithpatience for beginner-friendly setups, price action insights, and disciplined trading content.
🚀 Stay Calm. Stay Clean. Trade With Patience.
Trade Smart | Learn Zones | Be Self-Reliant 📊
________________________________________
GOLD SURGES AFTER CPI – TARGETING 337x BEFORE SELL-OFF? MMFLOW TECHNICAL OUTLOOK
📌 Market Overview
Following the CPI release, gold reacted with strong buying momentum (FOMO BUY), pushing prices swiftly from the 333x area up to 335x.
The main driver here is the BUY side taking advantage of remaining liquidity gaps above, aiming to break through the critical 3358 resistance – the first major barrier before reaching 337x, a key equilibrium zone that previously acted as a strong price-holding area for SELL orders.
Current structure indicates:
Short-term trend: Bullish, but approaching key distribution levels.
Liquidity Hunt: A decisive break above 3358 with strong volume could trigger a rapid move towards 337x, activating SELL volume from pending limit orders.
Macro context: No major news events today, with expected daily range ~35–40 points, increasing the chance of range-bound traps before a breakout.
🧐 Technical Outlook – MMFLOW View
Market Structure: Gold has formed a Higher Low around 333x and is now testing short-term resistance.
Key Levels & Liquidity Zones:
Liquidity BUY ZONE at 3338–3336 has reacted well, confirming BUYers are still defending this zone.
Supply Zone / CP Zone at 3375–3377 aligns with an H1 Order Block, holding a high concentration of pending SELL orders.
Volume Flow: Increasing volume as price approaches resistance suggests a potential “last push” before a reversal.
🎯 MMFLOW Trading Plan
🔹 BUY SCALP – Following the main trend
Entry: 3338 – 3336
SL: 3332
TP: 3342 – 3346 – 3350 – 3355 – 3360 – 3370 – 3380
🔹 SELL SCALP – At the distribution zone
Entry: 3375 – 3377
SL: 3382
TP: 3370 – 3365 – 3360 – 3355 – 3350 – 3340
📊 Key Technical Levels
Resistance: 3358 – 3365 – 3376
Support: 3342 – 3337 – 3330 – 3310
💡 MMFLOW Insight: With the current setup, the optimal strategy is to wait for a BUY opportunity near early support (334x) to ride the short-term bullish momentum, then watch for price reaction at 337x to catch potential SELL entries once top-side liquidity is swept.

Strong USD, Gold "Holding Its Breath" at Key ResistanceYesterday, gold prices continued to trade within a tight range of 3,340–3,355 USD , reflecting the tug-of-war between buyers and sellers. Selling pressure is still present but not strong enough to break the key support level.
On the news front: Both the U.S. Core PPI m/m and PPI m/m are forecast to rise 0.2% (vs. 0.0% previously), while unemployment claims are expected to dip from 226K to 225K . This signals inflationary pressure from the production side and a resilient labor market , which could prompt the Fed to maintain a tight monetary policy. A stronger USD puts short-term downward pressure on gold.
From the chart: Gold is moving within a sideway range of 3,340 – 3,363 USD after being rejected at the 3,363 USD resistance zone. The price structure shows consolidation with minor technical pullbacks. The 3,312 USD support remains intact; if it holds, buyers may step back in.
Suggested strategy:
Look for buy opportunities around 3,312 – 3,320 USD if support holds, with a target at 3,363 USD. Place stop-loss below 3,305 USD to limit risk.
Question: Do you think gold has enough momentum to break 3,363 USD and start a new bullish leg this week?

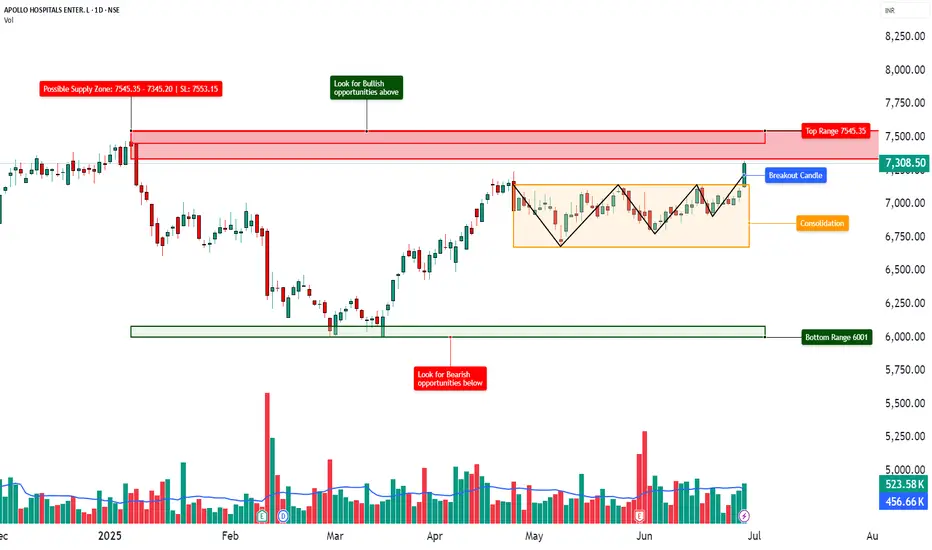
APOLLOHOSP - TECHNICAL ANALYSIS________________________________________________________________________________
📈 Apollo Hospitals Enterprises Ltd. (APOLLOHOSP) – TECHNICAL ANALYSIS
📆 Date: June 28, 2025 | Timeframe: Daily Chart
🔍 For Educational Purposes Only
________________________________________________________________________________
📊 Structure Overview
• Pattern: Rounded "W" Base Breakout
• Breakout Level: ₹7,324
• Current Price: ₹7,308.50 (pullback after breakout)
• Volume: 523.58K vs avg. 456.66K – confirming breakout strength
• Trend Bias: Bullish (as long as price sustains above ₹7,176–₹7,043)
________________________________________________________________________________
📌 Key Zones
🔺 Top Range Resistance: ₹7,545.35
📛 Possible Supply Zone: ₹7,545.35–₹7,345.20 | SL: ₹7,553.15
🟧 Consolidation Zone: ₹6,750–₹7,300
🟩 Demand Support: ₹7,176 / ₹7,043 / ₹6,969
🔻 Bottom Support Range: ₹6,001 (long-term demand base)
Resistance Levels:
• ₹7,382.5
• ₹7,456.5
• ₹7,589.0
Support Levels:
• ₹7,176.0
• ₹7,043.5
• ₹6,969.5
________________________________________________________________________________
🧠 Technical Signals
✔️ Rounded W pattern breakout
✔️ Bollinger Band expansion (BB Squeeze OFF)
✔️ RSI around 62 – showing strength
✔️ SuperTrend & VWAP supportive during breakout
✔️ Sectoral tailwind: Hospitals gaining traction in current market narrative
________________________________________________________________________________
🎯 STWP Educational Trade Plan (For Study Only)
• Entry (Breakout Retest): ₹7,324
• Stop Loss: ₹6,989
• Risk: ₹335/share
• Position Size: 50 shares
• Risk-Reward Ratio: 1:1 | 1:2+
📌 Setup Logic: Volume-backed W Breakout + Consolidation Range Break + Sector Strength
________________________________________________________________________________
⚠️ Cautionary Notes
• Breakdown below ₹7,043 = weakening structure
• If price gets rejected at ₹7,456, sideways action likely
• Always track volume + RSI for divergence signs
________________________________________________________________________________
📢 Disclaimer
This is a study-based chart analysis shared for educational purposes only. It is not a buy/sell recommendation. The author is not SEBI-registered. Please consult a SEBI-registered advisor before making any investment decisions.
________________________________________________________________________________
💬 Your Turn:
Do you think ₹7,545 will break or will price revisit ₹7,000 first?
👇 Drop your view or chart in the comments — let’s grow together!
________________________________________________________________________________
STWP | Learn. Trade. Grow.
________________________________________________________________________________
LUPIN LIMITED – Technical Analysis________________________________________
📊 LUPIN LIMITED – Technical & Fundamental Snapshot
Ticker: NSE:LUPIN | Sector: Pharmaceuticals
Current Market Price (CMP): ₹1,944.20 ▲ (+4.99%) (as of August 7, 2025)
Chart Pattern: Consolidation Zone (Between ₹1,795.20 and ₹2,225)
Market Sentiment: ⭐⭐⭐ Neutral-to-Positive
________________________________________
🔍 What’s Happening on the Chart?
Lupin’s stock is moving sideways — like it's stuck in a box.
📦 Box Range: Between ₹1,795.20 (bottom) and ₹2,225 (top)
👉 Current price is near the middle at ₹1,944.20 — this means buyers and sellers are in a tug of war.
________________________________________
🕯️ Candle & Indicator Analysis (Simplified)
Here’s what the chart is telling us:
📈 Bullish Marubozu Candle:
Strong green candle — indicates buyers were in control all day.
VWAP (Volume Weighted Avg. Price):
✅ Positive — suggests big players (institutions) may be buying.
MACD (Momentum):
⚠️ Bearish — signals that upside momentum is still not strong.
RSI (Relative Strength Index):
52 = Neutral — price isn't overbought or oversold.
Stochastic Indicator:
69 and rising — momentum could be picking up soon.
CCI (Commodity Channel Index):
–17 = Slight weakness, but still within a normal zone.
🧠 What This Means:
The chart is not strongly bullish yet, but it’s showing early signs. Wait for price to break out of the range to confirm strength.
________________________________________
🧭 Key Levels to Watch (Support & Resistance)
📌 Resistance (where price may face selling pressure):
R1: ₹1,980
R2: ₹2,015
R3: ₹2,077
📌 Support (where price may bounce from):
S1: ₹1,882
S2: ₹1,820
S3: ₹1,784
________________________________________
🚨 Breakout Watch Zone
📈 If price breaks and holds above ₹1,980–₹2,015, momentum may increase.
📉 A fall below ₹1,795 might look bearish, but if it bounces back quickly, it can be a false breakdown.
🧠 Beginner Tip:
Don’t rush into a trade. Wait for a close above key levels to confirm direction. Patience protects your capital.
________________________________________
📰 Recent News & Sentiment Update
🧾 Strong Q1 FY26 Results:
Net Profit: ₹1,221 Cr (↑ 52% YoY)
Revenue: ₹6,164 Cr
💥 Stock Reaction:
Price jumped nearly 5% after the earnings report.
⚠️ Macro Risk Alert:
US President Trump hinted at tariffs up to 250% on pharma imports. If this happens, Indian pharma exporters like Lupin could be impacted. (📢 Source: The Economic Times )
________________________________________
📈 Investment Outlook (Short & Long Term)
⏳ Short-Term:
Watch price near ₹1,980–₹2,015 zone
If it breaks out, there may be upside potential
If not, expect more sideways movement within the ₹1,795–₹2,225 range
📆 Long-Term:
If growth continues and tariff fears cool down, the stock may head towards ₹2,200–₹2,375
________________________________________
🧠 STWP’s Educational Trade Idea (Not a Recommendation)
🎯 Watch for potential long trade above: ₹1,952.70
🛑 Stop Loss (to manage risk): ₹1,834.35
💡 Risk-Reward Idea: 1:1 minimum, aim for 1:2 or better
⚠️ This is not a buy or sell signal. It’s shared to help understand trade planning.
________________________________________
🔰 Trading Note for Beginners:
Don’t just buy based on news or a green candle. Use levels, wait for confirmation, and always define your risk with a stop loss.
________________________________________
⚠️ Disclaimer (Please Read Carefully):
This content is shared strictly for educational and research purposes only.
I am not a SEBI-registered investment advisor, and no buy or sell recommendations are being made.
All views expressed are based on personal market analysis and experience. They are not intended as financial advice.
Trading — especially in derivatives like options — involves significant financial risk. Losses can exceed your initial investment.
👉 Always do your own research and consult a certified SEBI-registered advisor before making any investment or trading decisions.
👉 Use proper risk management and only trade with capital you can afford to lose.
The author assumes no responsibility or liability for any trading losses incurred from acting on this content.
By engaging with this material, you agree to these terms.
________________________________________
💬 Found this helpful?
Drop your thoughts, questions, or insights in the comments below ⬇️ — let’s learn together!
🔁 Share this post with your trading friends and community — help them discover clean charts, structured setups, and zone-based learning.
✅ Follow simpletradewithpatience for clear setups, educational content, and a no-nonsense approach to price action, supply-demand zones, and risk-managed trades.
🚀 Trade with patience. Trust your charts. Stay clear-headed.
Because the goal is not just to trade — it's to trade better.
Be Self-Reliant | Trade with Patience | Learn with Charts & Zones 📊
________________________________________

PAYTM – Technical & Fundamental Analysis📊 PAYTM – Technical & Fundamental Educational Snapshot
Ticker: NSE: PAYTM | Sector: 🏦 Digital Payments & Financial Services
CMP: ₹1,122 ▲ (as of 11 Aug 2025)
Rating: ⭐⭐⭐⭐☆ (Moderately Bullish Setup – Educational Purposes Only)
Pattern Observed: 🏆 Cup & Handle (Monthly)
PAYTM has been forming a Cup & Handle pattern on the monthly time frame, indicating the possibility of a bullish continuation. The stock recently closed at ₹1,122 (11 Aug 2025), approaching its immediate resistance zone of ₹1,151 – ₹1,180, with a potential extension toward ₹1,321 if momentum sustains. On the downside, support levels are placed at ₹1,072, ₹1,021, and ₹992. Technical indicators show RSI at 70 (breakout zone), CCI at 103, and Stochastic at 93, signaling strong momentum. While WVAP trend remains bullish and volume surged to 9.41M vs 20-SMA volume of 7.7M, the MACD is still in bearish territory, suggesting caution. Given the 52-week breakout and strong price structure, the setup currently leans bullish for swing trades, provided price holds above key supports.
One97 Communications (Paytm): Shares have gained analyst attention following a 13% rally over the past month. SEBI-registered analyst Mayank Singh Chandel highlighted Paytm’s first-ever operational profit in Q1, marking a major turnaround from losses seen just 18 months prior, bolstered by the complete exit of Chinese investor Antfin in August 2025, which is expected to improve regulatory compliance. Meanwhile, the company continues to narrow its losses—its Q1 consolidated net loss fell to ₹2.9 billion, down from ₹3.6 billion a year earlier, with a 16% year-on-year increase in revenue to ₹29.8 billion. Technically, the stock is navigating a resistance zone between ₹1,000–₹1,150, with a breakout above ₹1,150 possibly signaling further upside.
Investment Outlook & Conclusion: The stock presents a balanced risk-reward scenario. On the bullish side, continued earnings growth, sector tailwinds, and improving technical structure could support upward momentum. However, downside risks include adverse market sentiment, sectoral weakness, or failure to sustain key support levels. In the short term, price action may remain volatile with potential pullbacks, while in the long term, sustained fundamentals and trend confirmation could offer attractive opportunities.
📊 STWP Trade Analysis – The setup reflects bullish continuation characteristics in classical technical analysis. For educational illustration, a possible framework could consider a reference entry near ₹1,130, supported by an illustrative stop loss at ₹1,046 for risk management. Example upside objectives include ₹1,213 (1:1 Risk-Reward) and ₹1,296 (1:2 Risk-Reward), while a potential pullback reference zone is placed between ₹1,090 – ₹1,080 as a possible retest area.
⚠️ Disclaimer (Read Carefully)
This post is for educational and informational purposes only.
The author is not a SEBI-registered investment advisor. No buy or sell recommendations are being made.
All views are based on chart patterns, publicly available data, and personal learning experience.
Trading involves risk. Losses can exceed your investment. Always consult a SEBI-registered advisor before making financial decisions.
By engaging with this content, you agree to these terms.
________________________________________
💬 Was this useful?
Drop your thoughts, questions, or setups in the comments — let’s grow together!
🔁 Share this post with fellow traders and beginners to spread clean, structure-based learning.
✅ Follow simpletradewithpatience for beginner-friendly setups, price action insights, and disciplined trading content.
🚀 Stay Calm. Stay Clean. Trade With Patience.
Trade Smart | Learn Zones | Be Self-Reliant 📊

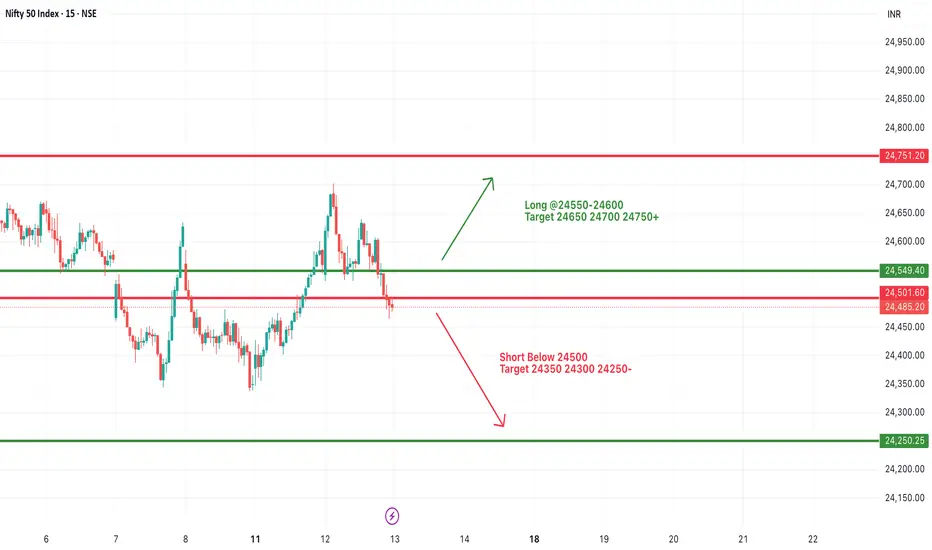
#NIFTY Intraday Support and Resistance Levels - 13/08/2025Nifty is likely to witness a gap-up opening today, indicating a positive start to the session. The 24,550–24,600 zone will act as a crucial breakout area. Sustaining above this range could trigger further bullish momentum, with upside targets at 24,650, 24,700, and 24,750+. A strong close above 24,750 may even extend gains further in the coming sessions.
However, if Nifty fails to hold above 24,550 and slips below 24,500, weakness could set in, opening the path towards 24,350, 24,300, and 24,250-. This makes the 24,550 mark a key pivot point for deciding the intraday bias. Traders should focus on price action around these levels and maintain strict stop losses to manage risk effectively.
[INTRADAY] #BANKNIFTY PE & CE Levels(13/08/2025)Bank Nifty is expected to open with a gap-up today, but sustained bullish momentum will be confirmed only if the index moves above the 55,550–55,600 zone. If this breakout occurs, upside targets could be 55,750, 55,850, and 55,950+. A smaller upward move may also be possible if the index trades above 55,050–55,100, with potential targets at 55,250, 55,350, and 55,450+.
On the downside, if Bank Nifty fails to hold above 55,450–55,400, selling pressure may take it towards 55,250, 55,150, and 55,050-. A deeper decline below 54,950 could extend the fall to 54,750, 54,650, and 54,550-. Traders should watch the 55,550 level closely for directional confirmation.

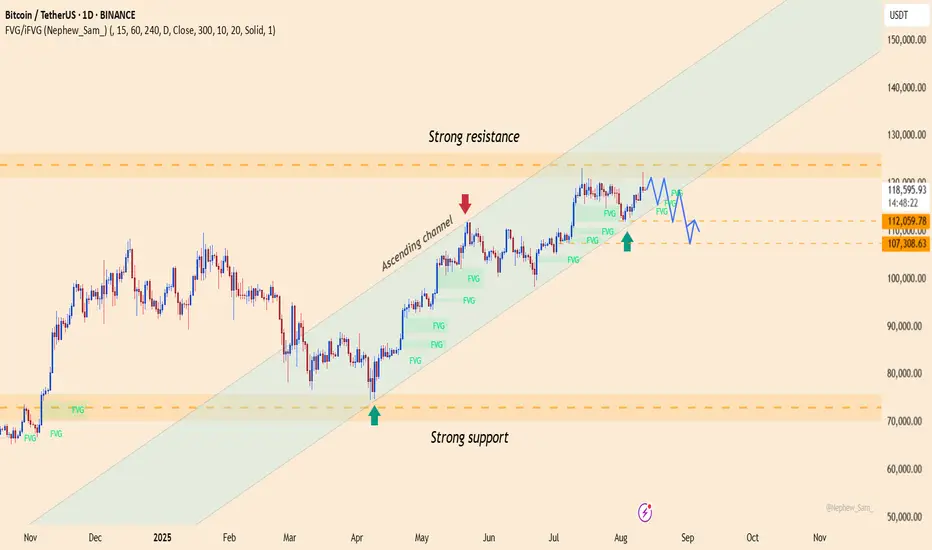
BTCUSDT – Bulls Maintain Control, Upside Scenario IntactOver the past two days , the crypto market has been supported by a series of positive developments: yesterday, U.S. PPI data cooled, easing inflationary pressure and strengthening expectations that the Fed may soon cut interest rates; today, global risk sentiment improved as U.S. and European stock indices rebounded; and most recently, Bitcoin ETF inflows continued to post net gains, signaling that institutional investors remain confident in the bullish trend.
On the daily chart , BTC is still moving within an ascending channel, with a strong resistance zone around 121,000 – 122,000 USDT. Currently, the price is consolidating right near the upper boundary of the channel, showing that buying pressure remains in control. The strong support zone lies between 112,000 – 110,000 USDT, aligning with the channel’s lower boundary.
Preferred strategy: look for buying opportunities if the price pulls back toward 112,000 – 110,000 USDT, targeting a return to 121,000 USDT and potentially new highs. The bullish trend remains intact as long as the price stays within this ascending channel.
PROACHING LIQUIDITY ZONE – WAITING FOR CPI TO DECIDE NEXT MOVE📌 MARKET RECAP
Gold kicked off the week with a sharp $50 drop, breaking through key trendlines and nearby support zones.
The selling pressure came from:
Profit-taking after the recent strong rally.
USD strength expectations ahead of CPI data (forecast ~0.1% better than the previous reading).
Geopolitical factor: Ukraine–Russia ceasefire talks moving towards a conclusion, fueling risk-off sentiment.
🧐 WHAT’S NEXT?
If CPI beats expectations → USD strengthens → Gold could drop further into the Liquidity Zone 333x – 330x.
If CPI disappoints → USD weakens → Gold may quickly bounce back toward key level 337x (previous breakdown zone) for a retest before deciding direction.
🎯 MMFLOW GAME PLAN
1️⃣ BUY SCALP
📌 Entry: 3331 – 3329
📌 SL: 3325
📌 TP: 3335 – 3340 – 3345 – 3350 – 3360 – 3370 – 3380
2️⃣ BUY ZONE
📌 Entry: 3310 – 3308
📌 SL: 3304
📌 TP: 3314 – 3318 – 3322 – 3326 – 3330 – 3335 – 3340 – 3350 – 3360 – ???
3️⃣ SELL SCALP
📌 Entry: 3363 – 3365
📌 SL: 3370
📌 TP: 3360 – 3356 – 3352 – 3348 – 3344 – 3340
4️⃣ SELL ZONE
📌 Entry: 3376 – 3378
📌 SL: 3382
📌 TP: 3372 – 3368 – 3364 – 3360 – 3355 – 3350 – 3340
⚠️ RISK NOTE
CPI is the market’s dice roll – even a small deviation could trigger massive stop hunts.
Always watch the KeyLevels marked on the chart before entering trades.
KAYNES TECHNOLOGY IND LTD – Price Action + ZonesKAYNES TECHNOLOGY IND LTD – Price Action + Zones
Ticker: NSE:KAYNES | Sector: Electronics & Semiconductors
Timeframe: 15-Min | Current Price: ₹6,200.00 ▲ (+0.49%)
Technical View: ⭐⭐⭐⭐ | Chart Setup: Breakout with Zone-Based Trade Planning
Kaynes Technology (NSE:KAYNES) has exhibited strong directional momentum following a structured breakout above a prior consolidation range, as seen on the 15-minute chart. The price surged past intermediate resistance near ₹5,990 and is currently stabilizing around ₹6,200, suggesting trend continuation if supported by further volume. Marked zones like the Top Range (₹6,284) and Bottom Range (₹5,405) provide a visual framework to understand price behavior—where strength above upper resistance may invite bullish setups, while failure to hold could signal re-entry into the lower band. A clearly defined demand zone (₹5,850–₹5,764.50) with an example SL near ₹5,755 offers a contextual learning area to study zone-based entries with risk-reward alignment. Observing volume expansion on the breakout and contraction during consolidation is key for interpreting trend strength. The annotation “Trade as per Trend + Supporting Setup” reinforces the importance of directional bias and confluence. All observations are shared to help learners understand breakout structure, demand zones, and price-volume correlation in a real-world context.
⚠️ Disclaimer & Educational Note
This content is strictly intended for educational and research purposes related to the technical study of Kaynes Technology (NSE:KAYNES). I am not a SEBI-registered advisor, and no buy/sell recommendations are being made. All insights are based on personal chart analysis, price-action interpretation, and educational zone-mapping — not financial advice.
📘 The visual setup in this post demonstrates how traders and learners can study breakout structures, demand/supply zones, price-volume behavior, and risk levels in a controlled technical environment. Tools like support/resistance mapping, volume confirmation, and structure-based SL planning help illustrate disciplined trade preparation. However, trading — particularly in leveraged instruments like options or intraday setups — involves substantial risk, and losses can exceed the initial investment.
👉 Always do your own due diligence and consult a SEBI-registered investment advisor before taking any positions in the market.
👉 Practice strict risk management, and only trade with capital you can afford to lose.
The author assumes no responsibility for financial decisions based on this educational content. By engaging with this content, you acknowledge and accept these terms.
💬 Found this helpful?
Drop your thoughts, questions, or insights in the comments below ⬇️ — let’s learn together!
🔁 Share this post with your trading friends and community — help them discover clean charts, structured setups, and zone-based learning.
✅ Follow simpletradewithpatience for clear setups, educational content, and a no-nonsense approach to price action, supply-demand zones, and risk-managed trades.
🚀 Trade with patience. Trust your charts. Stay clear-headed.
Because the goal is not just to trade — it's to trade better.
Be Self-Reliant | Trade with Patience | Learn with Charts & Zones 📊

GODREJ CONSUMER PRODUCTS – Price Action + ZonesGODREJ CONSUMER PRODUCTS – Price Action + Zones
Ticker: NSE\:GODREJCP | Sector: FMCG
Timeframe: 15-Min | Current Price: ₹1,259.00 ▼ (−0.08%)
Technical View:⭐⭐⭐⭐ | Chart Setup: Range Bound Structure with Demand Zone Revisit in Focus
Godrej Consumer Products (NSE\:GODREJCP) is currently trading within a well-defined short-term range, with resistance capped near ₹1,265.50 and an anchored demand zone around ₹1,224.40–₹1,216.90. The stock has shown prior strength with a breakout above ₹1,244.35, but price is now consolidating between the orange mid-range and red supply zone, reflecting indecision. A clean zone-based structure is visible: the Top Range (₹1,265.50) may trigger bullish momentum if breached with volume, while failure to sustain may invite short setups within the range. The mid-structure zone (₹1,244.35) acts as a trend filter, while the green Demand Zone provides a case study for risk-managed entries — with example SL at ₹1,215.75 and mapped risk of ₹8.65. The Bottom Range (₹1,202.20) defines a lower band, and annotations like “Trade as per Trend + Supporting Setup” guide the learner to wait for trend + confluence. This setup is ideal for understanding how price reacts at key zones, how to frame directional bias within ranges, and how demand zones aid structured trade planning with logical stop-loss levels.
---
⚠️ **Disclaimer & Educational Note**
This content is strictly intended for educational and research purposes related to the technical study of Godrej Consumer Products (NSE\:GODREJCP). I am not a SEBI-registered advisor, and no buy/sell recommendations are being made. All insights are based on personal chart analysis, price-action interpretation, and educational zone-mapping — not financial advice.
📘 The visual setup in this post demonstrates how traders and learners can study breakout structures, demand/supply zones, price-volume behavior, and risk levels in a controlled technical environment. Tools like support/resistance mapping, volume confirmation, and structure-based SL planning help illustrate disciplined trade preparation. However, trading — particularly in leveraged instruments like options or intraday setups — involves substantial risk, and losses can exceed the initial investment.
👉 Always do your own due diligence and consult a SEBI-registered investment advisor before taking any positions in the market.
👉 Practice strict risk management, and only trade with capital you can afford to lose.
The author assumes no responsibility for financial decisions based on this educational content. By engaging with this content, you acknowledge and accept these terms.
---
💬 **Found this helpful?**
Drop your thoughts, questions, or insights in the comments below ⬇️ — let’s learn together!
🔁 Share this post with your trading friends and community — help them discover clean charts, structured setups, and zone-based learning.
✅ Follow **simpletradewithpatience** for clear setups, educational content, and a no-nonsense approach to price action, supply-demand zones, and risk-managed trades.
🚀 *Trade with patience. Trust your charts. Stay clear-headed.*
Because the goal is not just to trade — it's to trade better.
**Be Self-Reliant | Trade with Patience | Learn with Charts & Zones 📊**
---

XAUUSD Drops $55, Bearish Trend Continues!Yesterday, XAUUSD plummeted from $3,398 to $3,342 , losing more than $55 in just one trading session. This sharp decline pushed XAUUSD below a crucial support level , signaling significant weakness .
This drop confirms that gold is under strong selling pressure , with the market struggling to maintain upward momentum .
Additionally, the m/m CPI came in at 0.3% , higher than the expected 0.2% . This indicates inflation is rising faster than anticipated, increasing expectations that the Fed will continue raising interest rates.
This outcome could strengthen the USD , which typically leads to a drop in gold prices. This factor further supports the bearish outlook for XAUUSD.
The price is now approaching a near resistance level at $3,362 , a key point that may limit further upside potential. The near support is located at $3,310, and this will be tested if the price breaks through the resistance at $3,362.
Conclusion: With the combination of strong bearish price action, a stronger USD driven by CPI data, and technical structure supporting the downtrend, XAUUSD appears to be in a strong bearish trend. Risk management should be a priority as the price could test new lows near $3,310, and if this level breaks, the bearish trend could accelerate.

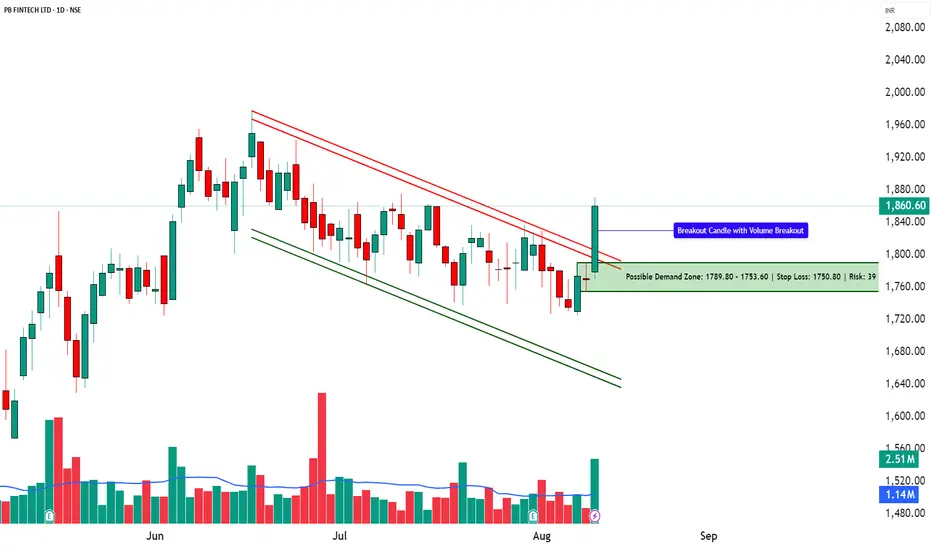
POLICYBZR – Technical & Fundamental Analysis | Channel Breakout📊 POLICYBZR – Technical & Fundamental Educational Snapshot
Ticker: NSE: POLICYBZR | Sector: Digital Insurance & Fintech
CMP: ₹1,860.60
Rating: ⭐⭐⭐ (Neutral to Moderately Bullish Setup – Educational Purposes Only)
Pattern Observed: 📈 Channel Breakout
________________________________________
POLICYBZR (CMP: ₹1,860.6) is exhibiting a Channel Breakout formation, supported by a strong bullish candle. The stock has moved from a bottom range of ₹1,558.4 towards the top range of ₹1,978, with key resistances placed at ₹1,898, ₹1,935, and ₹1,998, while supports are noted at ₹1,797, ₹1,733, and ₹1,696. Technical indicators show RSI at 59 (breakout zone), a bullish MACD crossover, CCI at 122, and Stochastic at 93, indicating strong upward momentum. The price action has also seen a Bollinger Band breakout and is trading above VWAP, suggesting bullish bias. Volume surged to 2.51M shares, significantly higher than the 20-day average of 1.14M, indicating institutional participation. Based on current momentum, there is a possibility of breakout continuation; however, traders should monitor support levels for any reversal signals.
As of early August 2025, PB Fintech’s insurance platform Policy Bazaar has been penalised ₹5 crore by the insurance regulator for certain regulatory lapses, leading to a short-term decline of around 2–3 percent in its share price. Despite this development, the company reported a 33 percent year-on-year increase in Q1 revenues, with net profit rising by 50 percent, supported by a 35 percent growth in core insurance premium collections to approximately ₹6,616 crore. In addition, its enterprise arm has introduced “ClaimSetu”, an AI-powered claims insights and scoring tool for group health insurance, aimed at streamlining documentation and potentially improving claim processing efficiency by up to 50 percent.
From an investment perspective, the outlook for PB Fintech (Policy Bazaar) remains mixed, with both upside potential and downside risks. On the bullish side, sustained revenue growth, rising profitability, and continued expansion in insurance premium collections reflect strong operational momentum. The introduction of AI-driven claim processing solutions could enhance efficiency and customer experience, potentially boosting market share over time. However, the bearish view factors in recent regulatory penalties, heightened compliance scrutiny, and the possibility of short-term sentiment pressure on the stock price. In the short term, price action may remain volatile as the market digests recent developments and broader market conditions. Over the long term, the company’s growth trajectory will depend on successful regulatory compliance, execution of technology-led initiatives, and maintaining a competitive edge in the digital insurance space.
________________________________________
📊 STWP Trade Analysis – Based on the STWP trade framework, a backtest-style example of a possible breakout setup could involve a long entry near ₹1,870.7 with a protective stop at ₹1,722.2. In similar past setups, price movements have reached zones such as ₹2,019 (approx. 1:1 risk–reward) and ₹2,168 (approx. 1:2 risk–reward).
A more conservative hypothetical example might involve an entry in the ₹1,870.70–₹1,860.60 zone, with a protective stop at ₹1,832.48 and potential upside zones at ₹1,945 and ₹2,001 — risk–reward will vary based on entry.
Additionally, a pullback scenario could be illustrated with a potential entry near ₹1,842.9, protective stop at ₹1,805.6, and upside zones aligned with resistance levels.
Possible Demand Zone (Illustrative): ₹1,789.80 – ₹1,753.60 with Stop Loss: ₹1,750.80
Approximate Risk: ₹39
________________________________________
⚠️ Risk Reminder:
Price volatility may increase due to regulatory factors, market sentiment, or broader index trends. Past chart patterns and backtests do not guarantee future performance.
________________________________________
⚠️ Disclaimer (Read Carefully)
This post is for educational and informational purposes only.
The author is not a SEBI-registered investment advisor. No buy or sell recommendations are being made.
All views are based on chart patterns, publicly available data, and personal learning experience.
Trading involves risk. Losses can exceed your investment. Always consult a SEBI-registered advisor before making financial decisions.
By engaging with this content, you agree to these terms.
________________________________________
💬 Found this useful?
Drop your thoughts, questions, or setups in the comments — let’s grow together!
🔁 Share this post with fellow traders and beginners to spread clean, structure-based learning.
✅ Follow simpletradewithpatience for beginner-friendly setups, price action insights, and disciplined trading content.
🚀 Stay Calm. Stay Clean. Trade With Patience.
Trade Smart | Learn Zones | Be Self-Reliant 📊
AXIS BANK | Swing Long Setup 📌 AXIS BANK – Wave 2 Completion & Potential Bullish Wave 3 Ahead 🚀
Axis Bank appears to have completed its corrective Wave 2 and may now be gearing up for the next impulsive rally — Wave 3, which is often the strongest in Elliott Wave theory.
---
🧩 Elliott Wave Structure
Wave 1: Strong rally from the lows earlier in 2025, showing clear bullish intent.
Wave 2: Completed as a complex W–X–Y correction , ending around the 50% Fibonacci retracement zone (₹1,079), which is a common reversal area in Elliott Wave patterns.
The substructure inside Wave 2 (marked as a–b–c, w–x–y) shows corrective nature, indicating that the broader uptrend remains intact.
---
📈 Current Outlook & Key Levels
Current Price**: ₹1,073 (hovering near 50% retracement level).
Support Zones:
₹1,051 (38.2% Fib) – minor support.
₹1,005 (23.6% Fib) – strong support and Wave 2 invalidation watch.
Immediate Resistance: ₹1,128 (61.8% Fib).
Breakout Trigger : A sustained close above ₹1,182 will confirm strength and open the path for higher targets.
---
🎯 Upside Targets (Based on Fib Extensions of Wave 1)
Target 1: ₹1,238 (100% projection).
Target 2: ₹1,321 (127.2% extension) – strong Wave 3 projection zone.
---
🔍 Indicators & Market Context
✅ Price has respected the 50% Fibonacci retracement, showing early signs of buyers stepping in.
✅ Moving averages are starting to flatten, and a bullish crossover could be on the way once price pushes above ₹1,128.
✅ Volume remains moderate; a spike in buying volume on breakout would add confidence to the bullish scenario.
---
⚠️ Risk Management
> If price drops below ₹1,005 (Wave 2 low), the bullish Elliott count would be invalidated, and deeper correction may follow. In such a case, it's better to step aside and wait for a fresh setup.
---
📝 Summary
> Axis Bank seems to have finished its Wave 2 correction and is preparing for a possible Wave 3 rally. A breakout above ₹1,182 could start the next bullish leg towards ₹1,238 and ₹1,321. Until then, watch the key supports at ₹1,051 and ₹1,005.
---
**Disclaimer:**
This analysis is for educational purposes only and is not financial advice. Please consult a SEBI-registered financial advisor before making any investment decisions.
#AxisBank #ElliottWave #SwingTrading #Wave3 #PriceAction #TradingViewIndia #TechnicalAnalysis
---

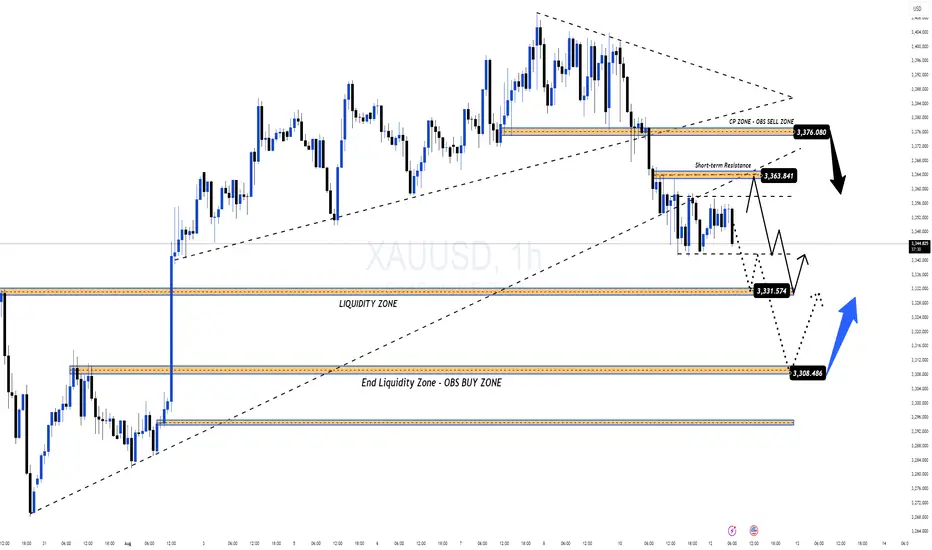
Awaiting the BreakDown or a Snap Back to Resistance?XAUUSD – Game of Patience: Awaiting the BreakDown or a Snap Back to Resistance? | MMFlow Trading
1. Market Context
The week opened with a sharp sell-off in Gold — driven by profit-taking and stop-loss hunting on late-week FOMO BUY positions.
Buying momentum is fading, while sellers are lurking at the ascending channel’s support.
Price is currently reacting at KeyLevel 336x–337x, with H1 candles showing lower wicks → signs of indecision.
2. Technical Outlook
Overall structure: Still within an H1-H4 uptrend channel, but BUY momentum is weakening.
No clear SELL confirmation yet → need a BreakDown from the channel to confirm seller dominance.
Scenario 1: Break the channel → target 335x & 333x zones.
Scenario 2: No break → price may rebound to retest 339x – 340x – 342x resistance levels.
3. Fundamental & Macro View
This week brings major USD economic data: CPI & PPI.
Forecasts lean positive for USD, which could increase downward pressure on Gold.
However, expect false breakouts before/after news releases — risk management is key.
4. MMFlow Trading Plan
BUY SCALP
Entry: 3353 – 3351
SL: 3345
TP: 3358 – 3362 – 3366 – 3370 – 3375 – 3380
BUY ZONE
Entry: 3332 – 3330
SL: 3325
TP: 3336 – 3340 – 3345 – 3350 – 3360 – 3370 – 3380
SELL SCALP
Entry: 3394 – 3396
SL: 3400
TP: 3390 – 3385 – 3380 – 3370 – 3360
SELL ZONE
Entry: 3425 – 3427
SL: 3430
TP: 3420 – 3415 – 3410 – 3405 – 3400 – 3390 – 3380
5. Risk Management
Avoid FOMO — wait for clear candle confirmations before entering.
Reduce position size ahead of CPI/PPI events.
Focus on pre-defined key levels, avoid trading in noise zones.

EUR/USD – Bullish Momentum Still DominatesIn July, the USD rose sharply by around 3.2% thanks to strong GDP data and tax-cut expectations, but this momentum is now fading quickly. Weak employment figures and concerns over the independence of the BLS, following Trump’s dismissal of its head, have undermined confidence in the USD. Goldman Sachs, Citi, and Barclays remain bearish, projecting that EUR/USD could reach the 1.20 area in the medium term.
EUR/USD has maintained an upward trendline since early August, rebounding strongly from 1.1450–1.1500, breaking through FVG, and consolidating above 1.1627. The HH–HL structure confirms the bullish trend. Above 1.1630, price could target 1.1750; a breakout above 1.1750 would open the way to 1.1780–1.1800 (top of the long-term channel).
Trading Plan:
Main Trend: Bullish
Potential Buy Zone: 1.1630 – 1.1650 (upon confirmation signal)
Short-term Targets: 1.1750 → 1.1780
Medium-term Targets: 1.1900 and potentially 1.2000
Sop-loss: Below 1.1600

Gold is about to break out – Big buying opportunity!The chart shows that gold is trading in a clearly defined uptrend channel , with successive higher highs and higher lows, strengthening the solid bullish trend . Price action indicates strong support around 3,300 USD , and if it remains above 3,360 USD , the potential for gold to continue towards the target of 3,450 USD is highly likely. 3,450 USD is a key resistance level; if broken, gold could continue rising strongly to 3,480 USD , reinforcing the market's upward momentum.
News supporting the bullish trend:
The rumor that the U.S. would impose a 39% tax on gold imports from Switzerland triggered a strong buying wave, pushing gold above 3,400 USD . Although the rumor was later denied, the strong reaction still supports market sentiment and maintains the upward momentum.
Additionally, expectations that the Federal Reserve will reduce interest rates in the near future are easing the pressure on gold, a non-yielding asset, making it an attractive investment option in a low-interest-rate environment.
Forecast and trading strategy:
Main Scenario (Bullish Trend): As long as gold stays above 3,360 USD, the upward trend will continue. The next target is 3,450 USD, with the possibility of extending to 3,480 USD if this level is broken.
Entry conditions: Confirmation signals from price action, such as breaking resistance or a bullish candlestick pattern, will be strong entry points. Watch for the breakout of 3,400 USD as a potential buying opportunity.
Risk management: Place a stop-loss below the key support level at 3,360 USD to protect your capital in case the market unexpectedly reverses.
