Is gold back on track?Gold is making a strong recovery from the 3,365 USD support zone and is now hovering around 3,380 USD. After a brief correction, the price has bounced back and is heading toward the key resistance area at 3,396 USD. A breakout above this level would likely open the door for a further move toward the 3,428 USD target.
The bullish sentiment is supported by weaker-than-expected U.S. employment data, which has raised expectations that the Federal Reserve (Fed) may cut interest rates sooner. This is boosting demand for gold as a safe-haven asset.
The short-term trend now leans bullish, as long as the price holds above the 3,365 support. A confirmed breakout above 3,396 could be the signal for the next leg higher.
Technical Analysis

EURUSD – bearish trend remains dominantEURUSD is trading within a clearly defined descending channel. After a slight rebound from the 1.14800 support zone, the price is now retesting the resistance area around 1.16000 – a zone filled with multiple previous Fair Value Gaps (FVGs). If the price fails to break above this level, the bearish trend is likely to continue with a potential move down toward 1.14000.
Latest news:
Weaker-than-expected US job data initially pressured the USD, but growing expectations that the Fed will maintain its tightening stance are helping the dollar recover – putting downward pressure on the euro.
Summary:
If EURUSD fails to break above 1.16000, a continuation of the downtrend toward 1.14000 is likely in the coming days.

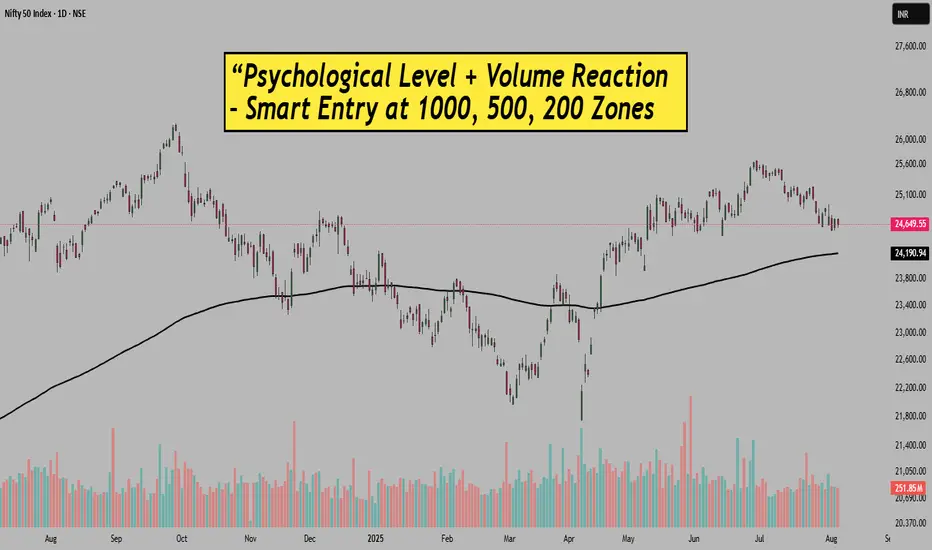
Psychological Level+Volume Reaction–Smart Entry at 1000-500 ZoneHello Traders!
Ever noticed how the market behaves around round numbers like 1000, 200, 500 levels?
There’s something powerful about these zones, not just technically, but psychologically too.
These are the levels where large participants often step in… and smart traders take entry.
Today’s post will help you understand how psychological price levels work — and how to combine them with volume confirmation for better intraday or swing setups.
Why Psychological Levels Matter
Round numbers attract attention:
Levels like 24500, 25000, 25500 in Nifty or BankNifty act as magnets. Institutions, algos, and even retail traders tend to place orders around these levels.
Buyers or sellers take control at these points:
Price often pauses or reverses here, as it becomes a battleground of supply and demand. Especially if this level is also a previous support/resistance zone.
Self-fulfilling behavior of traders:
Because everyone expects a reaction near these zones, price actually reacts. This creates great opportunities if you can enter with the right confirmation.
Volume Confirmation Makes It Powerful
Look for unusual volume near these zones:
Let’s say Nifty hits 24600 and suddenly you see a volume spike on a bullish candle — that’s not coincidence. That’s your cue.
Price rejection with volume is key:
Wick-based candles, engulfing patterns, or inside bars rejecting psychological levels with volume boost often lead to clean intraday moves.
Consolidation + Breakout works best:
If price consolidates near these psychological zones with low volume and breaks out with high volume, it often creates strong directional moves.
Rahul’s Tip:
Instead of randomly entering trades, mark round levels like 24500/24750 on your charts.
Then wait patiently, combine volume + price action and let the trade come to you.
Most false moves get filtered out when you use this setup with discipline.
Conclusion:
These psychological levels are used by big players to trap retail traders, but if you learn to read reactions at these levels, you can trade smarter.
No need to chase. Just observe, react, and manage risk.
What’s your experience with psychological levels? Have they helped your trades?
Share your thoughts in comments.
If this post helped, do like, follow and share with your trader friends.
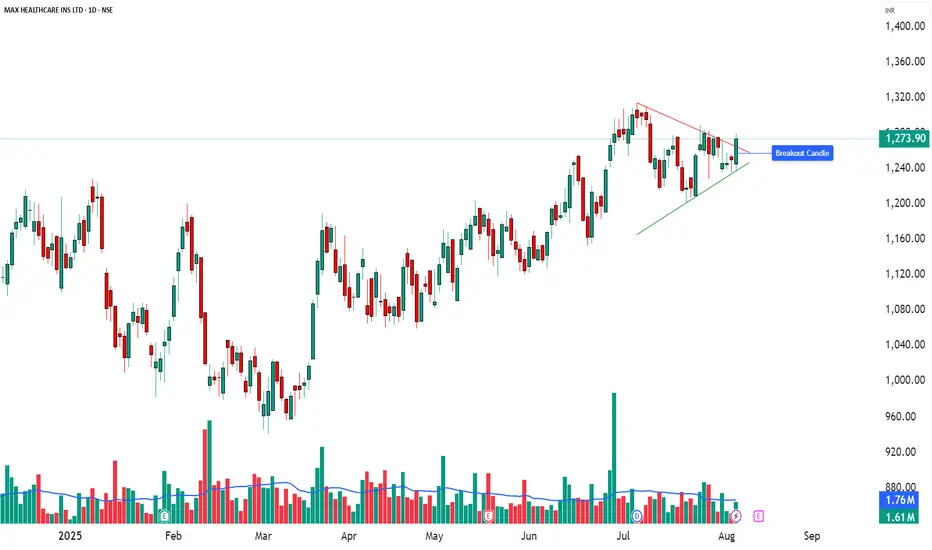
MAXHEALTH – Symmetrical Triangle Breakout________________________________________________________________________________
🧠 MAXHEALTH – Symmetrical Triangle Breakout
📌 Chart Overview
Symbol: `MAXHEALTH` (NSE)
Timeframe: 1D (Daily)
Pattern Identified: 🔺 Symmetrical Triangle
Breakout Confirmation: ✅ Bullish Engulfing
Volume on Breakout: 1.61M (above average)
________________________________________________________________________________
📊 Technical Breakdown (For Educational Use Only)
🔹 Between June and August, MAXHEALTH consolidated into a symmetrical triangle, a classic pattern suggesting price compression.
🔹 A bullish breakout occurred with a strong engulfing candle on above average volume — a potential early signal of trend continuation.
🔹 The breakout occurred near the apex of the triangle, increasing its validity.
💡 Such breakouts are commonly followed by retests or follow through moves. This post is intended to help learners spot and study such setups.
________________________________________________________________________________
📌 Key Reference Levels (Not Trade Levels)
As per the current chart structure, key reference levels for MAXHEALTH include resistance zones at ₹1,290.1, ₹1,306.3, and ₹1,332.6, which may act as potential supply areas in case of continued upward momentum. On the downside, important support zones are observed near ₹1,247.6, ₹1,221.3, and ₹1,205.1, where price could find buying interest if a pullback occurs. These levels are shared purely for technical context and educational study, not as trade recommendations.
________________________________________________________________________________
🧠 Learning Takeaways
✅ Symmetrical Triangle: Indicates indecision and tightening price range. Breakout direction often sets near term tone.
✅ Bullish Engulfing Candle: A strong reversal pattern when formed post consolidation or at trendline breaks.
✅ Volume Confirmation: Adds credibility to breakout strength — look for rising volume on breakouts.
🔍 Always watch for follow up candles, possible pullbacks (retest entries), or invalidation zones to study trade structure in real world setups.
________________________________________________________________________________
⚠️ Disclaimer & Educational Note
This content is strictly for educational and research purposes only. I am not a SEBI-registered advisor, and no buy/sell recommendations are being provided. All insights are based on personal analysis and experience and are not financial advice.
📘 This setup illustrates how combining price action (candlesticks), support/resistance zones, volume, and indicators like RSI or MACD can help build conviction in trades. However, trading—especially in derivatives like options—involves high risk, and losses can exceed the initial investment.
👉 Always do your own research and consult a SEBI-registered advisor before taking any position.
👉 Use strict risk management and only trade with capital you can afford to lose.
The author assumes no liability for any losses incurred.
By engaging with this content, you agree to these terms.
________________________________________________________________________________
💬 Found this helpful?
Drop your thoughts, questions, or insights in the comments below ⬇️ — let’s learn together!
🔁 Share this post with your trading friends and community — help them discover clean charts, structured setups, and zone-based learning.
✅ Follow simpletradewithpatience for clear setups, educational content, and a no-nonsense approach to price action, supply-demand zones, and risk-managed trades.
🚀 Trade with patience. Trust your charts. Stay clear-headed.
Because the goal is not just to trade — it's to trade better.
Be Self-Reliant | Trade with Patience | Learn with Charts & Zones 📊
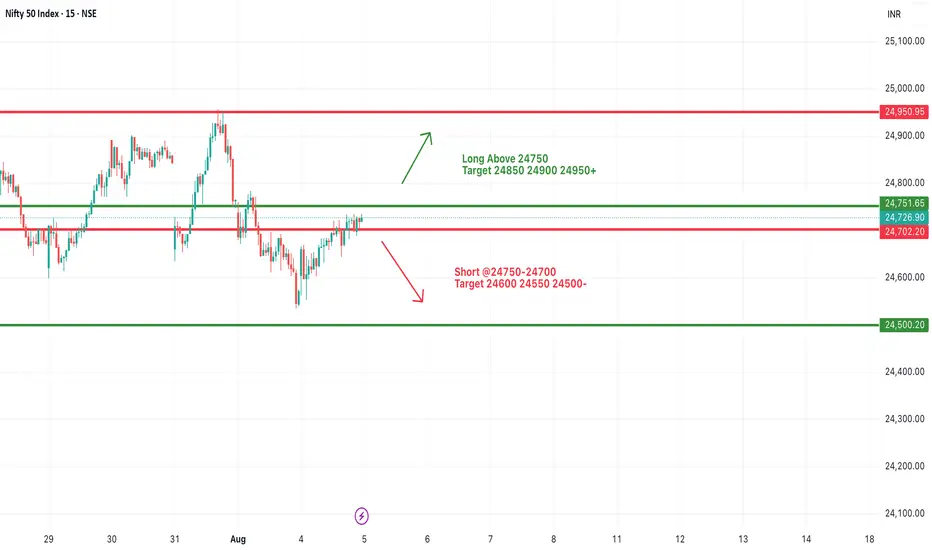
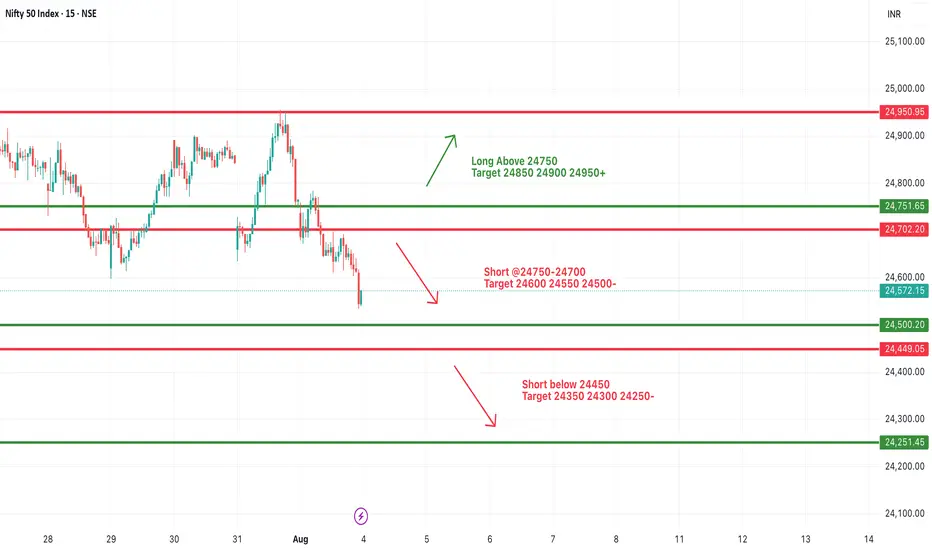
#NIFTY Intraday Support and Resistance Levels - 05/08/2025Nifty is expected to open flat near the 24,720–24,730 zone, showing signs of consolidation within a tight range. The price action remains stuck between the immediate resistance and support levels, and today’s move could be dictated by a breakout from this range.
On the upside, a breakout and sustained move above the 24,750 level may trigger a bullish rally toward 24,850, 24,900, and 24,950+ levels. This area has previously acted as resistance, and a clean breakout could lead to momentum-based buying.
On the downside, if Nifty fails to hold 24,700 and breaks below 24,750–24,700, a short opportunity may arise with potential targets at 24,600, 24,550, and 24,500- levels.
The range between 24,700–24,750 is the intraday decision zone. Traders should wait for confirmation and avoid premature entries. Use tight stop-losses and book partial profits near each level to manage risk effectively.
BTCUSDT – Bullish trend remains intactBitcoin is still trading within a long-term ascending channel. After a mild pullback to the FVG zone around 112,100 USDT, the price rebounded and is now consolidating above the ascending trendline support. If this level holds, BTC is likely to continue toward the upper channel target at 122,500 USDT.
Recent news supporting the uptrend:
Fidelity and BlackRock have continued accumulating Bitcoin-related ETF shares.
Weak US jobs data has fueled expectations of a Fed rate cut, drawing capital back into crypto.
Ethereum's upcoming hard fork upgrade is boosting overall market sentiment.
With both technical structure and fundamentals aligned, BTC remains bullish as long as it stays above 112,100.

EURUSD remains in a downtrendEUR/USD continues to move within a descending channel, with the 1.1600 area acting as strong resistance. Recent price action suggests the current rebound may be just a retest before the downtrend resumes. The next bearish target is around the 1.1390 support zone.
On the news front, although a strong U.S. PMI puts slight pressure on EUR, the USD faces mixed forces:
Weak NFP data increases expectations of a Fed rate cut.
The new US–EU trade deal imposing a 15% tariff has sharply weakened the euro.
Eurozone PMI improved but remains below 50, indicating a still-fragile recovery.

HEROMOTOCO Breakout Alert: Inverted Head & Shoulder PatternHero MotoCorp Ltd has formed a classic Inverted Head and Shoulders pattern on the daily timeframe, a strong indication of a potential bullish trend reversal. This pattern, combined with a breakout above the neckline and support from the 200 EMA, presents a high-probability long setup. This post details the trade plan, key levels, and conditions to validate or invalidate the move.
Chart Analysis Summary:
The stock closed at ₹4,535.90 with a powerful bullish candle, up by 5.20% for the day. This breakout move has occurred after months of consolidation and pattern development. The 200 EMA, which acted as dynamic resistance around ₹4,294, has now been breached with strong momentum, adding further bullish confidence.
The left shoulder of this pattern formed around November–December 2024, the head bottomed out near April 2025, and the right shoulder was developed during June–July 2025. The neckline, placed between ₹4,500 and ₹4,550, was the final resistance, which has now been broken decisively.
Trade Plan & Entry Strategy
If you’ve missed the breakout candle, don’t worry. The ideal approach now is to wait for a retest of the neckline zone, which lies around ₹4,500–₹4,550. If price comes down and finds support here, then traders should watch for bullish candlestick patterns on lower timeframes (like 1H or 4H) before entering. This ensures a high-probability entry with manageable risk.
For aggressive traders, early entries can be considered at current levels, but only with strict risk management and stop-loss placement below the neckline or the last swing low. If the retest holds and bullish momentum continues, this setup has the potential to deliver a clean rally.
Target Zones
The first target for this setup is ₹5,000, which acts as an important psychological and technical resistance. It’s a good point for partial profit booking or trailing stop adjustments. The final projected target based on the height of the pattern is ₹5,480. This level marks the completion of the measured move and can be used for full profit booking if the trend remains intact.
Risk & Invalidation Level
This setup will be considered invalid if the price drops and closes below ₹4,200, which is the base of the right shoulder. A breakdown below this support would indicate that the bullish structure has failed, and the stock may revisit lower zones.
Why This Setup is High-Quality
The Inverted Head & Shoulders is one of the most reliable reversal patterns in technical analysis. In this case, the breakout is supported by strong volume (not shown in the chart), a decisive close above the neckline, and a 200 EMA crossover, all of which provide strong technical confluence. The structure is clean, and the breakout level is clearly defined. Risk is limited and reward is substantial — a great setup for swing or positional trades.
Hero MotoCorp is showing early signs of a potential trend reversal after months of correction and consolidation. The breakout from the Inverted Head & Shoulders pattern offers a golden opportunity for traders looking for bullish setups. If the neckline retest confirms, this trade can offer a great reward-to-risk ratio targeting 5,000 and beyond. As always, patience and disciplined execution are key.

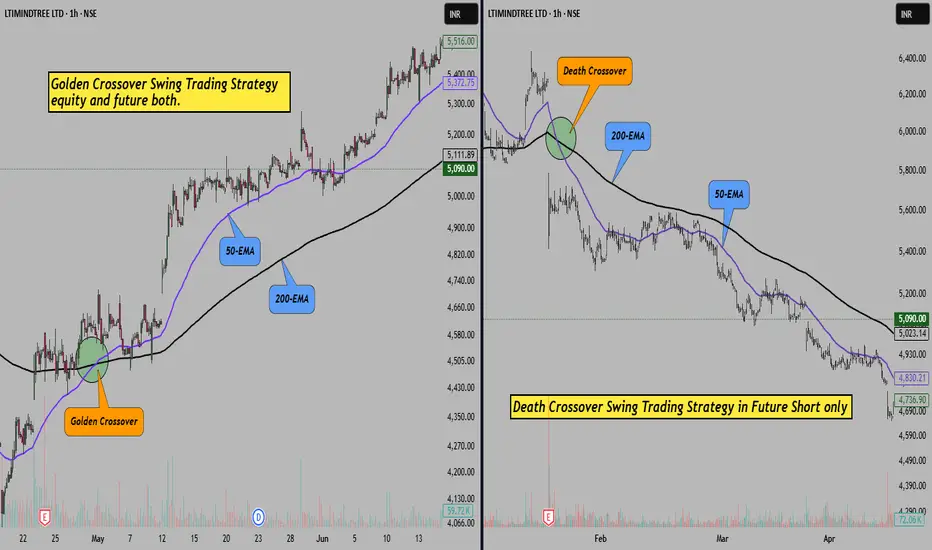
Golden EMA Setup – Catch Medium-Term Trends with 50 & 200 EMA!Hello Traders!
One of the simplest yet most powerful ways to identify long-lasting trends is by using moving averages. And among all combinations, there’s one that stands out for swing and positional trades, the Golden EMA Setup .
It uses just two tools: the 50 EMA and the 200 EMA. When used correctly, this setup helps you ride big trends and avoid choppy zones.
Let’s understand how this works and how you can apply it.
What is the Golden EMA Setup?
It’s a trend-following strategy based on the crossover of two EMAs:
50 EMA (Fast Average): Reacts quicker to price changes
200 EMA (Slow Average): Represents the long-term trend
When 50 EMA crosses above 200 EMA, it’s considered a Golden Crossover , a bullish signal.
When 50 EMA crosses below 200 EMA, it’s a Death Crossover , a bearish signal.
How to Trade This Setup:
Entry:
Buy when 50 EMA crosses above 200 EMA and price is above both.
Stop Loss:
Just below the 200 EMA or recent swing low.
Target:
Trail the stop loss and ride the trend till the crossover reverses or price weakens.
Timeframe:
Works best on daily or 1-hour chart for positional/swing trades.
Rahul Tip:
Golden EMA setup works great during trending phases, but avoid using it in sideways markets — you may get trapped in whipsaws. Always confirm with volume or RSI divergence before entering.
Did you ever used this strategy before, let me know in comment box.
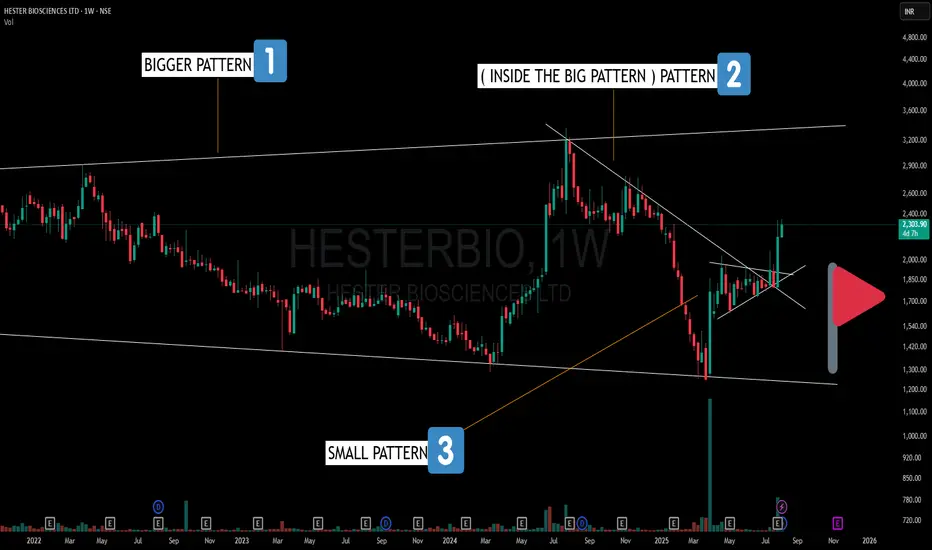
HESTERBIO – A Pattern Inside a Pattern Inside a Pattern!🔍 Here’s what stands out on the Weekly Chart:
1️⃣ Broadening Pattern – Larger structure with higher highs and lower lows, indicating expanding volatility.
2️⃣ Counter Trendline Break – A smaller, random pattern within the broadening formation showing V-shape recoveries and trend shifts.
3️⃣ Bullish Pennant – A compact consolidation pattern just before a strong breakout leg.
This is a great example of how multiple time-frame structures and nested patterns can co-exist—each adding another layer to market behavior.
#NIFTY Intraday Support and Resistance Levels - 04/08/2025Nifty is expected to open slightly gap up near the 24,550–24,600 zone. This area is currently acting as a resistance, and price action around it will be crucial to determine directional momentum for the session.
If Nifty sustains above 24,750, a bullish rally may unfold with potential upside targets at 24,850, 24,900, and 24,950+. A breakout above 24,751.65 would confirm strength and may trigger intraday buying interest.
On the downside, if Nifty faces rejection around 24,700 and breaks below the 24,700–24,750 zone, it can lead to a bearish move. A breakdown below this zone opens downside targets at 24,600, 24,550, and 24,500-. Further weakness below 24,450 may lead to an extended fall toward 24,350, 24,300, and 24,250-.
The broader trend remains weak unless Nifty reclaims strength above 24,750. Traders should stay cautious near reversal levels and maintain strict trailing stop-loss to protect profits and manage intraday volatility.
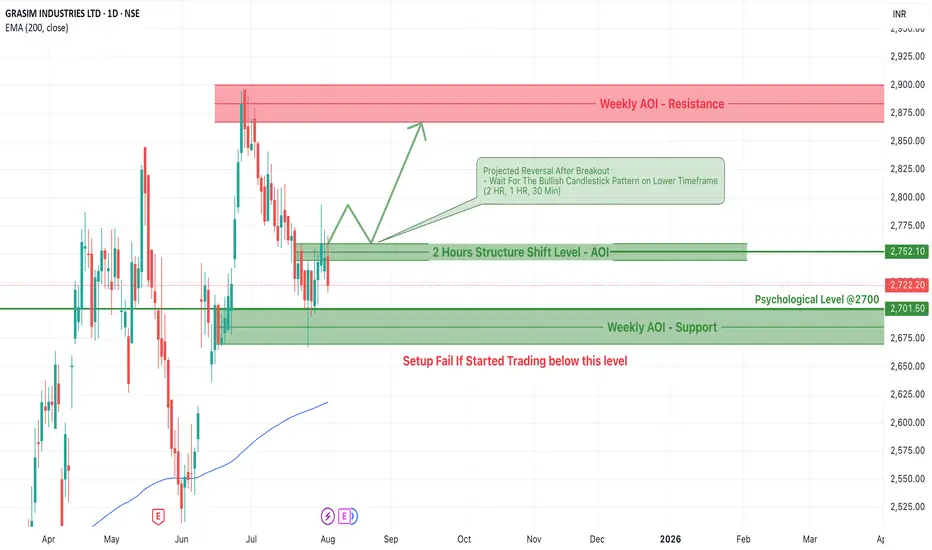
GRASIM Bullish Setup: Key AOI Levels and Reversal Trade PlanGRASIM Industries Ltd is currently forming a potential bullish reversal structure as it approaches a key structural AOI (Area of Interest) zone on the daily chart. This post outlines the complete trade setup, including price action analysis, important zones to monitor, trade plan, and conditions under which the setup could fail.
Key Observations
1. Weekly AOI – Support Zone
Range: Around ₹2,675 to ₹2,701
This green zone represents a strong weekly demand area, acting as a base for potential reversal.
Aligned with the psychological level of ₹2,700, this zone has historically acted as a strong pivot.
2. 2H Structure Shift AOI Zone
Level: ₹2,752.10
This level marks the intraday structure breakout zone on the 2-hour chart.
A successful breakout followed by a retest and bullish candlestick pattern may trigger confirmation for a long position.
Suggested lower timeframes for confirmation: 2HR, 1HR, and 30 Min.
3. Weekly AOI – Resistance Zone
Range: ₹2,875 to ₹2,925
The upside potential is capped at this resistance area, making it an ideal zone for partial or full profit booking.
Trade Plan Breakdown
Projected Move:
Price is currently hovering below the intraday structure shift.
If the price breaks above the ₹2,752 level, traders should wait for a pullback and confirmation in the form of a bullish candle on lower timeframes.
Post-confirmation, an upward move toward the weekly resistance zone is projected.
Entry Strategy
Trigger: Break and retest of the ₹2,752.10 level.
Confirmation: Bullish candlestick pattern (Pin Bar, Engulfing, or Morning Star) on 30 Min – 2HR timeframe.
Stop-Loss: Below the structure AOI or below ₹2,700.
Target 1: ₹2,875 (Near top of Weekly AOI – Resistance)
Target 2: ₹2,900+ (Aggressive target within resistance zone)
Setup Invalidation Level
If the price starts trading below ₹2,700, especially with strong bearish momentum, the setup fails.
In that case, price may revisit lower zones, and traders should refrain from taking long positions.
Technical Confluence
EMA 200 Support: Current price is significantly above the EMA 200 (₹2,618), indicating long-term bullish momentum.
Psychological Level ₹2700: Key psychological round number acting as a magnet and support.
Intraday structure shift: The break of lower timeframe structure adds strength to the setup
Risk Management Guidelines
Position Sizing: Do not risk more than 1-2% of capital per trade.
Wait for Confirmation: Avoid premature entries without bullish candlestick confirmation.
Trail Your Stop-Loss: After price moves into profit zone, trail SL to protect capital.
GRASIM Industries is showing signs of potential reversal and strength near the ₹2,700 zone. The structure shift on the 2-hour chart provides a bullish opportunity, but entry must be cautious and confirmation-based. With a solid risk-to-reward ratio, this could be a textbook breakout-retest trade if conditions align.
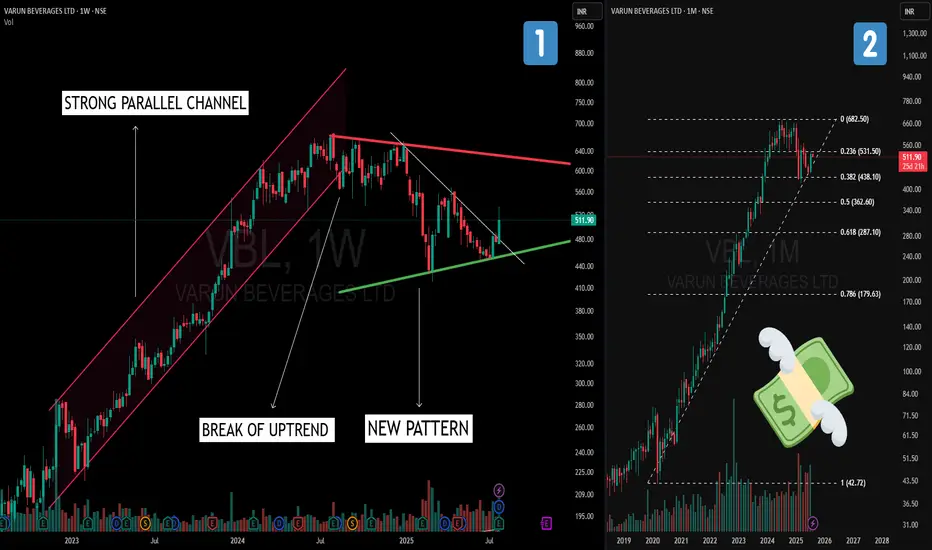
Varun Beverages: From Parallel Channel to Symmetrical TriangleOn the monthly timeframe (right chart), Varun Beverages shows a classic Fibonacci retracement pullback to the 38.2% level after an extended rally.
>Shifting to the weekly timeframe (left chart), we observe:
-Parallel Channel during the earlier uptrend phase, reflecting a strong trending structure.
-A break of the uptrend that transitioned into a sideways phase.
-Formation of a Symmetrical Triangle – characterized by a sequence of lower highs and higher lows, creating a contraction pattern.
This multi‑timeframe view highlights how trends evolve from strong rallies, to corrections, and into consolidation structures.
⚠️ Disclaimer:
This post is for educational purposes only and is not financial advice.
XAUUSD – Gold accelerates: Is the 3,600 target within reach?Gold has made an impressive rally of nearly 720 pips, surging from the recent bottom near 3,260 up to 3,365, following a deeply disappointing U.S. jobs report. Non-Farm Payrolls came in at just 106K, far below expectations, while the unemployment rate climbed to 4.2% — a clear sign that the U.S. economy is slowing down. In this context, the expectation that the Fed will pause rate hikes has become more solid, paving the way for gold to break higher.
Technical analysis on the D1 timeframe shows that XAUUSD remains in a well-established ascending channel that has persisted since late 2024. The recent bounce from the 3,260 support zone was strong, with yesterday's bullish candle confirming that buyers are regaining control.
As long as price holds above the 3,260 support area, the next target lies at the psychological resistance around 3,500, and beyond that — the ambitious 3,600 mark.

BTCUSDT – Bitcoin consolidates amid silent institutional buying Bitcoin is fluctuating between 114K and 116K USDT within a long-term ascending channel, supported by a wave of positive news. Weaker-than-expected U.S. labor data has fueled hopes that the Fed may pause its rate hikes — boosting sentiment for risk assets like BTC.
At the same time, major regulatory developments such as the SEC’s “Project Crypto” and the GENIUS Act by the CFTC are laying the groundwork for legalizing the crypto market. Notably, over 30,000 BTC were accumulated by MicroStrategy and institutional funds within just 48 hours — signaling strong capital inflows.
On the daily chart, BTC is forming an inverse cup-and-handle pattern, with 107,280 acting as key support. If the price holds and breaks above 120,872 USDT, a rally toward 130K may follow. However, if inflows weaken, a short-term pullback toward 112K could occur before the next upward move.

EURUSD – Euro tumbles under strong dollar pressureAfter a brief uptick following the US–EU trade agreement, EUR/USD quickly sank under a wave of strong US economic data. While import tariffs on EU goods were reduced to 15%, the US dollar gained more as capital kept flowing into the US thanks to a Q2 GDP growth above 3%, steady PCE, and a strong ADP report.
On the H4 chart, the bearish structure is clear: EUR/USD broke below key support and formed a series of unfilled FVGs, signaling sellers are still in control. The current pullback towards the 1.14300 resistance zone could act as a bull trap, with the next target eyed near 1.12300 — a likely liquidity zone.
If this area breaks, the 1.1200 mark may be triggered next. Meanwhile, USD strength shows no signs of fading — especially as the Fed maintains a cautious stance with no easing in sight. The euro is no longer seen as a safe haven, and investors are gradually pulling out.

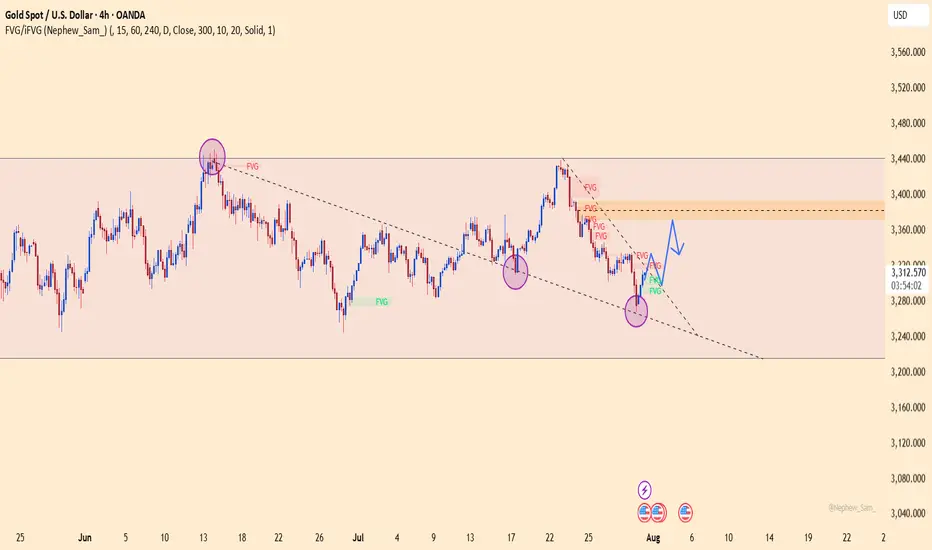
GOLD NFP Plan – Waiting for Breakout & Riding the Bullish Wave – GOLD NFP Plan – Waiting for Breakout & Riding the Bullish Wave
Gold is currently trading inside a large sideways triangle pattern, with price compressing toward the apex. However, based on recent candle structure and yesterday’s reaction at the key level, there’s strong momentum building for bullish continuation—likely forming a Wave 3 breakout if price can decisively break above the current descending trendline.
🔎 Technical Breakdown:
✅ BUY ZONE: 3276 – 3274 (confluence of CP ZONE + GAP + OBS BUY from yesterday)
📈 Price already reacted with +160 PIPS profit from this zone, confirming buyer control
⛓️ Descending trendline is compressing price – a breakout above it could unleash strong bullish momentum
🔄 SELL ZONE: 3339 – 3341 marked by OBS SELL ZONE + liquidity layer
📰 Fundamental Focus:
Today is Nonfarm Payrolls (NFP) day. With current forecasts pointing toward weaker-than-expected U.S. job data, the dollar could face pressure—creating the perfect scenario for gold to spike higher on BUY-side FOMO.
📌 Trade Plan:
🎯 BUY ZONE: 3276 – 3274
❌ Stop Loss: 3270
🎯 Take Profits:
3280 – 3284 – 3290 – 3294 – 3300 – 3305 – 3310 – 3320 – 3330 – 3340 – 3350
⚠️ SELL ZONE (counter-trend): 3339 – 3341
❌ Stop Loss: 3345
🎯 Take Profits:
3335 – 3330 – 3325 – 3320 – 3315 – 3310 – 3305 – 3300
📌 Key Notes:
Favor BUY setups in line with the trend—focus on reaction zones outlined on the chart.
If NFP data is bearish for the dollar, wait for strong confluences before entering any SELL, and avoid shorting prematurely against bullish momentum.
XAUUSD – Gold jumps as weak US job data boosts bullish sentimentGold prices reacted positively after the US Non-Farm Payrolls came in at only 106K and the unemployment rate rose to 4.2%, signaling a cooling labor market. This weak data has lowered expectations of further rate hikes from the Fed, offering strong support for gold.
On the H4 chart, XAUUSD has formed a bottom around the 3,247 area and is now rebounding within a descending channel. A slight trendline break and a W-pattern near the bottom further reinforce the potential for a continued upward move.
Technical view:
XAUUSD is approaching a key resistance zone around 3,313 – a crucial level that could trigger a breakout. If gold breaks above it with strong buying pressure, it may head toward the upper boundary of the channel.
The RSI is recovering from oversold levels, while EMA34 and EMA89 are starting to converge – suggesting a possible trend reversal ahead.

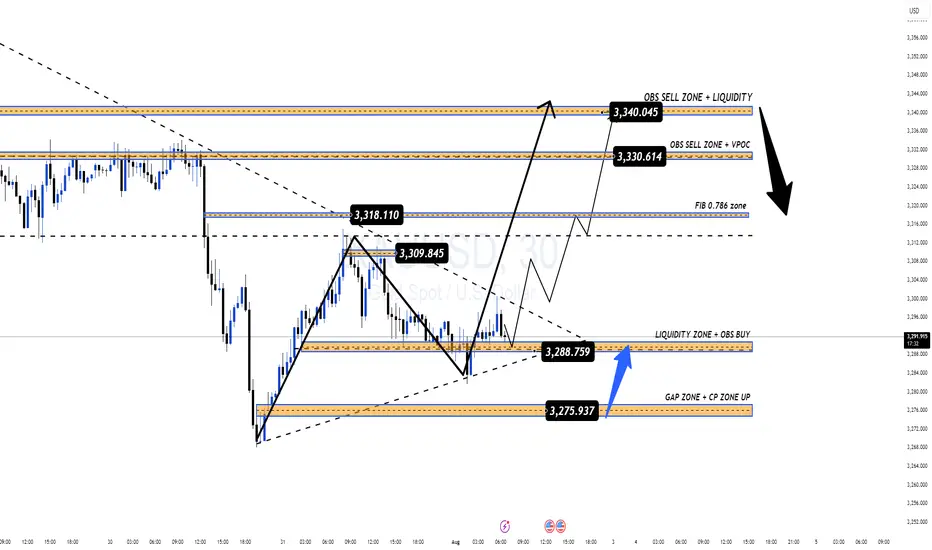
Liquidity Sweep Complete – Bullish Continuation Ahead?GOLD ANALYSIS 31/07: Liquidity Sweep Complete – Bullish Continuation Ahead?
🔍 Technical View | XAUUSD | 2H Chart | End of Month Setup
Gold has completed a final liquidity sweep around the 3269–3271 zone and has since rebounded strongly, in line with the prevailing bullish structure. The sharp drop yesterday during the FOMC rate statement appears to have served its purpose: grabbing final sell-side liquidity before preparing for the next bullish leg.
As of now, price is reacting at the 3295 zone, which coincides with the M30 CP (Change of Character) Zone, showing minor intraday retracement. A healthy pullback is likely before a potential bullish breakout of the descending trendline that has been holding price down over recent sessions.
🔵 BUY Strategy: Trend Continuation Setup
We’re watching for potential re-entries on a dip toward the OBS Buy Zone (3286–3284), created after the recent bullish move. This could be the last opportunity to catch the next impulsive leg higher.
Buy Zone: 3286–3284
Stop Loss: 3278
Targets: 3290 → 3294 → 3298 → 3304 → 3308 → 3312 → 3316 → 3320 → 3330 → ???
Key breakout confirmation will come if price closes strongly above 3313 (first key resistance). If broken, this opens the door toward the VPOC zone at 3328–3330, where a high-volume cluster awaits.
🔴 SELL Strategy: Short-Term Rejection Levels
Shorts only become favorable below the VPOC Sell Zone (3328–3330). If price closes above this area, bearish pressure is likely to fade, and bulls will dominate the next leg.
Sell Zone: 3328–3330
Stop Loss: 3335
Targets: 3324 → 3320 → 3315 → 3310 → 3305 → 3300
⚠️ Important: Selling inside a bullish breakout structure is high-risk unless the market gives clear rejection at major supply. Always wait for price action confirmation.
🕯️ Monthly Candle Insight (July Close)
Today marks the final trading day of July. Notably, the last two monthly candles have closed as Doji with long wicks, reflecting deep indecision and ongoing liquidity grabs. This aligns with the upcoming interest rate cut discussions at the next FOMC, which could ignite significant volatility.
📌 Summary:
Liquidity sweep at 3269–3271 is likely complete.
Price now retracing after strong bullish rebound from OBS Buy Zone.
Watch for confirmation above 3313, then 3328–3330 for breakout toward higher zones (335x–337x).
End-of-month close + macro narrative (FOMC) will be crucial to confirm direction.
💡 Pro Tip: Avoid entering late into reactive moves. Wait for retests of clean liquidity zones and use volume-based confluences to validate bias.
📲 Follow us @MMFlowTrading for real-time updates, macro analysis, and market structure insights on gold & major pairs.

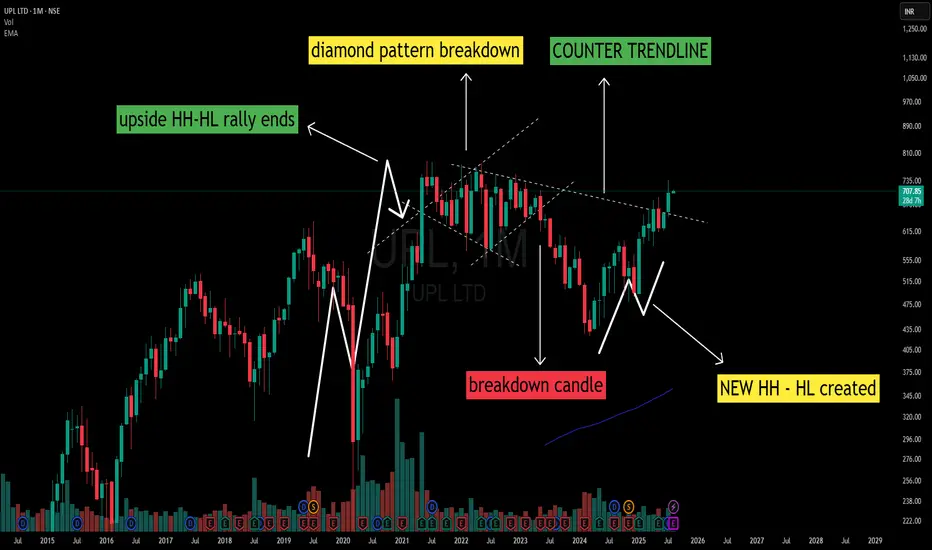
UPL – Diamond Pattern Breakdown to W-Bottom Reversal The monthly chart of UPL reflects a complete structural cycle:
1️⃣ Uptrend Phase:
A clear sequence of Higher Highs – Higher Lows (HH-HL) marked the early rally.
2️⃣ Diamond Pattern at Peak:
A diamond-shaped consolidation developed at the top of the rally, a common occurrence near trend maturity.
3️⃣ Breakdown & Downtrend:
A breakdown candle from the diamond pattern initiated a period of Lower Highs – Lower Lows (LH-LL), establishing a sustained downtrend.
4️⃣ W-Bottom Formation:
At the lower structure, a W-bottom emerged with Higher Low formation followed by a Higher High, indicating a structural shift.
5️⃣ Counter Trendline Interaction:
The earlier diamond pattern boundary has evolved into a counter trendline, now serving as an important structural reference zone.
📌 Observation:
The counter trendline remains a key structural reference on higher timeframes. This is a technical observation and not a directional view.
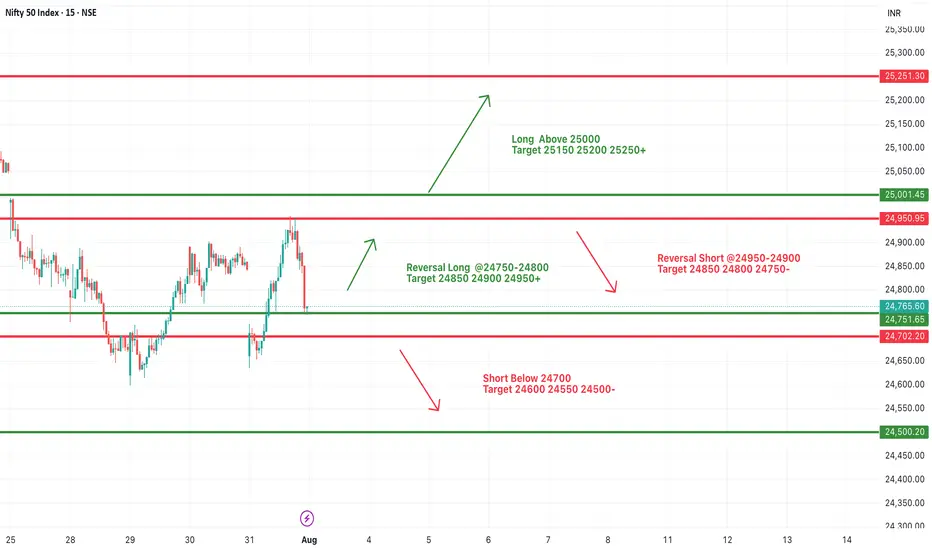
#NIFTY Intraday Support and Resistance Levels - 01/08/2025Nifty is likely to open flat near the 24,750 zone, suggesting a neutral start to the day. Traders should be prepared for a breakout or reversal setup based on how price behaves near key levels.
If Nifty holds the 24,750–24,800 zone and sustains, a reversal long opportunity is valid, with upside targets of 24,850, 24,900, and 24,950+. A breakout above the 25,000 psychological level would trigger a strong rally with higher targets of 25,150, 25,200, and 25,250+.
On the other hand, if Nifty faces resistance near 24,900–24,950, it could reverse sharply. A reversal short from this zone can target 24,850, 24,800, and 24,750. A further breakdown below 24,700 will open up shorting opportunities, targeting 24,600, 24,550, and 24,500.
Today’s flat opening presents a wait-and-watch situation. Price action near the key zones of 24,750–24,800 and 24,900–25,000 will determine directional momentum.
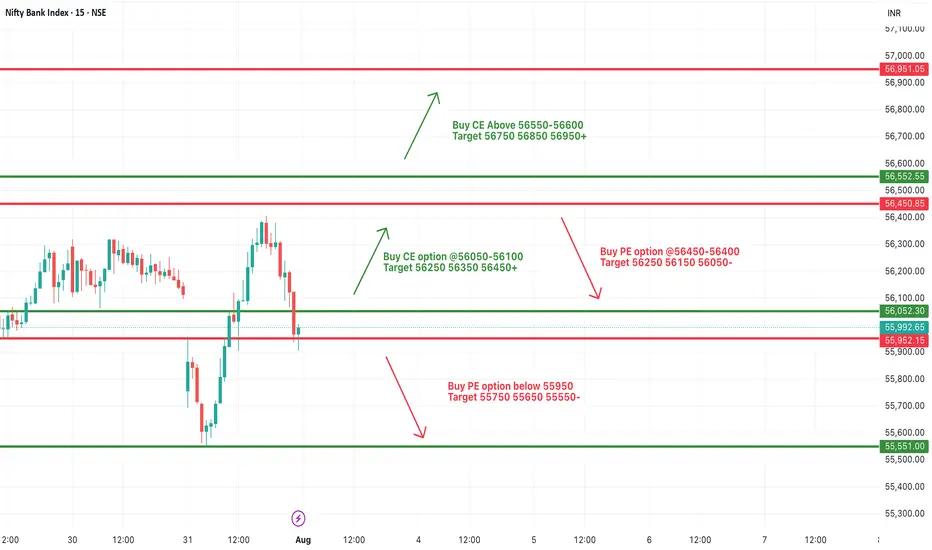
[INTRADAY] #BANKNIFTY PE & CE Levels(01/08/2025)Bank Nifty is expected to open on a flat note around the 56,000 level, indicating indecision at the start of the session. Traders should watch for key zones of breakout and breakdown as the price consolidates within a tight range.
If Bank Nifty sustains above the 56,050–56,100 level, a reversal CE buying opportunity could emerge, targeting 56,250, 56,350, and 56,450+. Further bullish momentum above the 56,550–56,600 zone could lead to a sharp rally toward 56,750, 56,850, and 56,950+ levels.
On the downside, if price fails to hold 56,000 and breaks below the 55,950 level, a PE option buying setup activates with downside targets of 55,750, 55,650, and 55,550. Strong selling pressure can accelerate if Bank Nifty trades below the 55,950 zone.
For bearish reversals from higher levels, a PE entry between 56,400–56,450 is also valid, with lower targets of 56,250, 56,150, and 56,050.
In summary, the market is likely to remain range-bound in the first half, with directional moves expected only on breakout above 56,600 or breakdown below 55,950. Use proper stop-loss and manage positions with a trailing SL and partial booking approach at each target level.
XAUUSD – Gold may plunge if key support failsHello traders! Gold continues to move within a clear descending channel and is currently retesting the previous support zone around 3,295.600. The RSI remains weak, and the EMA 34 stays below the EMA 89, confirming that the bearish trend is still dominant.
On the news front, U.S. labor costs have exceeded expectations, the Fed held rates steady, and there’s no sign of a dovish shift. This continues to strengthen the USD and puts pressure on gold. Investors are now awaiting Powell’s speech at tonight’s FOMC meeting—if his tone remains hawkish, gold is likely to face further downside.
Trading strategy:
If price retraces to the 3,350 – 3,371 zone and shows rejection or reversal signals, SELL remains the preferred option.