XAUUSD – Facing Strong Resistance, Pullback Risk IncreasesGold is approaching a major resistance zone that previously halted its upward momentum. Bullish momentum is fading, while the RSI shows signs of mild divergence. Market expectations around Federal Reserve policy, along with key data like CPI, unemployment rates, and geopolitical developments, are putting pressure on the precious metals market.
Without a strong catalyst from upcoming news, gold may enter a short-term pullback phase before establishing its next major trend.
Technical Analysis

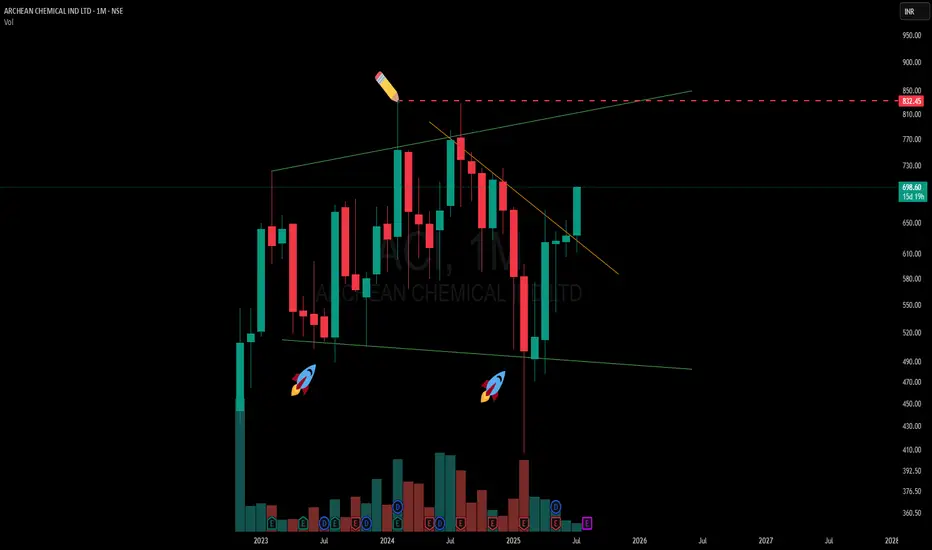
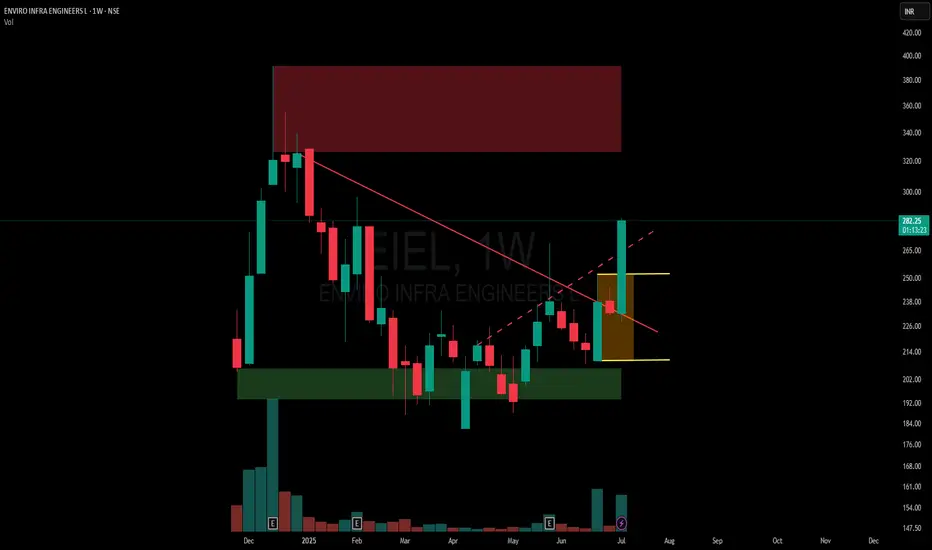
Archean Chemical – Broadening pattern and the CT ? 🟢A classic case of a broadening formation playing out on the higher timeframe (MTF). The green lines represent the broadening range, with price recently respecting the lower boundary — evident from the two support touches marked with 🚀 icons, each forming slightly lower lows before rebounding.
🟢 The current candle is testing a counter-trend (CT) descending trendline breakout, visible clearly after a prolonged series of lower highs. While the candle is still in progress and hasn’t closed, the structure is showing signs of compression toward the mid-zone of the broadening pattern.
📌 Upper and lower spaces remain open, highlighting the broad-range volatility typical of this setup.
No forecast — just structure. 📊
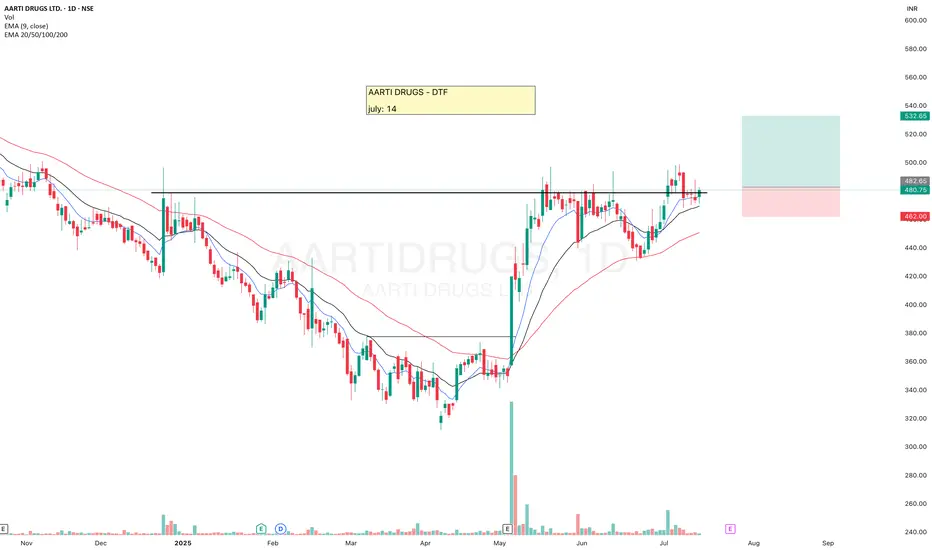
AARTIDRUGSAARTIDRUGS is crossing the resistance, moving above 9-20EMAs.
Now there is probability of an upside move, keep watching.
✅ If you like my analysis, please follow me as a token of appreciation :)
in.tradingview.com/u/SatpalS/
📌 For learning and educational purposes only, not a recommendation. Please consult your financial advisor before investing.
EURUSD SELL IDEA FOR DAY TRADINGHere We Could Sell On Trendling and Immediate resistance basis for EURUSD to gain 1:2 RR Ratio

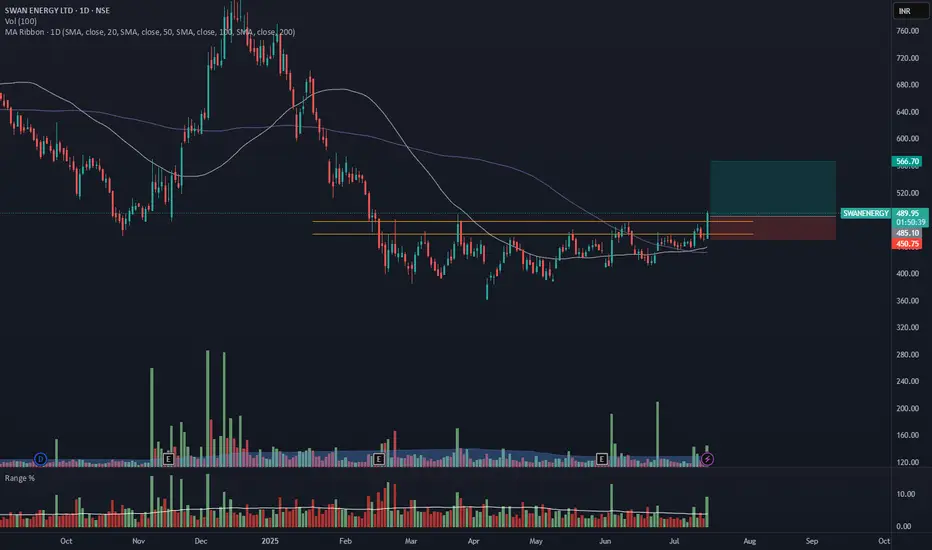
SWANENERGY - Daily Timeframe Breakout (Resistance Zone Break)SWAN ENERGY has shown a breakout above a key horizontal resistance level on the daily chart, accompanied by a nearly 2.5 times volume surge near the breakout zone, as seen earlier, supported by strong momentum.
🔍 Breakout Context:
- Price might break above the ~₹484 horizontal resistance, which had held for over 6 months.
The breakout zone has been supported by 2.5X volume and a range 3X of average near the resistance zone.
- The price is also trading above both the 50- and 100-day SMAs, indicating strong trend continuation.
- This aligns with a bullish continuation setup.
📉 Trade Plan:
- CMP: ₹485.2
- Entry: Near ₹484
- Target: ₹566 (~16.5% upside from CMP)
- Stop-Loss: ₹450
- Risk-Reward Ratio: ~ 1 : 2.3
📌 Note:
- Wait for the closing of this candle, enter the trade near 3:20 PM, or get confirmation on 75min/1Hr TF.
- Avoid chasing the extended move unless confident in intraday momentum.
⚠️ Disclaimer: This post is for educational purposes only and not financial advice. Always do your research or consult a financial advisor before trading.
XAUUSD – Gold Sideways, Awaiting Key Economic DataXAUUSD – Gold Sideways, Awaiting Key Economic Data: Will We See a Correction or Continued Uptrend?
🌍 Macro Overview – Waiting for Key CPI Data from the US
Currently, Gold is moving sideways in a wide price range (from the 3x price levels to 4x), awaiting important economic data this week from USD, GBP, AUD, and EUR.
📊 Key Economic Data Today:
The US CPI report will be released during the US session, one of the most crucial reports of the month.
CPI forecast is positive at 0.3%, which is considered a good sign for the US economy.
This data is expected to align with the recent Nonfarm results and could lead to a strong price movement at the time of the announcement, potentially helping to sweep liquidity.
🔍 Technical Analysis – Uptrend with Key Resistance
The current trend is still upward, but the movement on larger timeframes is not as strong.
Key resistance lies between 337x and 339x, where SELL orders are currently dominant.
If price breaks through these levels, Gold may find support to move towards 3400.
📈 Short-Term Forecast:
A pullback to around 333x is expected, providing a good BUY opportunity.
Looking further, 331x could be a possible target as the price range remains wide.
🎯 Trading Strategy for Today
🟢 BUY ZONE: 3331 – 3329
SL: 3325
TP: 3335 → 3340 → 3345 → 3350 → 3360 → 3370 → ????
🔴 SELL ZONE: 3392 – 3394
SL: 3398
TP: 3388 → 3384 → 3380 → 3376 → 3370
⚠️ Important Notes:
Watch for support and resistance levels to set up suitable Scalping trades according to the trend.
Follow the TP and SL to protect your account, and avoid FOMO when there's no confirmation.
The 3350 – 3347 range is a key zone for entering BUY trades early.
💬 What do you think about Gold’s movement today? Do you believe it will break above the resistance, or will we see further correction? Drop your thoughts in the comments below and join the discussion with fellow traders!
👉 If you’re looking for more daily updates and live discussions, don’t forget to follow and be part of our community! Let’s make the most of these market opportunities together.

NATCOPHARMANATCOPHARMA gave BO of long time resistance, looking in a good position.
Now there is probability of an upside move.
✅ If you like my analysis, please follow me as a token of appreciation :)
in.tradingview.com/u/SatpalS/
📌 For learning and educational purposes only, not a recommendation. Please consult your financial advisor before investing.

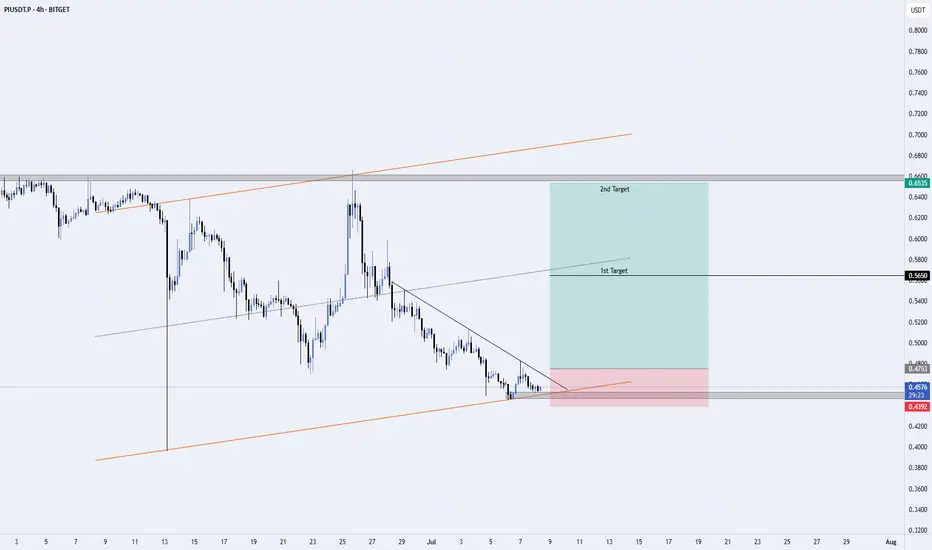
PIUSDT – Potential Long Setup from Ascending Channel Support (4HI’m watching PIUSDT closely as it approaches a significant confluence of technical levels on the 4-hour chart:
🔹 Key Highlights:
Ascending Channel Support: Price is testing the lower boundary of the channel (orange trendline).
Descending Trendline Resistance: Creating a wedge structure—breakout potential if momentum builds.
Bullish Structure: Clear rejection wicks and consolidation near support suggest accumulation.
✅ Trade Plan:
Entry Trigger: Confirmed breakout and close above the descending trendline.
Targets:
🥇 1st Target: 0.5650 (local resistance)
🥈 2nd Target: 0.6550 (major horizontal resistance)
Stop Loss: Below 0.4392 (breakdown invalidates the setup)
⚠️ Risk Management:
Always use proper position sizing and a disciplined stop loss. This setup is shared for educational purposes—do your own research before entering any trades.
Exhaustion vs Runaway Gap |How to Catch Trend and Spot ReversalsGaps often confuse traders — some lead to powerful trends, others signal trend exhaustion. In this video, I break down the key psychological and technical differences between Runaway Gaps and Exhaustion Gaps, with real examples and clean explanations.

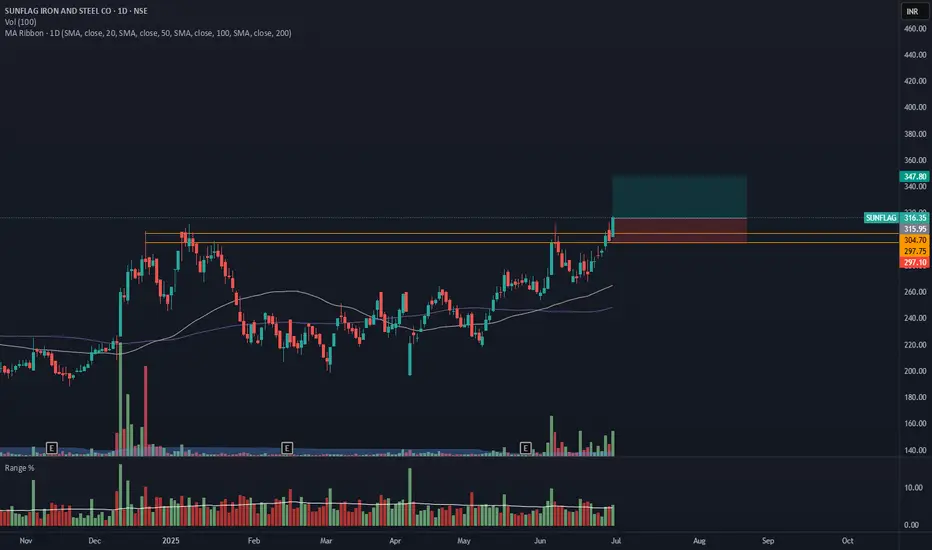
SUNFLAG- Breakout from DTFSUNFLAG has resistance weakening on the Daily charts and has given a breakout with good volume.
The target of this pattern signals an upside potential of 10% from the current price level in the medium term.
The stock is trading above its 50- and 100-day simple moving averages (SMAs). The range is more than 1.2X, and the Volume is also >6X the average.
CMP- Rs. 316
Target Price- Rs347 ( 10% upside)
SL - 297
Disclaimer: This is not a buy/sell recommendation. For educational purpose only. Kindly consult your financial advisor before entering a trade.
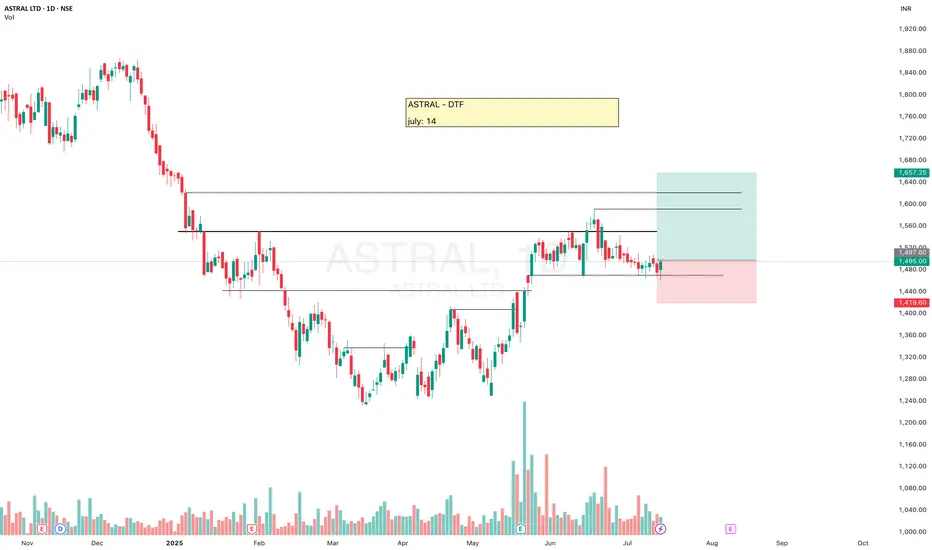
ASTRALASTRAL looks good, has been taking support near 1470 level - above 50ema, and today formed a Hammer candle. Now there is probability of it going up.
✅ If you like my analysis, please follow me as a token of appreciation :)
in.tradingview.com/u/SatpalS/
📌 For learning and educational purposes only, not a recommendation. Please consult your financial advisor before investing.
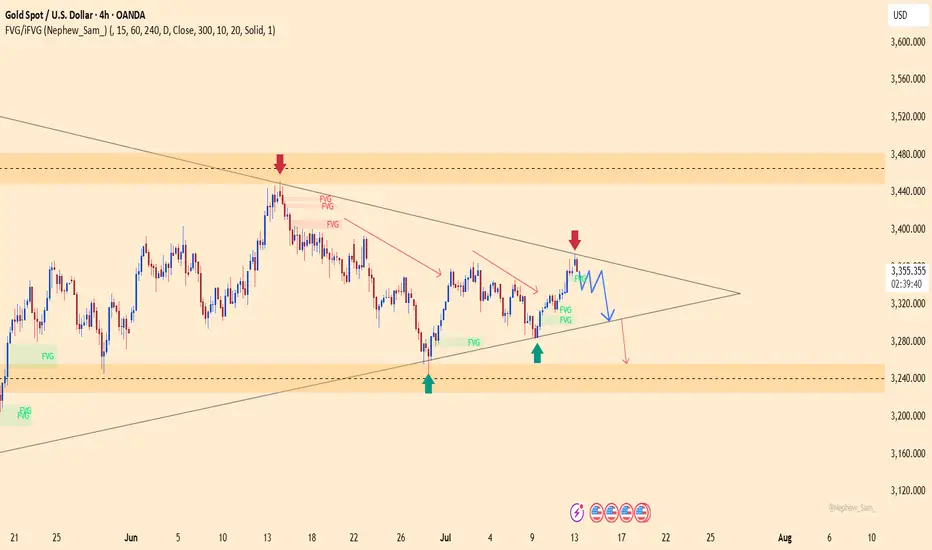
XAUUSD at risk of dropping – is gold going to fall further?XAUUSD is currently trading around 3,355, close to the resistance at 3,375. After a strong rally, gold is facing difficulty at this level and is likely to experience a correction. A symmetrical triangle pattern is forming, and if gold fails to break through the resistance, the price could drop to 3,301 or 3,255.
In terms of news, the USD and U.S. bond yields are holding steady, with stable U.S. employment data and no clear signals from the Fed on interest rate cuts. Additionally, the World Gold Council warns of a potential correction in gold if global political tensions ease or if USD and bond yields continue to rise.
Sellers are starting to take control, and if the support at 3,320 is broken, gold could fall further. Keep a close eye on the market!
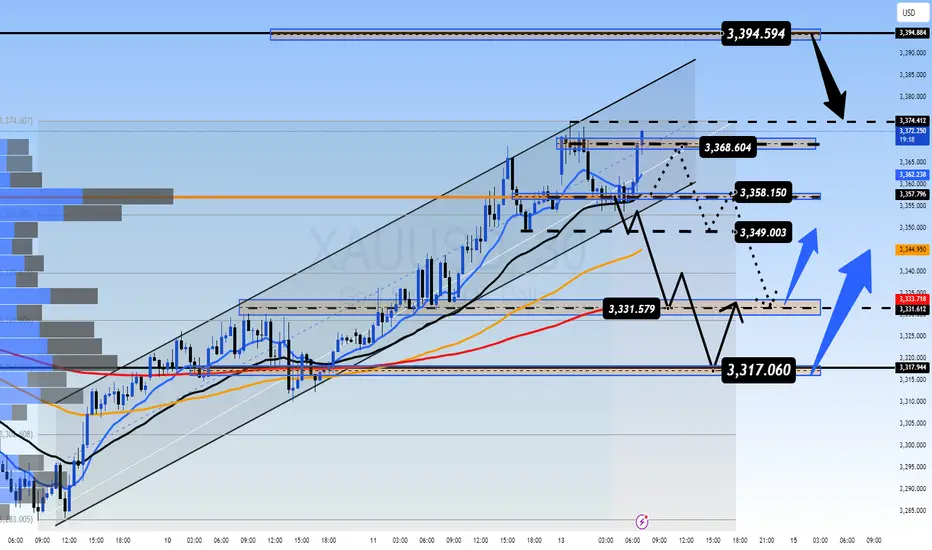
Early Week Correction Ahead of Heavy News Flow GOLD PLAN – July 14 | Early Week Correction Ahead of Heavy News Flow
📰 Macro Context – Volatile Week Expected
Gold opened this week with a sharp correction, retracing after sweeping liquidity from the previous 2-week FVG zone. This early reaction reflects investor caution ahead of key tariff-related announcements due later this week.
In addition to geopolitical factors, the market is also bracing for major US economic data, including:
📊 CPI (Consumer Price Index)
📊 PPI (Producer Price Index)
📊 Unemployment Claims
📊 Retail Sales Figures
These events combined make this a high-volatility week with potentially strong directional moves in the second half.
📉 Technical Outlook – M30 Timeframe
Price has taken out minor liquidity above recent highs
Currently retracing over $15 from the top
Price is now trading below the intraday VPOC (around 3358) — suggesting potential bearish momentum
If momentum continues, gold may dip into key demand zones:
🎯 333x
🎯 Possibly lower into 332x
This could provide a healthy retracement before resuming the broader uptrend.
🧭 Trading Strategy
✅ BUY ZONE: 3331 – 3329
Stop-Loss: 3325
Take-Profits:
TP1: 3335
TP2: 3340
TP3: 3344
TP4: 3350
TP5: 3360 – 3370+
🔍 This zone aligns with prior support, potential liquidity traps, and EMAs on higher timeframes — high-probability area for bounce trades if volume confirms.
⚠️ SELL ZONE: 3393 – 3395
Stop-Loss: 3399
Take-Profits:
TP1: 3390
TP2: 3386
TP3: 3382
TP4: 3378
TP5: 3374 – 3370 – 3360
📉 Great for short-term scalps if price re-tests the zone and shows rejection signs, especially around key news events.
📊 Key Levels to Watch
🔺 Resistance Zones
3358
3368
3374
3394
🔻 Support Zones
3349
3340
3331
3318
⚠️ Execution Notes & Sentiment
🕰️ At the time of writing, gold is consolidating near the M30 VPOC with no clear break in either direction.
🧘 Stay patient and wait for clear confirmation from European session volume
🚫 Avoid FOMO trades — stick to structure
✅ Respect all SL/TP levels to protect your capital
This week’s volatility will reward discipline, not speed.
📌 Summary
Gold is currently in a short-term pullback after reaching previous liquidity zones.
There’s potential for a deeper dip early this week before macro news pushes price decisively.
📌 3331–3329 remains the primary BUY zone to watch if price shows bullish confirmation.
📌 3393–3395 remains the key SELL zone for potential short-term rejections.
🔍 What’s your view this week? Are you looking to buy the dip or short the bounce?
💬 Drop your thoughts in the comments — let’s discuss setups!
✅ If this helped you, hit that like & follow for more daily plans.
📩 Want private signals & deeper trade setups? DM to join our premium group.
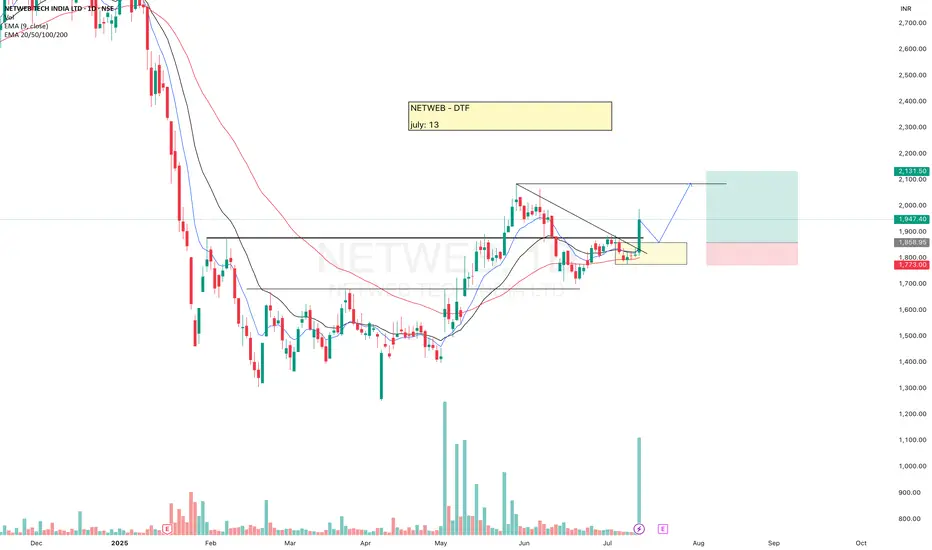
NETWEBNETWEB looks good, it already gave BO then re-tested it, now seems to be getting ready for another move.
Volume + Strong green candle, now need some retracement for entry.
Keep eyes on this.
✅ If you like my analysis, please follow me as a token of appreciation :)
in.tradingview.com/u/SatpalS/
📌 For learning and educational purposes only, not a recommendation. Please consult your financial advisor before investing.
Breakout vs Fakeout: Master this logic to become a better TraderBreakouts can be deceiving. In this video, I dive deep into the psychology and structure behind breakouts vs fakeouts, how to spot the traps, and how to trade them with precision.

EURUSD: are the bulls taking control?EURUSD is currently trading around 1.1691 and maintaining a bullish structure with consistently higher lows. On the H4 chart, a symmetrical triangle is forming, and price may break out toward the 1.1823 target if it can overcome the resistance trendline.
On the news front, the US dollar has weakened as the Fed has yet to provide a clear signal on rate cuts. Meanwhile, Eurozone economic sentiment is improving, supported by a slight uptick in manufacturing and services data. This reinforces the euro's recovery and keeps upward pressure on EURUSD.
If the 1.1660 support zone holds firm, the upcoming breakout could trigger a strong bullish move. Buyers are waiting for confirmation — are you in the game?

Supply Zone Trading Explained from Scratch | Master it todayA complete beginner-to-pro guide on supply zones — learn why they matter, how to draw them, and how traders can use them for smart decisions.

XAUUSD Analysis – Bearish Pressure ReturnsGold is facing renewed bearish pressure, as the H4 chart shows a failed attempt to break above the resistance FVG zone around $3,339. The overall structure remains bearish, with a likely move toward the $3,264 support zone in the coming sessions.
On the news front, recent U.S. CPI data came in stronger than expected, supporting the USD. Additionally, hawkish comments from Fed officials like Musalem, along with FOMC minutes showing no rush to cut rates, have stalled gold’s upward momentum. Meanwhile, the 10-year Treasury yield remains elevated, reducing the appeal of non-yielding assets like gold.
If XAUUSD fails to hold above the $3,300 zone, a move down toward $3,265 is highly probable in the short term.

SUPREME INDUSTRIESSUPREME INDUSTRIES seems to be ready.
Making HH-HL formation, breakout from here may give a good upside move.
✅ If you like my analysis, please follow me as a token of appreciation :)
in.tradingview.com/u/SatpalS/
📌 For learning and educational purposes only, not a recommendation. Please consult your financial advisor before investing.

Inside Bar Ignites a Clean Breakout🟢 Simple Breakout Structure | Supply-Demand Flip
✅ Strong demand zone formed after multiple rejections
🔻 Previous supply zone clearly respected
📉 One active counter-trendline broken
🔍 Breakout of mother candle with an inside bar setup
📈 Volume expansion on breakout
🟠 Also broke a hidden resistance line, adding confluence
🧭 Chart structure remains smooth and clear, respecting zones well
No predictions. Just structure.
EURUSD – Failed Breakout, Bearish Momentum Takes OverEURUSD attempted to break out of the upper edge of a consolidation triangle but was swiftly rejected around the 1.17450 region, forming a classic “failed breakout” — a pattern that often precedes strong reversals. The pair is now pulling back and appears to be heading toward the 1.16800 support zone.
On the news front, the market is under pressure from rising expectations that the Federal Reserve will maintain higher interest rates for longer, following stronger-than-expected U.S. job data. This has driven a notable recovery in the U.S. dollar, putting downward pressure on the euro. In this context, EURUSD risks a deeper correction if the 1.1700 support fails to hold. Keep a close eye on price action — this pullback could be the start of a new bearish leg.

USDJPY – Is the Downtrend Taking Shape?On the H4 chart, USDJPY shows signs of weakening as it repeatedly fails to break above the long-term descending trendline. Despite a recent recovery toward the 147.000 level, buying momentum appears to be fading. The price structure suggests the possibility of a false breakout before a reversal toward the 144.300 support zone—an area with multiple unfilled FVGs.
From a news perspective, traders are awaiting today’s upcoming U.S. CPI report. If inflation data comes in hotter than expected, the USD may gain short-term strength. However, a weaker CPI reading could trigger a quick reversal in USDJPY, confirming the bearish setup. The 147.000 level remains the critical zone to watch for any potential rejection or breakout.

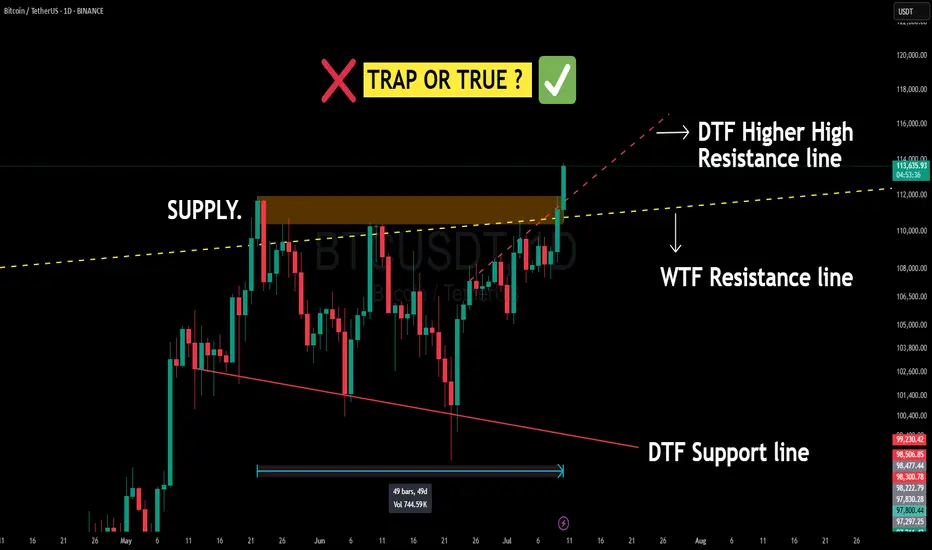
BITCOIN Just Smashed a 50-Day Supply Wall — Breakout or Fakeout Bitcoin (BTC/USDT) on the Daily & Weekly Timeframe just pulled off something BIG:
✅ Broke out of a 50-day consolidation range
✅ Closed above a strong Daily supply zone
✅ Cracked both DTF & WTF resistance lines (including a higher-high dynamic DTF resistance)
✅ Volume confirmation with a strong green candle
📌 This is an extremely bullish structure for short-term scalping ideas.
But Wait — What’s Happening Technically?
Supply Zone: This orange box is where BTC got sold off multiple times before. Breaking above this = strong bullish intent.
⚠️ Caution: Bitcoin is the King of Fakeouts 👑🐍
BTC has a notorious nature for false breakouts, trapping both bulls and bears. That’s why:
🧠 Best Strategy = Trap Trading OR
⏳ Wait for a pullback and retest of broken zones on higher timeframes . Plan your trade - trade your plan .
Don't chase — let price come to you.
💬 Drop your thoughts / doubts in comments.
📌 Not financial advice — just me and my Emotions