MAZDOCK – TECHNICAL ANALYSIS - W PATTERN________________________________________________________________________________
📈 MAZDOCK – TECHNICAL ANALYSIS
📆 Date: July 4, 2025 | ⏱ Timeframe: Daily Chart
🔍 Educational Breakdown – For Learning & Study Use Only
________________________________________________________________________________
🔹 Price Action Zones
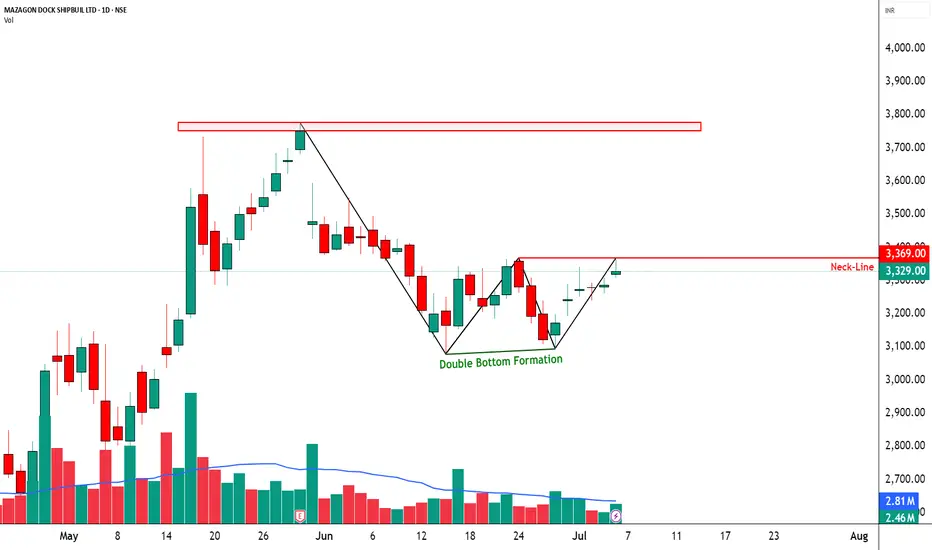
• 🔴 Top Range: 3775
• Resistance: 3362 – 3396 – 3423
• 🟢 Bottom Range: 3077.7
• Support: 3241 – 3274 – 3301
________________________________________________________________________________
🔹 Chart Pattern: ✅ W-Bottom Formation
A clean W-shaped reversal pattern is forming. Price is respecting demand zones and gradually forming higher lows. Neckline lies around 3369 — breakout above this may fuel further upside.
________________________________________________________________________________
🔹 Reversal Candlestick Patterns:
⛔ No major reversal candle on 4th July 2025.
________________________________________________________________________________
🔹 Volume Footprint:
✅ Gradual volume pickup
🚨 Watch for breakout above 3362–3396 with volume >3.5M
🔼 A successful breakout may trigger a swift move toward 3425–3520.
________________________________________________________________________________
🔹 Trend Bias: ✅ Bullish
Short-term momentum favors the bulls with sectoral tailwinds from PSU + Defense themes.
________________________________________________________________________________
📌 What’s Catching Our Eye:
• W-Bottom Pattern nearing breakout
• Price reclaimed key demand zone and consolidating just below resistance
• PSU + Defense theme rally adds sector momentum
________________________________________________________________________________
👀 What We’re Watching For:
• Breakout Confirmation: Daily close above 3396 with 3.5M+ volume
• Pullback Re-entry: Ideal zone 3300–3310 for fresh entries
• Volume Spike: Key trigger for breakout validation
________________________________________________________________________________
⚠️ Risks to Watch:
• Low volume breakout = Bull trap risk
• Sector rotation or sudden weakness in PSU/Defense
• Breakdown below 3240 = pattern failure & shift in bias
________________________________________________________________________________
🔮 What to Expect Next:
• ⚡ Retest of 3362–3396 range likely
• 🔄 Minor consolidation / handle formation possible
• 🔄 Watch for volatility near resistance (intraday fakeouts)
________________________________________________________________________________
📊 Trade Plan (Based on Logic + Volume Confirmation)
🔼 Breakout Long Setup:
• Entry: Above 3369
• Stop Loss: 3300
• Risk–Reward: ~1:1 to 1:2
📌 Why:
• W-bottom breakout
• Sector strength + price structure alignment
• Volume >3.5M is the key trigger
________________________________________________________________________________
🔁 Pullback Long Setup:
• Entry Zone: 3305–3310
• Stop Loss: 3240 (Support 3)
• Risk–Reward: ~1:1 to 1:2
📌 Why:
• Tight SL near structure
• Good risk-reward for early entry
________________________________________________________________________________
🔽 Bearish Setup (Rejection from Resistance):
• Entry: Below 3300
• Stop Loss: Above 3365
• Risk–Reward: ~Flexible — as per individual trader's strategy and risk appetite
📌 Why:
• Rejection from neckline
• Low-volume breakout = trap
• Breakdown below support shifts structure to bearish
________________________________________________________________________________
❌ Invalidation Triggers:
• Daily Close below 3240
• Bearish Marubozu with volume = shift to supply pressure
________________________________________________________________________________
📌 Intraday Supply Zones Noted (15-Min Chart):
The 15-minute chart reveals the presence of multiple intraday supply zones, indicating short-term selling pressure.
🟥 Tested Supply Zone: 3337.30 – 3346.30 | SL: 3352.20
🟥 Strong Supply Zone: 3349.40 – 3358.60 | SL: 3364.50
These zones may act as resistance levels for intraday traders. Watch for price rejection or confirmation candles in these areas before planning any breakout trades.
________________________________________________________________________________
⚠️ Disclaimer:
This analysis is for educational purposes only.
STWP is not a SEBI-registered advisor.
No buy/sell recommendations are made.
Please consult your financial advisor before trading.
STWP is not responsible for trading decisions based on this post.
________________________________________________________________________________
💬 Found this helpful?
Have you caught this W-pattern early?
Share your thoughts in the comments ⬇️
🔁 Spread the insight with fellow traders
✅ Follow STWP for smart technical setups backed by volume and price action
🚀 Let’s trade with patience, logic, and clarity!
Be Self-Reliant | Trade with Patience | Learn with Logic
________________________________________________________________________________
Technical Analysis
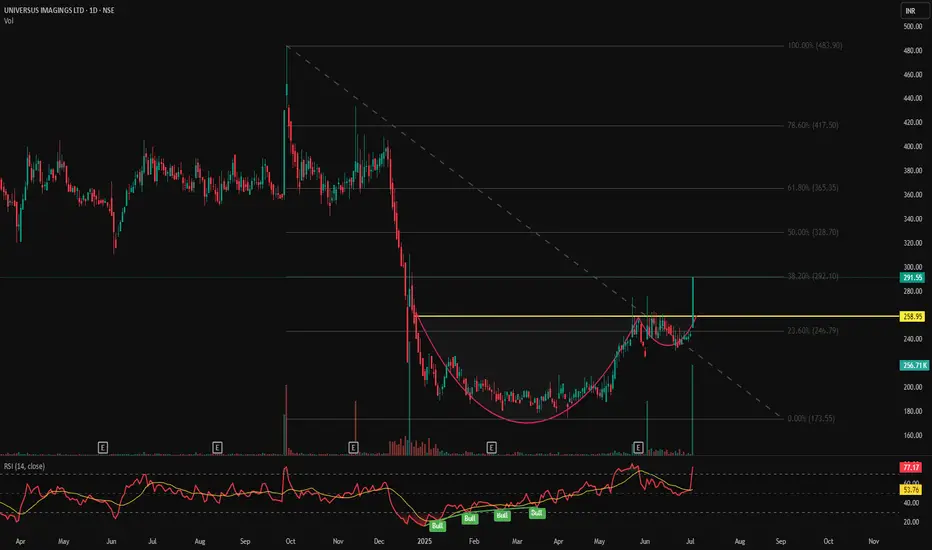
UNIVPHOTO - Cup & Handle Breakout | Daily Chart📊 UNIVPHOTO – Cup & Handle Breakout | Strong Volume | RSI Overbought | Fibonacci Confluence | Daily Chart
📅 Chart Date: July 3, 2025
📍 CMP: ₹291.55 (+20.00%)
📈 Symbol: NSE:UNIVPHOTO
🔍 Technical Analysis Summary
✅ Cup & Handle Breakout
Price has broken out above the neckline of the Cup & Handle pattern at ₹258.95 with strong bullish momentum.
Post-consolidation breakout visible with a solid bullish candle.
📊 Fibonacci Retracement Levels (Swing: ₹173.55 to ₹483.90)
23.60% – ₹246.79
38.20% – ₹292.10 ✅ (Price nearing this level – short-term resistance)
50.00% – ₹328.70
61.80% – ₹365.35
78.60% – ₹417.50
100% – ₹483.90 🎯
📈 RSI Indicator (14)
RSI has surged to 77.17, indicating strong momentum but entering overbought territory.
RSI breakout with multiple prior bullish divergences validated the upside move.
📉 Volume
Current breakout supported by above-average volume (256.71K) adds credibility to the move.
🏁 Key Technical Levels
Neckline Breakout: ₹258.95 ✅
Immediate Resistance: ₹292.10 (Fib 38.2%)
Next Targets: ₹328.70 → ₹365.35
Support Levels: ₹258.95 → ₹246.79
Major Swing Low: ₹173.55
💡 Trade Setup
Entry: On breakout confirmation above ₹259
SL: Below ₹246
Short-term Target: ₹292
Mid-term Target: ₹328 → ₹365
Risk Level: Medium (due to RSI overbought – may see retracement)
⚠️ Disclaimer
This chart is for educational and analytical purposes only. Please consult your financial advisor before making investment decisions.
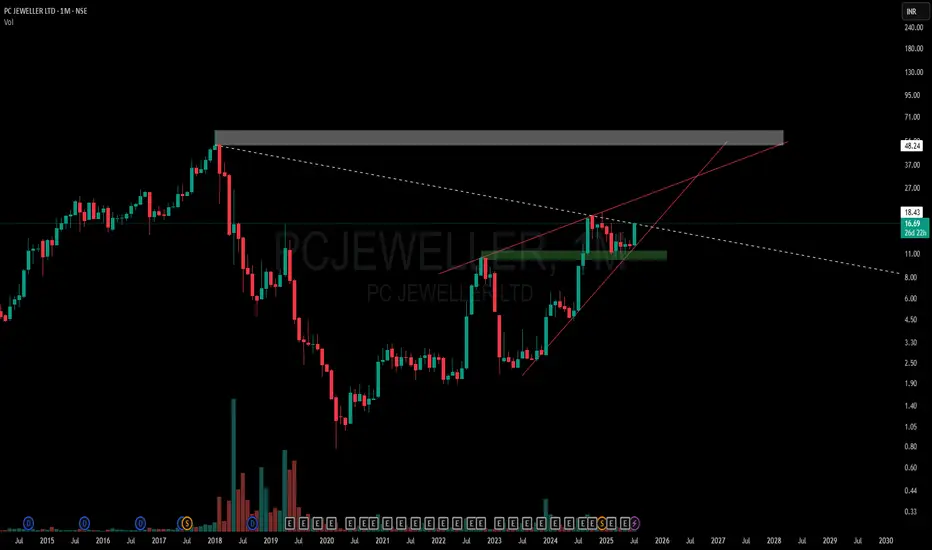
PC Jeweller at a Make-or-Break Zone: Structure Never Lies🔸 A long-standing Multi-Timeframe Compression Trendline (white dotted) remains active, and price is currently retesting this zone.
🔸 The grey supply zone marks the all-time high resistance, while the green box shows a recent zone that flipped from supply to demand — supported by a strong base formation.
🔸 A hidden structural pattern is emerging —
• One line forming a (HL - Hidden Line ) acts as rising resistance
• The other trendline offers solid ascending support
🔸 Price is getting tighter within this converging structure, while respecting historic levels.
📌 No forecast here — just highlighting key levels and behavior for context-driven traders.
XAUUSD: Bullish Momentum Continues to BuildGold is currently trading within an ascending triangle pattern on the H1 chart, with support around the 3,322 zone and resistance near 3,359 USD. Recent price action shows strong bounces from the support line, along with a series of bullish Fair Value Gaps — indicating clear buying strength.
Fundamental factors supporting the upside:
– Weak U.S. job data lowers expectations for prolonged high interest rates from the Fed.
– The U.S. dollar is weakening due to inflation pressure and fiscal uncertainty.
– Rising geopolitical tensions and increased U.S. spending are boosting safe-haven demand for gold.
Strategy: Look for buy opportunities on a retest of the 3,322–3,326 zone. Target the 3,359 USD level, with potential for further upside if the triangle breaks to the top. Watch out for invalidation if price falls below support.

USDJPY: Weak Rebound, High Downside RiskUSDJPY remains under bearish pressure as price continues to be rejected at the descending trendline resistance. The 145.000–145.100 zone acts as a strong resistance area where price has repeatedly reversed.
The recent upward move appears to be a weak pullback, lacking the momentum to break the previous bearish structure. If price continues to be rejected at this zone, a likely correction towards the 142.100 support area is expected.

XAUUSD: Poised for a Breakout to Higher LevelsThe H1 chart shows gold moving sideways within a symmetrical triangle, with higher lows and narrowing range — a classic sign of consolidation before a potential breakout.
The lower boundary of the triangle is acting as dynamic support around the 3,334–3,336 zone. Buyers appear to be in control, pushing price up from previous Fair Value Gap zones. If price holds above 3,334 and breaks through the upper triangle resistance, the next short-term target is around 3,371.
Strategy: Favor a mild upside breakout scenario. Consider long entries if price breaks above 3,350 with volume confirmation, targeting 3,371 for take-profit.

EURUSD: Sideways Consolidation Before Directional BreakEURUSD is currently moving within a clear sideways range between 1.16400 and 1.18400, positioned just above the ascending channel line. Recent price action shows consolidation, with lower highs forming near 1.18400 while support holds firmly.
If price breaks below the range, a retest of the channel support around 1.16400 is likely. On the other hand, a bounce from current support may lead to another attempt toward the upper resistance. Traders should wait for a clear breakout signal before entering in the new trend direction.

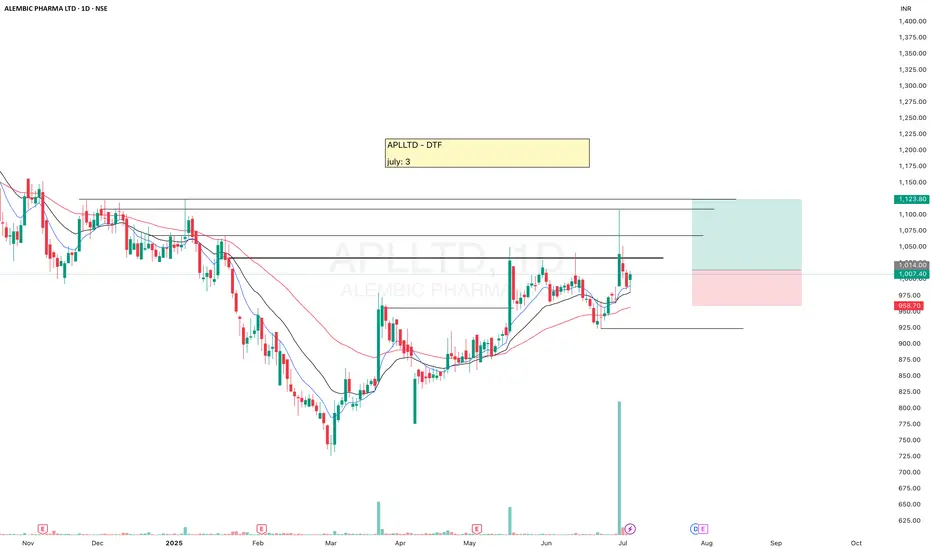
APLLTDAPLLTD is getting ready, moving above 20-50ema, probability of an upside move.
Keep eyes on it.
✅ If you like my analysis, please follow me as a token of appreciation :)
in.tradingview.com/u/SatpalS/
📌 For learning and educational purposes only, not a recommendation. Please consult your financial advisor before investing.
XAUUSD 03/07: GOLD IN THE DRIVER'S SEATXAUUSD 03/07: GOLD IN THE DRIVER'S SEAT – WILL IT BREAKOUT OR PULLBACK BEFORE KEY EVENTS?
Gold is on a solid upward trajectory, as expected from earlier predictions this week. After a negative ADP Non-Farm Payroll report yesterday, the USD weakened, providing the fuel for gold to soar. During the US session, gold surged from the 333x level to 336x.
🔑 Key Catalysts to Watch:
1. Political Factors:
Trump's announcement that the Republicans in the House have united to push through the "Super Bill" is a significant factor that could propel gold even further in the near future. The political climate is setting the stage for gold's potential rally.
2. Macro Overview:
Federal Reserve and Rate Cuts: The market is eyeing the Fed closely, with high expectations for two interest rate cuts this year. This could put continued pressure on the USD and further support gold. With a 90% chance of a rate cut by the end of Q3, the path is clear for gold to target new highs.
US Economic Data: Disappointing ADP data, reporting a loss of -33k jobs, continues to point to a weakening labor market, strengthening the case for gold as a safe-haven asset.
🌍 Market Conditions and Trade Setup:
The market remains on edge with these political and economic factors at play. The market will also be watching the Non-Farm Payrolls (NFP) data closely. With the ADP report showing poor results, the market could experience some turbulence ahead of the NFP release, and with a long weekend ahead due to the bank holiday, traders should approach this market with caution.
📉 Technical Outlook – The Road Ahead for Gold:
Gold has been trending upward and maintaining a bullish outlook. However, a minor pullback is expected.
Resistance: 3358 – 3365 – 3374 – 3380 – 3390
Support: 3343 – 3335 – 3325 – 3316 – 3304
📊 Trading Plan – Key Levels to Watch:
Buy Scalp:
Entry: 3335 – 3333
SL: 3329
TP: 3340 → 3345 → 3350 → 3360 → 3370
Buy Zone:
Entry: 3316 – 3314
SL: 3310
TP: 3320 → 3324 → 3328 → 3332 → 3336 → 3340 → 3350 → 3360
Sell Scalp:
Entry: 3374 – 3376
SL: 3380
TP: 3370 → 3366 → 3360 → 3355 → 3350
Sell Zone:
Entry: 3388 – 3390
SL: 3394
TP: 3384 → 3380 → 3376 → 3370 → 3366 → 3360
⚠️ Key Focus for Traders:
Upcoming Data: The NFP release will be crucial, as disappointing job numbers could drive gold even higher.
Market Volatility: With the long weekend ahead and market reactions to key news, be prepared for possible volatility.
Trade with Caution: Stick to your TP/SL strategy, manage risk, and only enter trades when clear setups appear.
📈 Conclusion:
Gold is showing strong potential for further gains, but traders should be prepared for some pullbacks as the market reacts to upcoming economic and political news. The trend remains bullish, but it’s crucial to remain cautious and follow the technical levels closely to optimize entry points. Stay alert for key developments in the USD, NFP, and Fed rate-cut expectations, and let the market guide you.

SANDUMA - (SANDUR MANG & IRON ORES)SANDUMA – After facing strong resistance at the current level for a while, the stock tapped into a demand zone in Feb 2025 and began moving up, forming a consistent Higher Highs - Higher Lows (HH-HL) structure.
It gave a breakout in May, followed by a successful retest of the breakout zone. Currently, it's trading above the 20-50 EMA, indicating strength.
The price action now suggests it's getting ready, there is probability of an upside move.
Keep following.
✅ If you like my analysis, please follow me as a token of appreciation :)
in.tradingview.com/u/SatpalS/
📌 For learning and educational purposes only, not a recommendation. Please consult your financial advisor before investing.

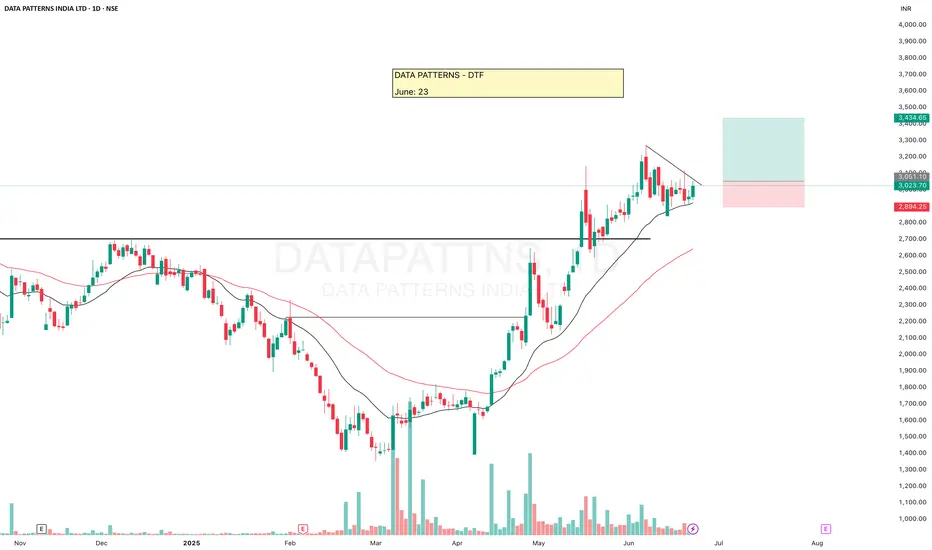
DATAPATTNS
DATA PATTERNS has been making HH-HL formation. Recently broke an old resistance, moved up, re-tested and started moving up again.
Keep following it, there is probability of an upside move.
✅ If you like my analysis, please follow me as a token of appreciation :)
in.tradingview.com/u/SatpalS/
📌 For learning and educational purposes only, not a recommendation. Please consult your financial advisor before investing.
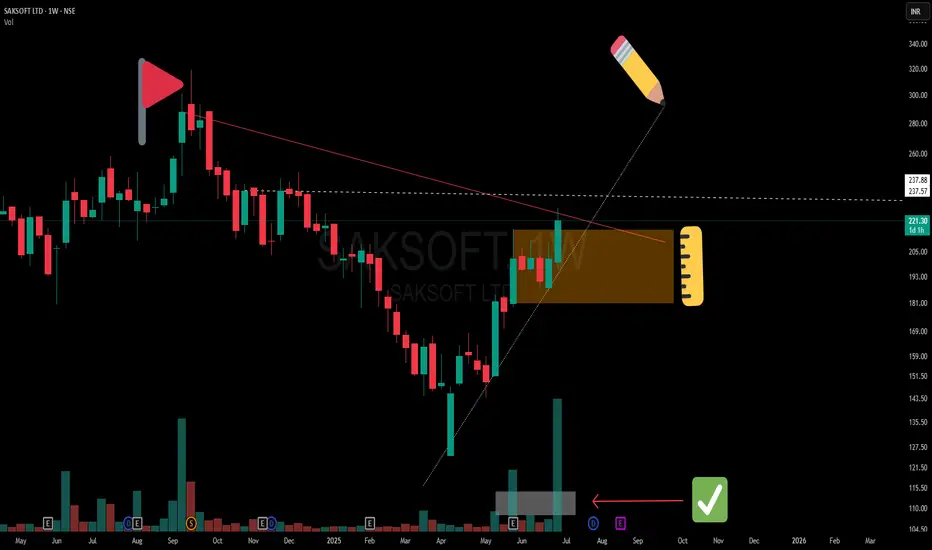
Precision Meets Patience | SAKSOFT Chart WTF🔻 A clean Control Trendline (CT) drawn from the all-time peak (🔺) on the Weekly Time Frame (WTF) shows a long-term price memory resistance finally getting tested.
📏 Overlapping that is a hidden horizontal resistance (⚪ dotted white line), representing the final hurdle before the stock can challenge the supply zone.
🟧 Mother Candle Structure: A powerful consolidation candle has now been broken with strength, giving us structure + intent in one move.
🔊 Volume speaks! We’ve seen two separate clusters of high volume, confirming active participation—not a lonely breakout.
📈 The trendline from bottom left is giving both body and wick supports—a technically clean angle where structure meets sentiment.
📝 Note:
This is a structural breakdown meant for educational and analytical purposes. Not a forecast or recommendation.
XAUUSD: Breakout Confirms Bullish ReversalGold has successfully broken out of the descending channel after consolidating around the $3,276 area, signaling a strong return of bullish momentum. The breakout occurred precisely at a confluence of multiple Fair Value Gaps, propelling price toward the $3,357 resistance zone.
Despite a slight rebound in the US dollar, growing concerns over the US fiscal deficit and proposed tax reforms are driving investors back into gold as a safe haven. Meanwhile, US bond yields remain low, and the dollar lacks the strength to suppress gold demand.
As long as price holds above $3,320, any pullback can be seen as a buying opportunity in this newly confirmed uptrend. The next target sits around $3,357, with potential for a move toward previous highs.

TRENT LTD – INTRADAY ZONE ANALYSIS________________________________________________________________________________
📈 TRENT LTD – INTRADAY ZONE ANALYSIS
📆 Date: July 1, 2025 | ⏱ Timeframe: 15-Minute Chart
🔍 Educational Analysis for Learning Purposes Only
________________________________________________________________________________
📊 Zone Breakdown:
• 🔴 Top Range Resistance – 6,261
Marked in Red: This is a key supply zone where the price has previously stalled. Traders should watch for bearish reversal candlestick patterns like a bearish engulfing, evening star, or long upper wick rejection. A lack of follow-through volume here may indicate exhaustion.
• 🟠 Neutral Zone – Avoid Trade Area (6,155 – 6,210)
Marked in Orange: Price tends to be indecisive here. This is a “no trade zone” unless supported by a strong trend direction and setup. Historically, it has shown sideways movement and choppy behaviour.
• 🟢 Demand Zone – 6,105 to 6,066.50 | SL: 6,058.10
Marked in Green: Price reacted sharply from this zone with rising volume. A bullish engulfing candle confirmed demand here. Ideal for watching pullback opportunities on re-tests, supported by bullish confirmation candles.
• 🟩 Bottom Support – 5,968
A strong base level. A breakdown below this zone may signal a shift in short-term structure. Look for volume spike and wide-bodied red candle for bearish confirmation.
________________________________________________________________________________
🔍 Candlestick Observation:
At the Top Resistance Zone (6261), recent candles show upper wicks and indecision, but no strong bearish reversal yet. Volume is elevated, signaling activity, but candles show hesitation.
🧠 Interpretation: This could be an early sign of supply pressure. A follow-up bearish engulfing or strong rejection candle may validate a reversal. Until then, price may consolidate within the zone.
________________________________________________________________________________
⚙️ Educational Trade Ideas (Study Purpose Only)
▶️ Reversal Setup – Bearish Bias
• Entry: Below ₹6,190 on confirmation candle from resistance zone
• Stop Loss: Above ₹6,265
• Risk-Reward: 1:1 | 1:2 +
• 🧠 Ideal for learning how price reacts to supply after a sharp rally
________________________________________________________________________________
▶️ Pullback Setup – Bullish Bias
• Entry: Near ₹6,100–₹6,110 on bullish confirmation from demand zone
• Stop Loss: ₹6,058
• Risk-Reward: 1:1 | 1:2 +
• 🧠 A classic “Breakout–Retest–Continuation” setup with proper risk management
________________________________________________________________________________
⚠️ Disclaimer (SEBI-Compliant):
This content is shared strictly for educational and informational purposes only. It does not constitute investment advice or a trading recommendation. Always consult a SEBI-registered financial advisor before making investment decisions.
STWP | Learn. Trade. Grow.
________________________________________________________________________________
💬 What do you think about this TRENT setup?
Did you observe any volume divergence or trendline reaction?
👇 Drop your insights in the comments — let’s grow together!
________________________________________________________________________________
Bonus:

Strong Bullish Momentum or a Short-Term Setback?XAUUSD Analysis – 02/07: Strong Bullish Momentum or a Short-Term Setback?
Gold has made a strong recovery after a brief period of consolidation last month, and it continues to show signs of strong bullish momentum. The price has been fluctuating, yet the overall trend remains positive. Let’s dive into the technical setup for today’s trading session.
📊 Market Overview:
Recent Price Action: After confirming a bullish reversal on the H1 timeframe earlier this week, Gold has surged significantly. Yesterday, it reached 3358, completing wave 3 of an Elliott structure on the M30 chart, followed by a slight correction during the US and Asian sessions.
Short-Term Correction: Wave 4 is currently underway, and there are two potential outcomes for this correction:
It could find support at 3328-3330, leading to a continuation of the bullish trend.
Alternatively, it may dip further to the 330x range before resuming the uptrend.
🧭 Key Levels to Watch:
Support: 3328 – 3313 – 3304 – 3294
Resistance: 3344 – 3360 – 3368 – 3388
🧠 Trading Strategy for Today:
Buy Scenario:
Watch for a potential bounce around the 3328-3330 range. If this area holds, we can look for buying opportunities with a target towards 3358 and 3360.
If the price breaks through the 3340 level, consider entering long positions and setting targets around 3350-3360.
Sell Scenario:
Sell Near Resistance: A quick scalping opportunity could arise near the 3388-3390 resistance zone. Tight SL and reasonable TP at 3384-3380 are the targets to aim for.
For a longer-term Sell position, wait for a clearer breakdown below 3370 to target deeper levels like 3360.
🎯 Trading Plan for Today:
BUY ZONE:
Entry: 3306 – 3304
SL: 3300
TP: 3310 → 3315 → 3320 → 3325 → 3330 → 3340
SELL ZONE:
Entry: 3388 – 3390
SL: 3394
TP: 3384 → 3380 → 3376 → 3370 → 3365 → 3360 → 3350
⚡️ Key Considerations:
The US macroeconomic data release and potential volatility from ADP NonFarm Payrolls today could provide significant movement, so stay alert and monitor the data closely.
In Summary:
Bullish bias remains intact with strong buy opportunities around key support levels like 3328-3330.
For short-term traders, focus on quick scalping within the resistance zones, but don’t forget to follow the trend for the longer-term buy strategy.
💡 Stay cautious with your Stop Loss (SL) and Take Profit (TP) to manage risk effectively. Happy trading! 🌟

XAUUSD jumps 4,873 pips – Is the bullish momentum back?Yesterday, gold surged by 4,873 pips, equivalent to a $48.73 gain, signaling strong buying pressure after a technical correction. Price rebounded from Support 1 near $3,264 — a key support zone in previous sessions. The current price structure suggests a high probability of breaking above the $3,347 resistance and continuing toward the $3,389 target. Notably, the filled green FVG zone confirms the recovery and reinforces confidence in the bullish outlook.
On the news front, the de-escalation of the Iran–Israel conflict caused a brief drop in gold earlier. However, the US dollar remains at its weakest level in three years, and rising concerns over a potential budget deficit from the $3.3–3.9 trillion US tax reform package continue to support gold as a safe-haven asset.
Trade strategy: Look for long opportunities if price holds above $3,264 and clearly breaks through $3,347. The next upside target lies around the $3,389 resistance zone.

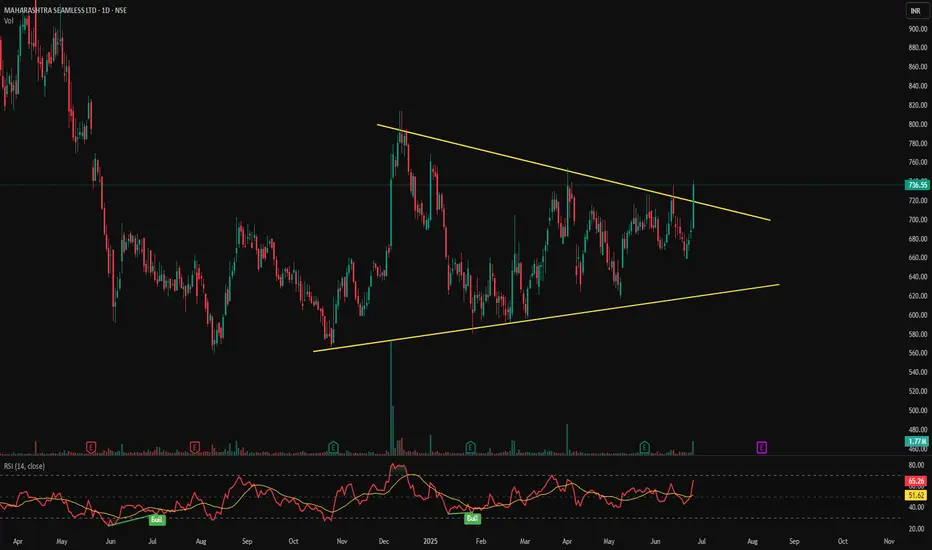
MAHSEAMLES - Symmetrical Triangle Breakout📊 MAHSEAMLES – Symmetrical Triangle Breakout | RSI Bullish | Volume Surge | Daily Timeframe
📅 Chart Date: June 26, 2025
📈 CMP: ₹736.55 (+7.20%)
📍 Ticker: NSE:MAHSEAMLES
🔍 Technical Analysis Overview
🔺 Symmetrical Triangle Breakout
After months of consolidation within a symmetrical triangle pattern, MAHSEAMLES has broken out with a strong bullish candle
Breakout level: Above ₹725, confirmed with strong price momentum
Breakout marks potential trend reversal and beginning of new bullish phase
📊 Volume
Volume spike to 1.77M, significantly higher than recent average – validates breakout strength
📈 RSI Indicator (14)
RSI at 65.26, trending upwards – bullish zone
Previous RSI Bullish signals noted at key turning points, providing confluence
📍 Key Technical Levels
✅ Breakout Level: ₹725
🚀 Potential Upside Targets (based on pattern height projection):
₹770
₹800
₹840+
🛡️ Support Zones:
₹700 (retest zone)
₹670 (lower trendline support)
₹635 (triangle base)
💡 Trade Setup Idea
Entry: On breakout close above ₹725 with confirmation
Stop Loss: Below ₹695 (just under triangle resistance)
Targets: ₹770 → ₹800 → ₹840+
Risk-Reward: Favorable with pattern breakout and rising momentum
⚠️ Disclaimer
This chart analysis is for educational purposes only. Always DYOR (Do Your Own Research) and consult a financial advisor before making investment decisions.
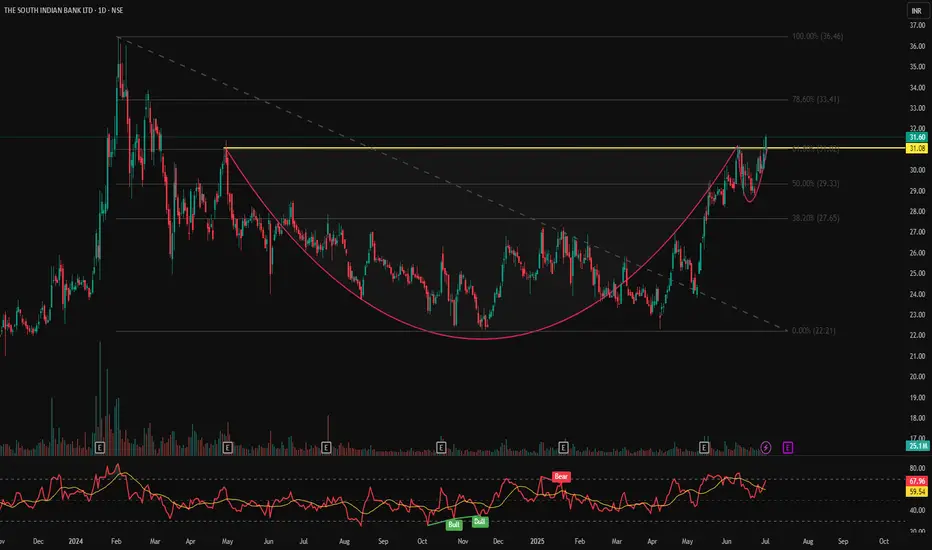
SOUTHBANK – Breakout From Cup & Handle | Daily Chart📊 SOUTHBANK – Breakout From Cup & Handle | RSI Bullish | High Volume | Fibonacci Levels | Daily Chart
📅 Chart Date: July 2, 2025
📍 CMP: ₹31.60 (+2.63%)
📈 Symbol: NSE:SOUTHBANK
🔍 Technical Breakdown
✅ Cup & Handle Breakout
A perfect cup & handle pattern breakout is visible
Price breaks out above the neckline at ₹31.08, which was a strong resistance zone
Breakout supported by rising volume (25.1M) adds conviction
📊 RSI Momentum
RSI (14) reading at 67.96 signals bullish strength, approaching overbought but not yet extreme
RSI crossover and previous bullish divergence helped initiate the move
📐 Fibonacci Retracement Levels (Swing: ₹22.21 to ₹36.46)
38.2% – ₹27.65
50.0% – ₹29.33
61.8% – ₹31.08 ✅ (Breakout zone)
78.6% – ₹33.41
100% – ₹36.46 🎯
🏁 Key Levels
Breakout Zone (Neckline): ₹31.08
CMP: ₹31.60
Resistance Levels: ₹33.41 → ₹36.46
Support Levels: ₹29.33 → ₹27.65
💡 Trade Idea
Entry: Above ₹31.10 on volume confirmation
SL: Below ₹29.30
Targets: ₹33.40 → ₹36.40+
Momentum + Breakout = High Conviction Setup
⚠️ Disclaimer
This analysis is for educational purposes only. Always do your own research and consult a registered advisor before investing.
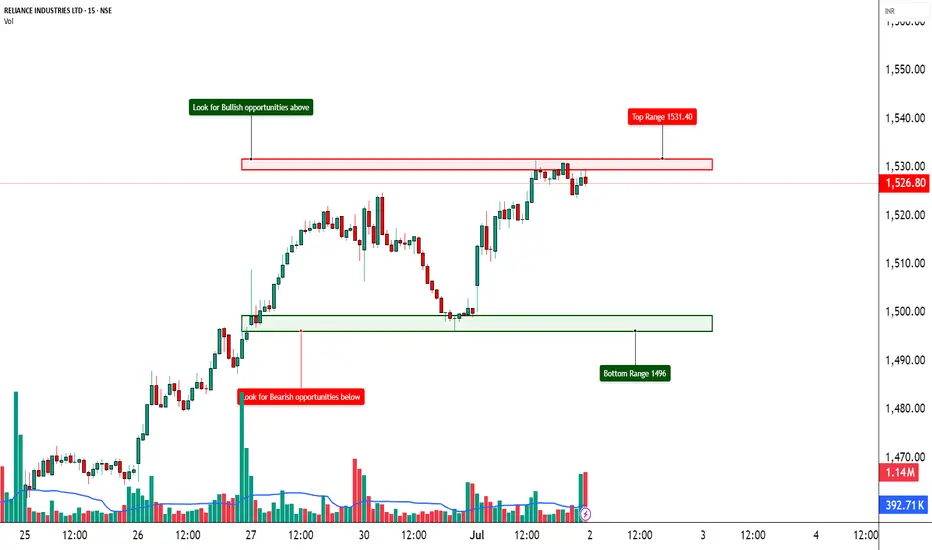
RELIANCE – Short Covering Fueling a Reversal?📈 RELIANCE – Short Covering Fueling a Reversal?
🔍 Heavy Action Across 1500–1570 CEs | Bullish Reversal on the Cards?
Chart Type: 15-min / 1H / Daily
Indicators: STWP Zones, Option Chain Activity, Volume Clusters, Demand-Supply
🔹 What’s Catching Our Eye?
✅ Aggressive Long Build-Up across multiple CEs (1550–1580)
✅ Massive Short Covering on 1500–1530 Calls – Bears exiting fast
✅ Huge OI Additions at 1550, 1560, 1570 CEs – Smart money positioning ahead?
✅ Put Writers Building Base at 1500–1520 PE → Strong support developing
✅ Spot Price at ₹1528.4 – Right at the heart of breakout zone
✅ IVs remain in control (~15.9–16.3%) = room for expansion
📊 What We’re Watching for:
📍 Breakout Zone: 1530–1540
📍 Targets: 1560 → 1580 → 1600
📍 Invalidation Below: 1490
📍 Momentum Confirmation: Price closing above 1540 with volume & OI spike
📍 Option Chain Support: 1500 PE (OI: 29.3L) + short build-up in multiple puts
📌 Trade Plan (Educational Purpose Only):
🔹 Bullish Idea: Buy above 1530–1540 with SL below 1490
🔹 Options Play: 1550 or 1560 CE suitable for short-term directional trades
🔹 Positional Angle: Momentum may sustain toward 1600 if 1540 holds
⚠️ Disclaimer:
This post is for educational and learning purposes only.
It does not constitute buy/sell advice or investment recommendation.
Always consult your financial advisor before taking any positions.
STWP is not liable for any financial decisions based on this content.
📚 “When bears cover in panic, bulls prepare their charge.”
💬 What’s your take on Reliance? Is 1600 on the radar, or is this just a squeeze?
MAZDOCK - – INTRADAY ZONE ANALYSIS________________________________________________________________________________📈 MAZAGON DOCK SHIPBUILDERS LTD. – INTRADAY ZONE ANALYSIS
📆 Date: July 1, 2025 | ⏱ Timeframe: 15-Minute Chart
🔍 Educational Breakdown – For Learning & Study Use Only
________________________________________________________________________________
🔹 Price Action Zones
🔴 Top Range (Resistance): ₹3341
🟢 Bottom Range (Support): ₹3094
⚪ No Trade Zone: (Trade only with trend + confirmation in this zone)
________________________________________________________________________________
🧩 Chart Pattern: No visible chart pattern seen.
________________________________________________________________________________
🔁 Reversal Candlestick Patterns:
🔴 Top Range:
✅ Multiple strong rejection candles near ₹3341 along with long upper wicks and volume drop — suggesting supply zone holding.
🟢 Bottom Range:
✅ Bullish Marubozu and wide-range green candles seen around ₹3094, confirming strong buyer interest and a potential reversal zone.
________________________________________________________________________________
🧠 1. Trade Plan (Based on Reason and Logic)
🔼 Bullish Trade:
Idea: Go long if price retests ₹3120–₹3094 demand zone with bullish confirmation (strong bullish candle, reversal candles, volume support, long wick)
Stop Loss: Below ₹3090
Risk-Reward: 1:1 | 1:2+
Logic: Strong buyer reaction from demand zone previously suggests continued interest if tested again.
________________________________________________________________________________
🔽 Bearish Trade:
Idea: Short if price retests ₹3341–₹3310 and rejects with bearish candle formation (strong bearish candle, reversal candles, volume support, long wick).
Stop Loss: Above ₹3347.55
Risk-Reward: 1:1 | 1:2+
Logic: Supply zone confirmed with rejections earlier. Reversal here can lead to downside till mid or demand zone.
________________________________________________________________________________
📦 2. Trade Plan Based on Demand/Supply Zones
🟥 Supply Zone: ₹3341 – ₹3310
SL: ₹3347.55
Plan: Enter short if price shows rejection with bearish confirmation at this zone.
Risk-Reward: 1:1 | 1:2+
🟩 Demand Zone: ₹3120 – ₹3094
SL: ₹3090
Plan: Enter long on bullish reversal setup from this demand area.
Risk-Reward: 1:1 | 1:2+
________________________________________________________________________________
📌 Disclaimer
This analysis is for educational and study purposes only. It does not constitute investment advice. The author is not SEBI-registered. Please consult a SEBI-registered advisor before trading. Always use strict risk management and act only on confirmation.
________________________________________________________________________________
💬 Comments
What’s your view on MAZDOCK?
Will it break the supply zone and rally higher, or revisit the demand zone before bouncing back?
Share your thoughts and chart setups below 👇
________________________________________________________________________________

Breakout Confirmation Above ₹2491 - Trend Reversal in Play?After months of downtrend, Asian Paints is showing signs of reversal. A clear Change of Character (CHoCH) has been marked, and the price is approaching a key resistance at ₹2491.
🔍 Trade Idea:
Entry (Trigger): Weekly close above ₹2491 (break of recent BSL)
Target: ₹3203 (Previous high + Weekly Fair Value Gap zone)
Stop Loss: Below swing low around ₹2110
Risk-Reward: Approx. 1:2.8+
📌 Technical Confluences:
CHoCH confirmed in mid-2025
Weekly FVG above offers price imbalance that price may seek to fill
Current structure forming a higher low with bullish momentum
💬 Idea: Wait for a strong weekly close above ₹2491 for confirmation. Once confirmed, a potential rally towards ₹3200+ is in play, targeting the FVG zone and liquidity above the previous swing high.
⚠️ Disclaimer: This analysis is for educational purposes only and not financial advice. Always do your own research and use proper risk management.

BLUE STAR LTD. – TECHNICAL ANALYSIS📈 BLUE STAR LTD. – TECHNICAL ANALYSIS
📆 Date: July 1, 2025 | ⏱ Timeframe: Daily Chart
🔍 Educational Breakdown – For Learning & Study Use Only
________________________________________________________________________________
🔹 Price Action Zones
• 🔴 Top Range (Resistance): 2417
• 🟢 Bottom Range (Support): 1521
________________________________________________________________________________
🔹 Chart Pattern: ✅
Rectangle/Box Consolidation Breakout – Price was range-bound in a tight zone and has given a strong breakout on high volume, indicating bullish intent.
________________________________________________________________________________
🔹 Reversal Candlestick Patterns
• Top Range (2417): ⛔ No recent candlestick activity visible at the top range.
• Bottom Range (1521): Todays Candle
✅ Bullish Engulfing + Strong Bullish Candle
✅ RSI Bounce + Volume Spike
✅ Confirmed by Price Action and Momentum Indicators
________________________________________________________________________________
📊 Trade Plan (Based on Reason and Logic)
🔼 Bullish Trade Setup:
• Entry: 1715 (Breakout Candle Close)
• Stop Loss: 1614.45 (Below consolidation and bullish candle)
• Target 1: 1850
• Target 2: 1980
• Reason:
o Strong breakout with above-average volume
o Multiple confirmations (RSI, Bollinger Band, Supertrend)
o Box breakout with previous supply cleared
________________________________________________________________________________
🔽 Bearish Trade Setup:
• If price fails to sustain above 1715 and closes back below 1680 zone
• Entry: Below 1665 (Fakeout confirmation)
• SL: Above 1715
• Target: 1615 / 1550
• Reason: Potential failed breakout & liquidity trap
________________________________________________________________________________
📌 Disclaimer
This analysis is shared for educational and study purposes only. It does not constitute investment advice. The author is not SEBI-registered. Please consult a SEBI-registered advisor before making trading decisions. Always use proper risk management and trade only with confirmation.
________________________________________________________________________________
💬 Comments
What’s your view on Britannia?
Drop your thoughts and chart setups
________________________________________________________________________________

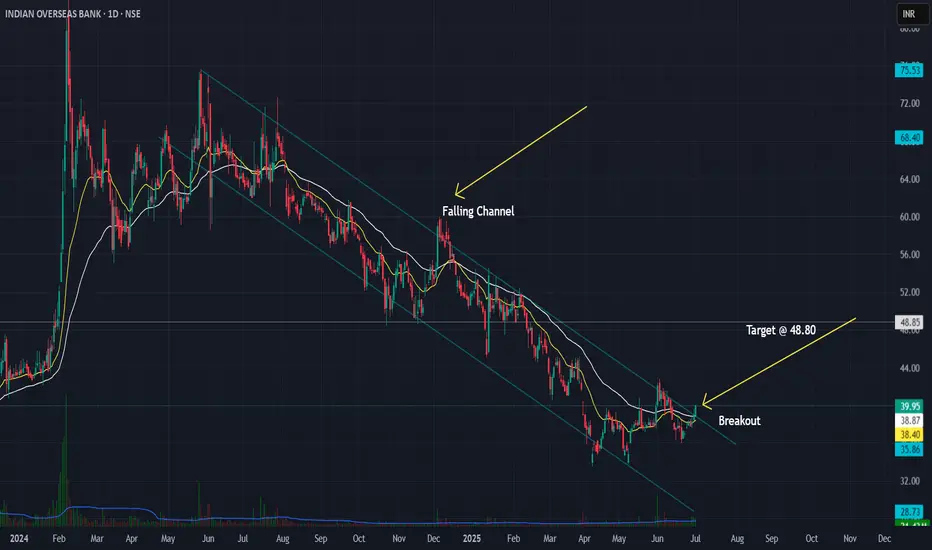
Indian Overseas Bank (IOB) - Falling Channel Breakout Setup📈 Indian Overseas Bank (IOB) – Falling Channel Breakout Setup
Watching a classic falling channel on the daily timeframe with multiple touches on both trendlines. Recent breakout above ~38.8 confirms the channel break.
✅ Planned Trade Details:
- Entry above 38.8 (confirmation)
- Stop-loss: 35.90
- ATR-based stop option: ~37.45 for tighter risk control
- Target zone: 48.80 based on channel height projection
Volume confirmation and follow-through will be key for validating the breakout. Tracking this for a positional swing trade.