PARAMOUNT COMA LTD📊 PARAMOUNT COMA LTD (1D) – CMP ₹60.08
📅 Date: May 20, 2025
📈 Exchange: NSE
📌 Ticker: PARACABLES
🧠 Technical Analysis Overview
✅ Bullish W-Pattern (Double Bottom):
Price has formed a strong W-pattern, also known as a double bottom, indicating a potential trend reversal. The neckline breakout above ₹58.00 confirms bullish momentum.
✅ Downtrend Breakout:
The long-term falling trendline has been broken decisively with strong bullish candles and increasing volume – a classic reversal signal.
✅ Volume Spike:
Breakout has occurred with significant volume (1.98M), confirming the strength of the move and hinting at potential institutional entry.
✅ Fibonacci Retracement Levels:
🔶 38.2% – ₹65.69
🟩 50.0% – ₹72.36
🟩 61.8% (Golden Ratio) – ₹79.03
💡 Price Action Strategy
🧱 Key Support & Resistance Levels
🟩 Support
₹58.00 – Previous neckline breakout level
₹50.00 – Mid-range base level
🟥 Resistance (Fibonacci-based)
₹65.69 – 38.2%
₹72.36 – 50%
₹79.03 – 61.8% Golden Ratio
📌 Conclusion
PARAMOUNT COMA LTD has triggered a strong breakout after forming a W-pattern and clearing a key trendline. With volume confirmation and upside potential toward Fibonacci levels, this could be a promising swing trade setup. Retesting ₹58 zone could offer a perfect entry opportunity.
📌 Disclaimer:
This is for educational purposes only. Not financial advice. Always do your own research or consult a financial advisor.
Technical Analysis

GOLD MARKET UPDATE - BE READY FOR BIG MOVES!🔥 GOLD MARKET UPDATE – FED'S HAWKISH STANCE SHAKES INVESTORS | BE READY FOR BIG MOVES!
Gold experienced a sharp drop following the latest hawkish comments from the Federal Reserve, as they reaffirmed that current monetary conditions remain stable and tight. This has caused confusion and panic among many investors, leading to a wave of sell-offs during the U.S. and early Asia sessions.
📉 On the higher timeframes, Gold appears to be forming a bearish flag pattern – a classic consolidation structure before a potential continuation move. Despite the strong bullish momentum seen during the Asian and European sessions yesterday, the key resistance near 325x held firm, preventing any major breakout.
For now, Gold seems to be trapped in a new sideways range, and unless price decisively breaks above 325x, we may continue to see choppy price action within this zone.
⚠️ However, if the current selling momentum persists and the price breaks down below the lower trendline support, the bearish flag setup could play out, with up to 80% probability, signaling a potential strong continuation of the downtrend.
Traders should stay extremely alert – a major price movement could happen at any moment!
🔑 Key Support Levels:
3205
3294
3280
3262
🔑 Key Resistance Levels:
3244
3262
3278
3286
💹 Scalping Setup – BUY:
Entry: 3294–3292
Stop Loss: 3288
Take Profit Targets:
3298 – 3302 – 3306 – 3310 – 3315 – 3320 – 3330
🟢 BUY ZONE:
Entry: 3272–3270
Stop Loss: 3266
Take Profit Targets:
3276 – 3280 – 3284 – 3288 – 3292 – 3296 – 3330
🔻 Scalping Setup – SELL:
Entry: 3242–3244
Stop Loss: 3248
Take Profit Targets:
3238 – 3234 – 3230 – 3226 – 3220 – 3210
🔻 SELL Zone:
Entry: 3276–3278
Stop Loss: 3282
Take Profit Targets:
3272 – 3268 – 3264 – 3260 – 3250 – 3240
📌 Remember to always follow your TP/SL strategy to protect your capital!

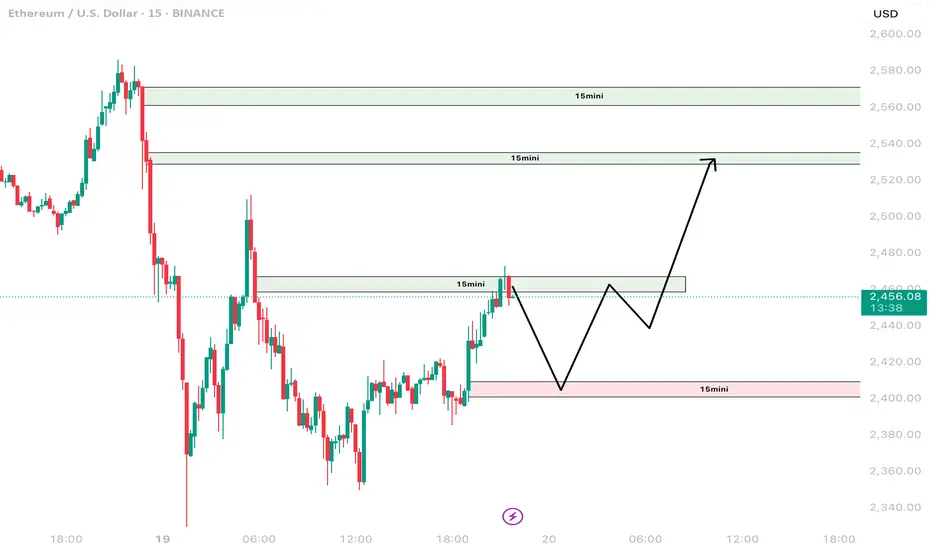
ETHEREUM | Technical Analysis 20th May 2025Hi,
I am sharing my daily view on ethereum for 20th May, 2025.
If you like my analysis then please share and like this post.
Disclaimer: This is only for educational purpose.
Thanks.
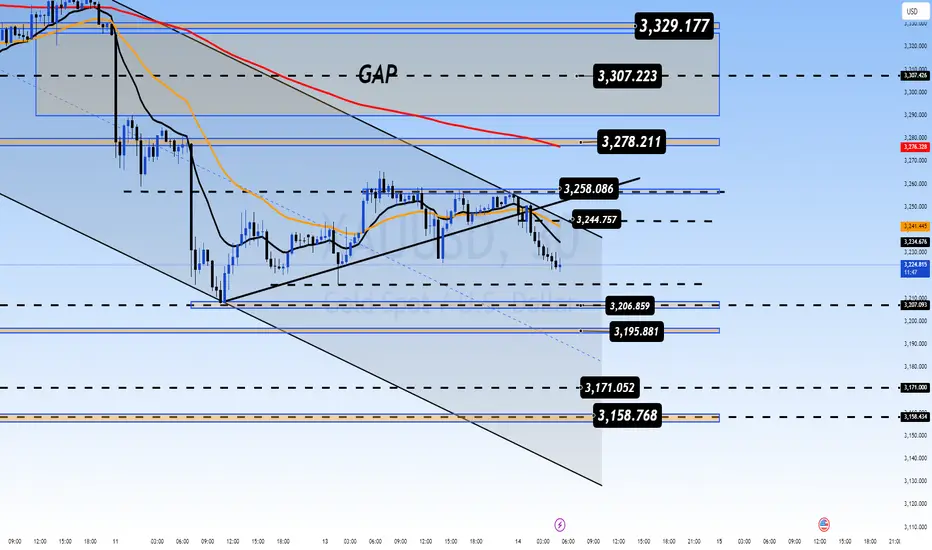
GOLD DAILY PLAN MAY 19: IS THIS THE START OF A MASSIVE BULLISH GOLD DAILY PLAN – MAY 20: IS THIS THE START OF A MASSIVE BULLISH RUN?
Gold opened the new trading week with a powerful GAP UP of over 20 USD, followed by an additional 50 USD rally during the Asia session. This explosive move is being fueled by geopolitical tensions and macroeconomic uncertainty, setting the tone for what could be a highly volatile and profitable week for gold traders.
🔥 Key Fundamental Drivers Behind This Gold Rally:
1️⃣ Putin rejects peace talks – Increased war risks reignite gold’s safe-haven appeal.
2️⃣ U.S. credit rating downgraded – Rising debt and bond yields are pushing investors back to gold.
3️⃣ Trump threatens new trade tariffs – Even a softer version of “Trade War 2.0” could shock global markets, making gold a top hedge.
➡️ With no clear resolutions in sight, gold may soon retest the all-time high of $3,500.
🧠 Technical Analysis: Bullish Signals Are Confirming
EMA13 has crossed above EMA34 and EMA200 on the M30 chart — a classic reversal confirmation.
The main trendline was broken, and price is now retesting the breakout zone.
Momentum remains strong, and price structure is shifting bullish. Priority is now to BUY the dips rather than sell counter-trend.
📌 Key Price Levels to Watch:
🔺 Resistance Zones:
3254 – 3277 – 3288
(If price breaks above 3287, we may quickly see a move toward 3350–3500.)
🔻 Support Zones:
3204 – 3193 – 3186 – 3174 – 3163
(Best areas to watch for confirmation to BUY.)
🎯 Suggested Trade Ideas:
BUY Zone: 3186 - 3184
Stop-Loss (SL): 3180
Take-Profit (TP): 3190 → 3195 → 3200 → 3210 → 3220 → 3230
BUY Scalp: 3194 - 3192
Stop-loss: 3189
Take-Profit: 3200 - 3204 - 3210 - 3215 - 3220
SELL Zone: 3287 - 3289 Only scalp or take quick profits near resistance zones
Stop-Loss (SL): 3293
Take-Profit (TP): 3285 → 3280 → 3285 → 3280 → 3270
(Note: Avoid holding SELLs, only scalp on strong bearish signals.)
⚠️ Trading Notes:
Market is highly sensitive to geopolitical headlines. One comment from Trump or Putin could move gold 50–100 USD in minutes.
No need to chase price. Let it come to your zones — and only enter on clear confirmations.
📌 Summary:
✅ Structure has turned bullish across M30 and H4.
✅ Focus on buying dips, not shorting into strength.
✅ Medium-term target zones: 3350 → 3400 → 3500, depending on continued macro pressure.
📣 Follow AD for live trading plans, market sentiment, and smart entry zones every session!
Good luck & stay disciplined.

Vascon Engineers – Weekly CT BreakoutA clean Weekly CT breakout supported by strong volume (19M+), signaling strength. Key levels and structure:
🔍 Technical Breakdown:
📏 CT Line (White): Clean breakout from weekly closing-based counter-trendline
🕵️ Hidden Line (Dotted White): Secondary hidden resistance cleared
🟧 ₹45.49 Zone: Major gap-up area on DTF – key retracement demand zone
🔵 200 DEMA (Blue Line): Historical resistance now flipped – strength confirmed
🟥 Supply Zone (₹78–₹83): Overhead resistance – long-term target zone
📈 Volume: 🔥 Spiked to 19M+ – highest since Jan ‘24 – confirms breakout strength

GOLD Pullback or Bull Trap? This Move for the WEEK⚡️Will the Recovery Hold or Just a Retest Before Another Drop?
🧠 Macro Backdrop:
Geopolitical tension: US-China trade headlines and Russia-Ukraine negotiations continue to stir uncertainty, but risk appetite is still cautious.
US CPI and PPI data this week came in weaker than expected → inflation remains soft, but no signal yet for immediate rate cuts from the Fed.
Gold has been under pressure for 2 weeks but may be stabilizing as DXY loses steam and equity markets show hesitation.
🔍 Technical Outlook (Chart: M30–H1):
Gold is forming a rising wedge within a broader corrective pattern. Yesterday’s rebound from the 3,163 zone has pushed price back above the 20 EMA (black) and is testing the 3,208–3,210 zone.
This area is key for today: breakout or rejection?
🔑 Key Levels to Watch:
🔺 Resistance:
3,221 → Local structure neckline
3,235 → Previous supply + Fibo confluence
3,251 → Strong upper bound resistance
🔻 Support:
3,184 → Minor support (demand block)
3,173 → Swing low (key reaction zone)
3,163 → Final line of defense
📈 Trade Scenarios:
⚠️ Scenario A – Bullish Push Above 3,221:
If price breaks and holds above 3,221, we may see a bullish continuation to 3,235 and even 3,251.
Momentum confirmation: Price must stay above 3,210 on pullbacks.
🔹 Entry: 3,222 – 3,224
🔹 SL: 3,216
🔹 TP: 3,235 → 3,251
⚠️ Scenario B – False Break & Bearish Rejection:
If price fails to hold above 3,221 and reverses below 3,208 → potential short opportunity targeting lower liquidity zones.
🔻 Entry: 3,220 – 3,218 (after rejection)
🔻 SL: 3,228
🔻 TP: 3,184 → 3,173 → 3,163
⚠️ Scenario C – Range Play:
If price remains between 3,208 and 3,184, scalp inside the range and wait for breakout confirmation.
💬 Follow for real-time setups and live strategy updates during major market sessions.

Gic Housing Fin co., Looking good ; min 65 % Roi ; swingAdd this to watchlist and wait for entry.👁️🗨️
For short term investment ;
Leave a " Like If you agree ".👍
.
Wait for small retracement & daily candle to close above - "185".
Trade carefully untill ENTRY level.
.
Entry: 185 / 175
target:201-226-262-300-321
sl:167
major stoploss/ support: 160
.
.
Enter only if market Sustains above
"Yellow box" mentioned.
.
.
Don't make complicated trade set-up.📈📉
Keep it " simple, focus on consistency "💹
Refer our old ideas for accuracy rate🧑💻
Follow for daily updates👍
.
Refer old posted idea attached below.

MACD + RSI Divergence Combo – The Deadly Entry Trick!Hello Traders!
In today’s educational post, we’ll break down one of the most powerful technical setups used by pro traders – the MACD + RSI Divergence Combo . When used together, these indicators don’t just show momentum — they reveal high-probability reversal zones. This setup can help you time perfect entries and avoid false breakouts or breakdowns.
Why Combine MACD and RSI Divergence?
MACD Divergence shows when the price is moving in one direction, but momentum is fading — a clear warning of potential reversal.
RSI Divergence helps confirm overbought/oversold conditions and adds strength to the reversal signal.
Combining Both gives double confirmation, increasing accuracy of entries with minimal lag.
How to Trade This Combo Setup
Step 1: Identify Divergence on MACD
Look for a higher high in price but a lower high on MACD (bearish divergence) or lower low in price with higher low on MACD (bullish divergence).
Step 2: Confirm with RSI Divergence
Now check if RSI also shows a similar divergence pattern. If yes — the setup is strong.
Step 3: Enter with Candle Confirmation
Wait for a strong reversal candle (like engulfing, hammer, or shooting star) before entering the trade.
Step 4: Place Stop-Loss
Place SL below recent swing low (for long) or above swing high (for short).
Step 5: Ride the Move with Trailing Stop
Use support/resistance or moving averages to trail your stop-loss and let profits run.
Rahul’s Tip
One divergence = a warning. Two divergences = a sniper entry!
This combo setup reduces noise and gives you clarity — especially during range-bound markets or weak trends.
Conclusion
The MACD + RSI Divergence Strategy is a reliable tool for spotting trend exhaustion and entering before the crowd. Combine this with proper candle confirmation and risk management, and you’ll have a deadly weapon in your trading toolkit!
Have you tried using this combo before? Drop your experience in the comments and let’s learn together!
If you found this post valuable, don't forget to LIKE and FOLLOW!
I regularly share real-world trading setups, actionable strategies, and learning-focused content — all from real trading experience, not theory. Stay connected if you're serious about growing as a trader!

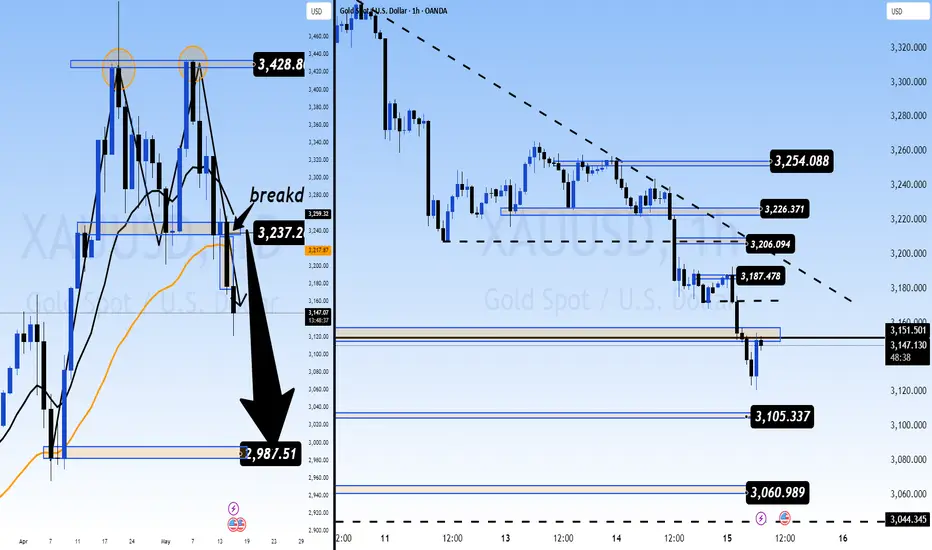
GOLD OUTLOOK – MAY 16: MARKET TRAP OR LEGITIMATE RECOVERY?GOLD OUTLOOK – MAY 17: MARKET TRAP OR LEGITIMATE RECOVERY?
Gold is closing out the week with unpredictable volatility, following two extreme sessions where prices dropped over 100 pips, only to rebound aggressively. Are recent news headlines just justifying the price action, or is this a well-orchestrated market trap?
🔍 Technical Breakdown (D1 & H4)
On the daily and 4-hour charts, we can clearly see a sharp breakdown, followed by an immediate rebound into the 325x area.
🎯 Key Level to Watch: 3254 – 3256
If price remains below 3256, sellers continue to dominate.
If 3256 is broken to the upside, we could see a quick move toward 327x–328x.
This zone acts as a decisive barrier between continuation and reversal.
🌐 Macro Perspective – Market Triggers
US inflation data continues to disappoint, weakening the USD and halting DXY recovery.
US-China tensions flare up again after short-lived optimism, especially around tariff talks and rare earth restrictions.
With mixed geopolitical cues, this market is prone to fakeouts and liquidity sweeps, especially ahead of the weekend.
📌 Key Levels to Monitor
🔺 Resistance Zones: 3237 – 3251 – 3261 – 3276 – 3287
🔻 Support Zones: 3205 – 3188 – 3170 – 3143
🎯 Trading Plan
🔵 BUY SCALP:
Entry: 3172 – 3170
SL: 3166
TP: 3176 → 3180 → 3184 → 3188 → 3192 → 3200
🔵 BUY ZONE:
Entry: 3142 – 3140
SL: 3136
TP: 3146 → 3150 → 3154 → 3158 → 3170 → 3180 → 3190
🔴 SELL SCALP:
Entry: 3160 – 3162
SL: 3166
TP: 3156 → 3152 → 3148 → 3144 → 3140 → 3130
🔴 SELL ZONE:
Entry: 3276 – 3278
SL: 3282
TP: 3272 → 3268 → 3264 → 3260 → 3255 → 3240
⚠️ Key Notes:
Friday sessions often bring major liquidity grabs and false breakouts.
Be disciplined with SL/TP management – especially in such volatile conditions.
Wait for candle confirmation before reacting — don’t trade emotionally.

BTC/USD DAILY PLAN – Will Bitcoin Hit 110K Before Reversing?BTC/USD DAILY PLAN – Will Bitcoin Hit 110K Before Reversing?
After a strong bullish impulse, BTC is now consolidating in a tight range between 103K–106K on the H4 chart. The ascending parallel channel remains intact, but bullish momentum is fading — a sign of potential distribution at the top.
🧠 Macro Context
BTC pumped recently thanks to ETF news and institutional inflows.
However, volume is decreasing, suggesting smart money may be offloading.
DXY and U.S. bond yields are ticking up → this could add pressure on BTC in the short term.
📊 Technical Outlook (H4 Chart)
BTC remains inside an ascending channel. Key levels to watch:
🔺 Resistance:
106,000 – local range high (H4)
110,576 – extended target if price breaks out
🔻 Support:
101,775 – bottom of current range; a breakdown here confirms weakness
94,473 – strong demand zone + EMA200
84,371 – key structural support zone if deeper correction occurs
⚠️ BTC may fake a rally toward 110K and then reverse sharply if broader macro conditions worsen.
🎯 Trading Scenarios
🔹 SCALP BUY:
Entry: 101,800 – 102,000
Stop-Loss: 100,800
Take-Profits: 103,200 → 104,000 → 105,000 → 106,000
Only enter long if price holds above 101.7K and shows strong rejection candles.
🔸 SELL ZONE:
Entry: 110,000 – 110,500
Stop-Loss: 111,200
Take-Profits: 107,000 → 105,000 → 101,775 → 94,473
Watch for exhaustion or false breakout patterns at this psychological zone.
🟢 LONG-TERM BUY ZONE:
Entry: 94,500 – 94,000
Stop-Loss: 92,500
Take-Profits: 96,000 → 98,000 → 100,000 → 103,000
Ideal for swing entries if BTC retraces into the broader demand zone.
⚠️ Key Notes:
BTC is showing signs of “rise slowly – dump fast” behavior.
Keep close watch on 101,775 – a decisive level for intraday direction.
No Fed rate cuts in sight → big money may still stay cautious.
✅ Conclusion:
Stick to trading range setups: BUY at channel base – SELL at distribution zones
Avoid FOMO and only enter trades after clear price action confirmation.
Risk management is essential during this high-trap environment.

RELIANCE INDUSTRIES - Bullish Flag & Pole Breakout (Daily T/F)Trade Setup
📌 Stock: Reliance Industries ( NSE:RELIANCE )
📌 Trend: Strong Bullish Momentum
📌 Risk-Reward Ratio: 1:3 (Favorable)
🎯 Entry Zone: ₹1454 (Breakout Confirmation)
🛑 Stop Loss: ₹1373 (Daily Closing Basis) (~5.6% Risk)
🎯 Target Levels:
₹1499.70
₹1546.85
₹1595.45
₹1648.50
₹1697.00 (Final Target)
Technical Rationale
✅ Bullish Flag & Pole Breakout - Classic bullish pattern confirming uptrend continuation
✅ Strong Momentum - Daily & Weekly RSI >60 (Bullish zone)
✅ Golden Crossover - 50 DEMA crossed above 200 DEMA
✅ Volume Confirmation - Breakout volume 20.18M vs previous day's 5.57M (Nearly 4x surge)
✅ Multi-Timeframe Alignment - Daily and weekly charts showing strength
Key Observations
• The breakout comes with significantly higher volume, validating strength
• Well-defined pattern with clear price & volume breakout
• Conservative stop loss at recent swing low
Trade Management Strategy
• Consider partial profit booking at each target level
• Move stop loss to breakeven after Target 1 is achieved
• Trail stop loss to protect profits as price progresses
Disclaimer ⚠️
This analysis is strictly for educational purposes and should not be construed as financial advice. Trading in equities involves substantial risk of capital loss. Past performance is not indicative of future results. Always conduct your own research, consider your risk appetite, and consult a financial advisor before making any investment decisions. The author assumes no responsibility for any trading outcomes based on this information.
What do you think? Are you watching NSE:RELIANCE for this breakout opportunity? Share your views in the comments!

SPDR's Heavy Outflows Signal Institutional Exit – Is Gold LosingSPDR's Heavy Outflows Signal Institutional Exit – Is Gold Losing Momentum?
📉 SPDR Gold Trust Overview (Apr 24 – May 14, 2025):
🔻 Continuous Net Selling:
From April 30 to May 14, SPDR saw 10 consecutive sessions of net selling, unloading over 18.5 tons of gold.
📌 Key Selling Days:
May 2: -4.87 tons
May 6: -2.29 tons
May 14: -2.58 tons
👉 SPDR's gold holdings dropped from ~948.56 tons to ~936.51 tons — a decrease of over 12 tons in just 3 weeks, signaling that institutional capital is exiting gold ETFs. This reflects waning confidence in gold’s short-term upside.
🕯️ Technical Breakdown:
Gold's price has broken below the $3200 support zone on the D1 chart, invalidating the bullish defense zone.
The Double Top pattern is now around 80% completed, signaling a possible deeper drop unless a strong recovery occurs.
Momentum remains strongly bearish, making it difficult to time SELL entries unless lower timeframe resistance shows up.
🧭 Macro Pressures:
Optimism around US economic growth and expectations of prolonged high interest rates are weighing on gold.
The PPI report and Fed Chair's speech today could trigger further volatility, especially if the rhetoric remains hawkish.
CPI earlier this week painted a mixed picture, with sticky inflation — which is bearish for gold.
🧠 What Smart Money Is Doing:
Big funds are rotating out of gold and back into risk-on assets like equities and crypto.
This shift is not just a technical correction; it reflects a broader macro-driven sentiment change.
Gold is currently lacking institutional support.
🎯 Trading Strategy for Today:
🔴 SELL SCALP:
Entry: 3186 – 3188
SL: 3192
TP: 3182 → 3178 → 3174 → 3170 → 3166 → 3160 → 3150 → 3140
🔴 SELL ZONE (High-Probability Resistance):
Entry: 3226 – 3228
SL: 3232
TP: 3220 → 3216 → 3210 → 3206 → 3200 → 3196 → 3190 → ???
🔺 Key Resistance Levels:
3154
3174
3188
3206
3226
3254
⚠️ What to Watch Today:
US PPI and Fed speech could trigger extreme volatility in the NY session.
Wait for price to pull back toward resistance before SELLING — don’t chase.
BUY only if a confirmed D1 reversal or high-volume reaction occurs.
🔚 Final Thoughts:
With SPDR aggressively dumping gold and price breaking below critical support, institutional flows are no longer supporting the bull case. As long as price stays under $3200, SELL remains the primary strategy. A break below $3150 opens the path to $3000.
📣 Stay tuned — AD will update real-time strategies as we approach the US session. Follow, trade smart, and always respect your TP/SL. Good luck!
DOUBLE TOP IN PLAY? IS $3000 THE NEXT STOP?DOUBLE TOP IN PLAY? IS $3000 THE NEXT STOP?
Gold (XAU/USD) is showing signs of one of the most bearish patterns on the daily chart – the Double Top formation. After reaching an all-time high near $3,500, the metal has entered a sharp correction phase, now hovering dangerously close to the psychological support at $3,200.
🕯️ Technical Breakdown:
A clear Double Top pattern is visible on the Daily (D1) chart, with two peaks forming near the same resistance level – a classical signal of bullish exhaustion.
If today's daily candle closes below the $3,200 zone, we may see a sharp drop toward the $3,000 level in the short to medium term.
The neckline of this pattern aligns with the critical support at 3196–3200 – a must-watch area for potential breakdown confirmation.
💸 What the Smart Money Is Doing:
Investors are pulling out of Gold and rotating into risk-on assets like equities and crypto, chasing higher yields and growth potential.
This shift suggests more than just technical correction – it may reflect a broader macro sentiment change, especially if the Fed continues to maintain its hawkish tone and delays rate cuts.
📊 Suggested Trade Scenarios:
🔻 If Daily Close is Below $3,200:
High probability sell setup based on Double Top
Potential downside targets: 3120 → 3050 → 3000
🔺 If Price Holds Above $3,200 and Bounces:
Watch for retracement to 3250–3278 for potential reversal signals
Short-term BUY scalp towards 3300–3320 with tight SL below 3190
⚠️ What to Watch This Week:
Key US data including CPI, PPI, and a speech from the Fed Chair are expected — which could cause high volatility.
Market is extremely reactive — avoid emotional trades and wait for clear structure confirmations.
Risk management is key, especially in current uncertain market conditions.
📌 Final Thoughts:
The Double Top on Gold is becoming a strong technical signal for potential trend reversal. A confirmed break below $3,200 could open the door to a deeper correction toward $3,000.
📣 Stay connected with AD for more real-time updates, technical levels, and smart trading setups every session.

Gold Price Faces Heavy Pressure – Key Levels and Strategy GOLD DAILY STRATEGY – 14 MAY 2025
Price fails to hold gains as sellers dominate early Asia – Eyes on 3206 zone!
🔍 Market Sentiment Update:
Gold started the day with a slight uptick, but the rally was quickly rejected, and price fell sharply — a clear signal that buying power remains extremely fragile. This kind of price behavior — slow climbs, rapid falls — is typical of a market losing confidence in its upside momentum.
At the same time, geopolitical tensions have eased and US-China tariff talks have shown signs of progress, further pressuring gold as safe-haven demand weakens. All major macro indicators are now aligning with the bearish narrative.
🟠 Conclusion? Gold is likely to stay within the current descending price channel, and any bullish pullbacks may be limited unless strong demand re-emerges.
📉 Technical Outlook:
Price is trading below key resistance and continues to reject upside attempts. The market is respecting short-term resistance zones and pushing deeper into support. Unless there’s a clear reversal signal, selling on rallies remains the optimal approach.
📌 Key Resistance Zones:
3244
3262
3278
3290
3308
3330
📌 Key Support Zones:
3216
3206
3194
3170
3158
🎯 Trade Setups:
🔴 SELL SCALP
Entry: 3257 – 3259
SL: 3263
TP: 3253 → 3250 → 3246 → 3242 → 3238 → 3235 → 3230 → 3220
🔴 SELL ZONE
Entry: 3278 – 3280
SL: 3284
TP: 3274 → 3270 → 3266 → 3262 → 3258 → 3254 → 3250 → 3240 → 3230
🔵 BUY SCALP
Entry: 3196 – 3194
SL: 3190
TP: 3200 → 3204 → 3208 → 3212 → 3216 → 3220
🔵 BUY ZONE (Long-Term Zone)
Entry: 3158 – 3156
SL: 3152
TP: 3162 → 3166 → 3170 → 3174 → 3178 → 3182 → 3190
⚠️ Final Notes:
Price action continues to respect the bearish channel.
BUY entries are risky at this point — every bounce is met with resistance.
Watch closely for price behavior near 3222–3206 for possible intraday reactions.
News events remain critical — any update from US-China talks or surprise Fed remarks could change the bias swiftly.
📌 As always — respect your zones. Stay reactive, not predictive. Trade safe, and let the market show its hand.
Big Bank BREAKOUT! Canara Bank Ready📉 Breakdown of the Setup:
✅ WTF CT (White Lines): 3+ confirmed touches → clean descending counter-trendline.
✅ Hidden Resistance (Dotted White Line): Clear breakout above key hidden level. Historic reaction zone.
✅ MTF Resistance (Yellow Line): Long-term resistance just above; nearing test zone (confluence resistance area ahead).
✅ Green Zone (Support/Resistance Flip):
Acted as strong support in 2024.
Fake breakdown trap ✔️
Price back above = bullish bias reinstated.
✅ Volume Surge: 124M+ on breakout candle ➕ major bullish close.

Supply-Demand Flip Play with Volume Spike📈 BHARAT DYNAMICS LTD | Supply-Demand Flip Play with Volume Spike
📅 Date: May 09, 2025
📈 Timeframe: 15-Minute
🔍 Stock: BDL (NSE)
📊 **Price Action Update (Today):**
BDL opened strong at 1455 and rallied till 1595 before slipping down from a previously tested **Supply Zone (1547.40 – 1576.00)** The intraday move witnessed a sharp bullish rally from sub-1,455 levels, only to reverse sharply from the overhead supply. This creates a textbook example of **supply rejection after a demand-driven impulse**. The candle near close reflects a high-wick bearish rejection.
🧠 **Technical Overview:**
Today’s session was a high-volatility play showcasing both demand and supply dynamics. A **Possible Demand Zone (1447.30 – 1460.90)** emerged from a sharp buying reaction, indicating strong institutional interest. The price shot up almost ₹100 points in a short span with surging volumes, testing the overhead **Retested Supply Zone**, which held firm — confirming sellers’ presence. This makes the area between **1547 and 1576** a critical resistance for future rallies. Until broken decisively, traders should remain cautious about fresh longs at higher levels.
🧩 **Chart Pattern Insight:**
BDL’s 15-min chart displays a classic **Demand-to-Supply Flip** — a rally from demand, quick run-up, and sharp rejection at a pre-marked supply. This is often referred to as a “trap move” where late buyers are caught at highs. The clean volume spike at the breakout and immediate rejection within the supply zone is a common pattern seen in smart money distribution phases. Traders can look for potential **shorting setups** if the price re-enters the supply with weak momentum or **buying opportunities near the demand zone**, only with volume confirmation.
🧱 **Support & Resistance Analysis:**
* 🔼 **Resistance (Supply Zone):** 1547.40 – 1576.00
* 🔽 **Support (Demand Zone):** 1447.30 – 1460.90
A breakout above 1576 with strong volume can invalidate the supply zone. Until then, this remains a selling area. On the downside, if the price revisits the demand zone, it may offer a low-risk buying opportunity — but only if it holds with bullish candles and rising volume.
🔍 **Volume Analysis:**
The volume surged dramatically on the rally towards the supply zone, showing panic buying or aggressive short covering. The final rejection candle also saw elevated volume, which adds weight to the **supply zone rejection thesis**. Prior candles had lower volume, indicating absorption near lows and sudden spike into resistance. This is a signature behavior of “liquidity grabs.”
📌 **Educational Insight:**
This chart provides a clean **example of how price reacts to supply and demand zones**, especially intraday. Demand zones are best used for potential long setups only after a bullish confirmation, while supply zones can be used for shorts or to exit longs. These zones act as emotional points — where institutions look to trap retail traders. For intraday traders, this scenario shows why waiting for confirmation is key before entering trades around such zones.
⚠️ **Disclaimer:**
This analysis is for educational purposes only and does not constitute any investment advice or stock recommendation. Please consult with your financial advisor before taking any trading decisions. This post complies with SEBI regulations and is intended to promote financial literacy.
