"India's Favourite Vineyard"Sula Vineyards Ltd
About
Incorporated in 2003, Sula Vineyards Limited is India's largest wine producer and seller as of March 31, 2022. The company also distributes wines under a bouquet of popular brands including "RASA," "Dindori", "The source," "Satori", "Madera" & "Dia" with its flagship brand "Sula" being the "category creator" of wine in India.
🍷 Sula Vineyards – Reversal Underway?
Weekly + Monthly Chart View:
After a long downtrend from ₹699, Sula has likely formed a double bottom around ₹250–₹260 and bounced from 0.786 Fib level. The recent higher low and breakout above the short-term falling trendline indicate a possible reversal. Momentum indicators like RSI and MACD are recovering from oversold zones.
Fundamentals from Screener.in:
FY25 Revenue: ₹595 Cr, Net Profit: ₹82 Cr
ROCE: 18.4%, ROE: 16.7%, Debt-Free
Promoter Holding: 27.3%, FIIs increased stake
Strong brand leadership in wine category
If ₹310–₹311 resistance flips to support, potential upside till ₹331 / ₹364 / ₹424 in medium term.
📌 Reversal confirmation if price holds above ₹305–310 zone.
#SulaVineyards #WineStock #BullishSetup #TechnicalBreakout #NSE #Sula
🧠 Disclaimer: For educational and research purposes only. No buy/sell advice.
📝 Chart Purpose & Disclaimer:
This chart is shared purely for educational and personal tracking purposes. I use this space to record my views and improve decision-making over time.
Investment Style:
All stocks posted are for long-term investment or minimum positional trades only. No intraday or speculative trades are intended.
⚠️ Disclaimer:
I am not a SEBI registered advisor. These are not buy/sell recommendations. Please consult a qualified financial advisor before taking any investment decision. I do not take responsibility for any profit or loss incurred based on this content.
Technicalbreakout

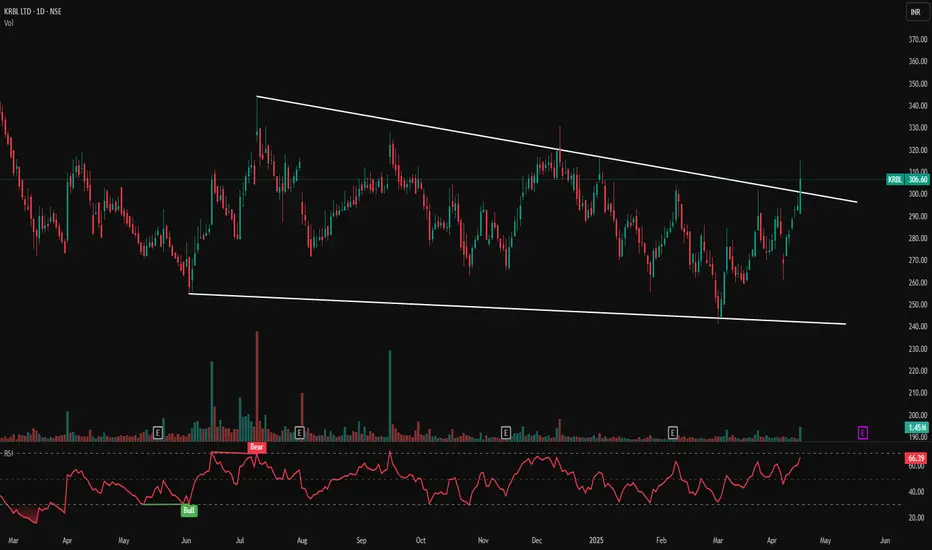
KRBL LTS- Falling Wedge Breakout | Trend Reversal Signal Ahead?KRBL LTD – Falling Wedge Breakout 💥 | Trend Reversal Signal Ahead?
📅 Published on: April 17, 2025
📈 Technical Analysis:
KRBL has shown a bullish breakout from a long-term falling wedge pattern on the daily chart — a classic reversal pattern signalling a potential upward move after prolonged consolidation. The breakout candle is supported by strong volume and a bullish RSI setup.
Pattern: Falling Wedge (Bullish)
Breakout Price: ₹306.60
Previous Resistance Line: Now acting as support
Breakout Volume: 1.45M (above average)
🧭 Key Support & Resistance Levels:
Immediate Support: ₹290
Major Support: ₹275
Immediate Resistance: ₹315
Next Resistance Zone: ₹330 – ₹345
Trendline Resistance (Broken): ₹300 (now support)
🔍 Indicators:
RSI (Relative Strength Index):
Current RSI: 66.39 — bullish, nearing overbought zone, shows strong momentum.
RSI Bullish Crossover observed in April, indicating accumulation before breakout.
🧠 Price Action Observations:
Price respected the wedge formation since March 2024.
A strong bullish candle broke above the upper wedge with conviction.
RSI confirms strength, aligning with price action breakout.
Volume surge supports the breakout's validity.
📌 Strategy (For Educational Purposes):
Entry: ₹305–310 (on retest)
Stop Loss: ₹285 (below wedge support)
Targets:
₹330
₹345
₹360+
📊 Visual Markings & Icons:
White Trendlines: Highlighting falling wedge support and resistance.
Bullish RSI Tags: Marking key bullish RSI crossovers.
Volume Spikes: Notable on breakout day.
Breakout Candle: Large green candle breaching the upper wedge line.
⚠️ Disclaimer:
This analysis is for educational and informational purposes only. Please consult your financial advisor before making any trading decisions.
MARKSANS Pharma – Is the Pullback Over? Watch for the Next Move!Hello everyone! I hope you’re all doing great! 😊 Today, I’ve got an exciting setup for you – MARKSANS PHARMA! After a period of consolidation, MARKSANS Pharma is showing signs of a potential breakout! The stock has been trading in a range between 251 (support) and 279 (resistance), and it looks like we’re finally seeing the bulls take control.
Here’s what’s happening:
The stock has recently tested the 279 resistance multiple times, and this time, it managed to break out with decent volume, signaling that the buyers are gaining strength. If this momentum continues, we could be on the verge of a strong uptrend!
Key Levels to Watch:
Short-Term Target: 279
Second Target: 305
Third Target: 330
Final Target: 357
Best Entry Zone: 251-240 (a pullback to this level could be a golden opportunity!)
Stop Loss: 217 (always manage your risk!)
Fundamental View:
MARKSANS Pharma has been posting solid quarterly earnings, with steady revenue growth driven by strong demand in key segments. The company continues to expand and capture market share, especially in emerging markets. While risks like raw material costs and competition exist, the company's financial health and growth trajectory suggest it has strong upside potential from here.
What’s Next?
As long as the price holds above the 251-240 range, the bullish momentum should continue. If we see a pullback towards this zone, it could provide another entry point before the stock moves higher.
What do you think? Will MARKSANS Pharma hit 357 soon? Drop your thoughts in the comments below!
Disclaimer: This analysis is for educational purposes only. Please trade responsibly and consult a financial advisor before making any decisions.
If you found this analysis helpful, don’t forget to like, follow, and share your thoughts in the comments below! Your support keeps me motivated to share more insights. Let’s grow and learn together—happy trading!
