INDUSTOWERINDUSTOWER is showing a positive setup with an overall bullish structure. Price is trading above all key EMAs, and the stock has been in an uptrend for some time.
It recently broke above the 430 resistance and moved up to 454, but the move didn’t sustain, likely due to short-term profit booking. Importantly, the stock found support near the 9 EMA and managed to close back above 430, which is a constructive sign.
If it forms a strong green candle from here, the probability of a fresh upside move increases.
Keep it on your watchlist for paper trading.
✅ If you like my analysis, please follow me here as a token of appreciation :)
in.tradingview.com/u/SatpalS/
📌 For learning and educational purposes only, not a recommendation. Please consult your financial advisor before investing.
Technicalchartanalysis

NACL Inds cmp 167.40 by Daily Chart viewNACL Inds cmp 167.40 by Daily Chart view
- Support Zone 150 to 160 Price Band
- Resistance Zone 174 to 184 Price Band
- Considerate Darvas Box Setup with Bullish Rounding Bottoms
- Technical Indicators seems like turning to a positive momentum

KIRLOSENGKIRLOSENG moved out of a nearly 6-month consolidation phase in November and began showing strength on the upside.
Recently, the stock broke above the resistance near 1185, followed by a healthy retest of that level, which is often seen in strong trends.
The overall market structure is bullish, with price trading above all key EMAs and consistently holding above the 20 EMA since 12th November.
If this structure sustains, the price action suggests the probability of further upside continuation.
This setup highlights the importance of structure, retest, and EMA alignment in trend-following trades.
Keep it in your watchlist.
✅ If you like my analysis, please follow me here as a token of appreciation :)
in.tradingview.com/u/SatpalS/
📌 For learning and educational purposes only, not a recommendation. Please consult your financial advisor before investing.

HLE Glascoat cmp 436.50 by Daily Chart viewHLE Glascoat cmp 436.50 by Daily Chart view
- Support Zone 406 to 433 Price Band
- Resistance Zone 467 to 494 Price Band
- Volumes in close sync with average traded quantity
- Falling Resistance Trendline Breakout seems sustained
- Darvas Box setup repeated, hope for price trend upside

Bank Nifty spot 59251.55 by Daily Chart view - Weekly UpdateBank Nifty spot 59251.55 by Daily Chart view - Weekly Update
- Support Zone 58575 to 58900 for Bank Nifty
- Resistance Zone 59550 to 59850 for Bank Nifty
- Deep rooted Fear plus Geo-Political events dampening Domestic Markets

Canara Bank cmp 154.87 seen by the Monthly Chart view since listCanara Bank cmp 154.87 seen by the Monthly Chart view since listed
- Support Zone 129 to 142 Price Band
- Resistance Zone 155 to ATH 164.22 Price Band
- Bullish Cup and Handle Breakout done above Support Zone
- Stock Price ready for New ATH beyond current ATH 164.22 level
- Double Bullish patterns of Rounding Bottom inclusive of Cup and Handle
- Basis both Technical Chart patterns, the logical target price comes to +/- 300

Sai Life Sciences cmp 921.70 by the Daily Chart view since listeSai Life Sciences cmp 921.70 by the Daily Chart view since listed
- Support Zone 865 to 895 Price Band
- Resistance Zone 923 to ATH 943 Price Band
- Volumes are regularly spiking well above the average traded quantity
- Darvas Bos Setup seems like repeated basis the current technical chart setup
- Rising Price Channels are in good sync to each other at ending and fresh new start
- Considerate Bullish Rounding Bottoms and/or Rising VCP pattern, as one may interpret
- Darvas Box Setup : Stock trending within 845 to ATH 943 price band since ATH on 25-Aug-2025

Bajaj Finance cmp 990.45 by Daily Chart viewBajaj Finance cmp 990.45 by Daily Chart view
- Support Zone 955 to 980 Price Band
- Resistance Zone 1005 to 1030 Price Band
- Bearish Head & Shoulders by neckline just above Support Zone
- IF ..... Support Zone brake then basis Bearish H&S downfall expected
- Support Zone tested, hoping it sustains, expect upside reversal by past data

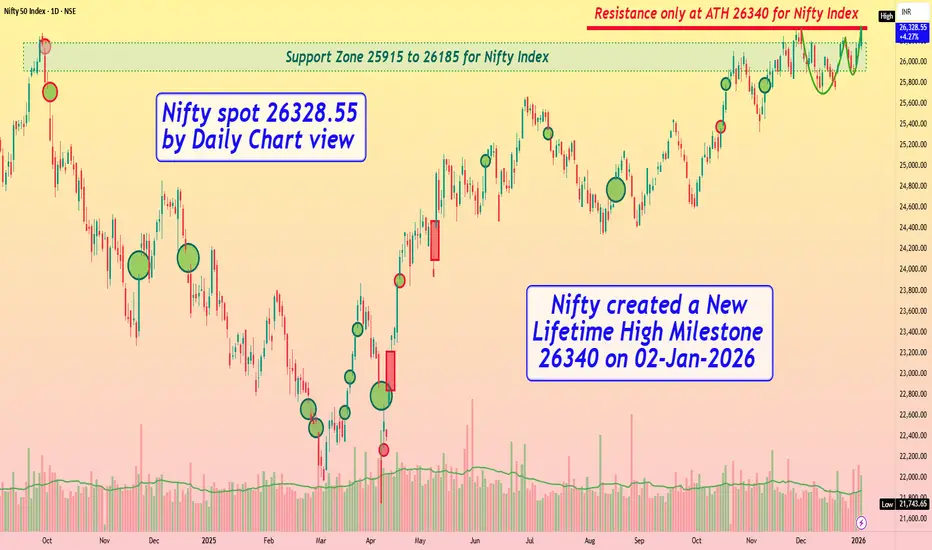
Nifty spot 26328.55 by Daily Chart view - Weekly UpdateNifty spot 26328.55 by Daily Chart view - Weekly Update
_*Nifty created a New Lifetime High Milestone 26340 on 02-Jan-2026*_
- Support Zone 25915 to 26185 for Nifty
- Resistance only at ATH 26340 for Nifty and each New ATH
- Volumes trending above avg traded quantity but with selling pressure
- Bullish Rising W formed by the neckline at previous ATH and New ATH level
- Hope to see further higher levels for the Nifty Index through the New Year 2026
Bank Nifty spot 60150.95 by Daily Chart view - Weekly UpdateBank Nifty spot 60150.95 by Daily Chart view - Weekly Update
_*Bank Nifty created a New Lifetime High Milestone 60203.75 on 02-Jan-2026*_
- Support Zone 59450 to 59750 for Bank Nifty
- Resistance only at ATH 60230.75 and each New ATH
- Volumes trending well above the average traded quantity
- Strong Bullish Bottom formed around 58650 to 58750 level
- Bullish Rounding Bottom formed by previous ATH and New ATH
- Hope to see further higher levels for Bank Nifty thru New Year 2026

PolycabPolycab is looking good.
Key EMAs have aligned, a breakout from here may give a good upside move.
Keep it in your watchlist for paper trading.
✅ If you like my analysis, please follow me here as a token of appreciation :)
in.tradingview.com/u/SatpalS/
📌 For learning and educational purposes only, not a recommendation. Please consult your financial advisor before investing.

Nifty Important LevelsNifty50
Overall structure is bullish, we may see a good move if Nifty breaks 26236 with a strong candle. First 30min candle will decide the move.
✅ If you like my analysis, please follow me here as a token of appreciation :)
in.tradingview.com/u/SatpalS/
📌 For learning and educational purposes only, not a recommendation. Please consult your financial advisor before investing.

BBOX - weekly chart analysisBBOX - The stock has gone through several pullbacks after the earlier up-move, showing that buying interest is absorbing selling pressure at higher levels.
EMAs are rising and properly aligned, and the price is holding above them, which indicates overall strength. Volatility has reduced, and recent candles are getting tighter near the resistance area.
A strong breakout with volume from this zone can start the next upward move. Till then, patience is needed, this is still a setup forming, not a confirmed breakout yet.
✅ If you like my analysis, please follow me here as a token of appreciation :)
in.tradingview.com/u/SatpalS/
📌 For learning and educational purposes only, not a recommendation. Please consult your financial advisor before investing.

Nifty 50 spot 26042.30 by Daily Chart view - Weekly UpdateNifty 50 spot 26042.30 by Daily Chart view - Weekly Update
- Nifty has closed fairly above the Support Zone
- Support Zone steadfast at 25710 to 26010 for Nifty Index
- Resistance Zone grounded at 26200 to ATH 26325.80 for Nifty Index
- Volumes have fallen well below the average traded quantity thru the week
- Falling Resistance Trendline and the Resistance Zone rejection remain intact

RACL Geartech cmp 1185.10 by Weekly Chart viewRACL Geartech cmp 1185.10 by Weekly Chart view
- Support Zone 1005 to 1115 Price Band
- Resistance Zone 1265 to 1350 Price Band
- Rising Support Trendline seems taking positive trend
- Volumes more by selling post Resistance Zone rejection
- Bullish Cup & Handle inside probable Cup & Handle (hopefully)
- Support Zone Breakout attempts are seen in the making process

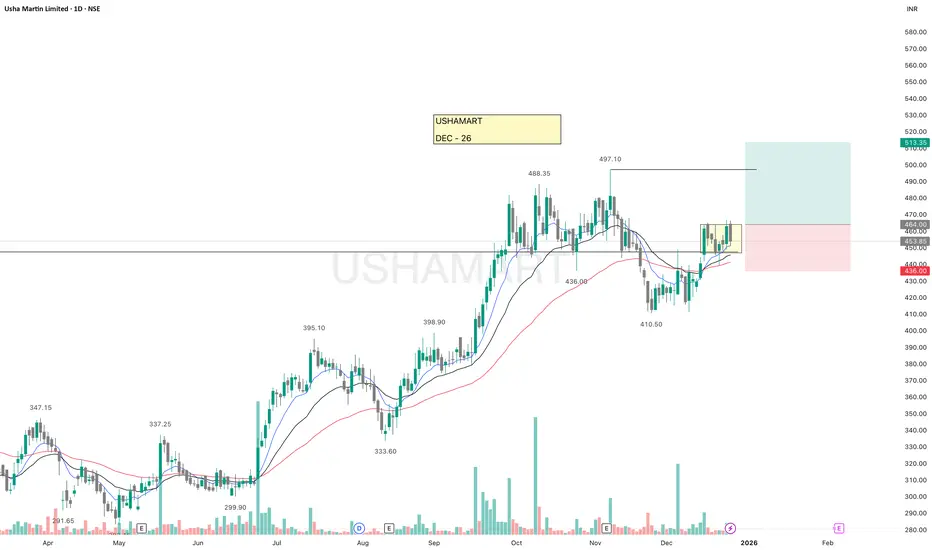
USHAMARTUSHAMART is looking good.
It recently broke above a key resistance and successfully retested the breakout zone. Since then, price has been consolidating in a tight range above all major EMAs and resistance, indicating strength.
The overall market structure remains bullish, suggesting a higher probability of further upside.
Keep this on your watchlist for paper trading and observation.
✅ If you like my analysis, please follow me here as a token of appreciation :)
in.tradingview.com/u/SatpalS/
📌 For learning and educational purposes only, not a recommendation. Please consult your financial advisor before investing.
Godawari Power GPIL cmp 250.50 by Daily Chart viewGodawari Power GPIL cmp 250.50 by Daily Chart view
* Support Zone 224 to 236 Price Band
* Resistance Zone 249 to 263 Price Band
* Support Zone tested retested since a month
* Volumes building up for Resistance Zone Breakout

RVNL cmp 319.15 by Daily Chart viewRVNL cmp 319.15 by Daily Chart view
- Support Zone 294 to 306 Price Band
- Resistance Zone 332 to 345 Price Band
- Support Zone tested retested over past few days
- Support Zone since January 2025 seems been sustained
- Volumes below avg traded quantity, need to increase for fresh upside
- Breakout from Descending Triangle pattern might be in the making process

Nifty 50 spot 25966.40 by Daily Chart view - Weekly UpdateNifty 50 spot 25966.40 by Daily Chart view - Weekly Update
- Nifty has closed within Support Zone range upper end
- Support Zone remains steady at 25710 to 26010 for Nifty Index
- Resistance Zone stands firmly at 26200 to ATH 26325.80 for Nifty Index
- Volumes synced closely with avg traded quantity over the entire past weeks
- Falling Resistance Trendline Breakout in a steady making process by weekly closure

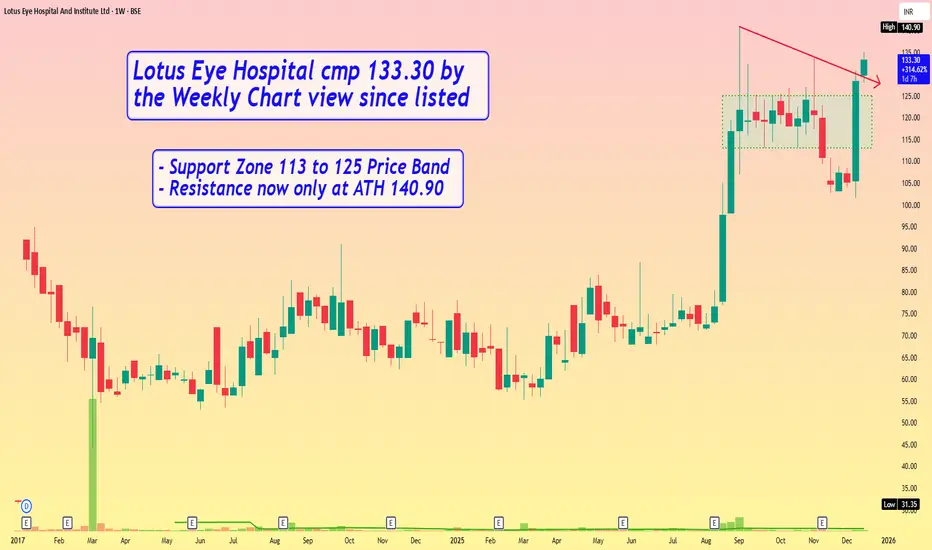
Lotus Eye Hospital cmp 133.30 by Weekly Chart view since listedLotus Eye Hospital cmp 133.30 by Weekly Chart view since listed
- Support Zone 113 to 125 Price Band
- Resistance now only at ATH 140.90
IRIS Clothing cmp 35.66 by Weekly Chart viewIRIS Clothing cmp 35.66 by Weekly Chart view
- Support Zone 28 to 31 Price Band
- Resistance Zone 36.50 to ATH 40.71 Price Band
- Volumes above average traded quantity over past 2 weeks
- Darvas Box - Price trending between 30 to 35.50 since June 2025
- Long Bullish Rounding Bottom followed by small one's made within Darvas Box

Bank Nifty spot 59389.95 by the Daily Chart viewBank Nifty spot 59389.95 by the Daily Chart view
- Support Zone intact at 58850 to 59375 for Bank Nifty
- Resistance Zone stands tall at 59825 to ATH 60114.30 for Bank Nifty
- Volumes keeping stable under avg traded quantity over past few days
- Falling Resistance Trendline Breakout attempts seem in the making process

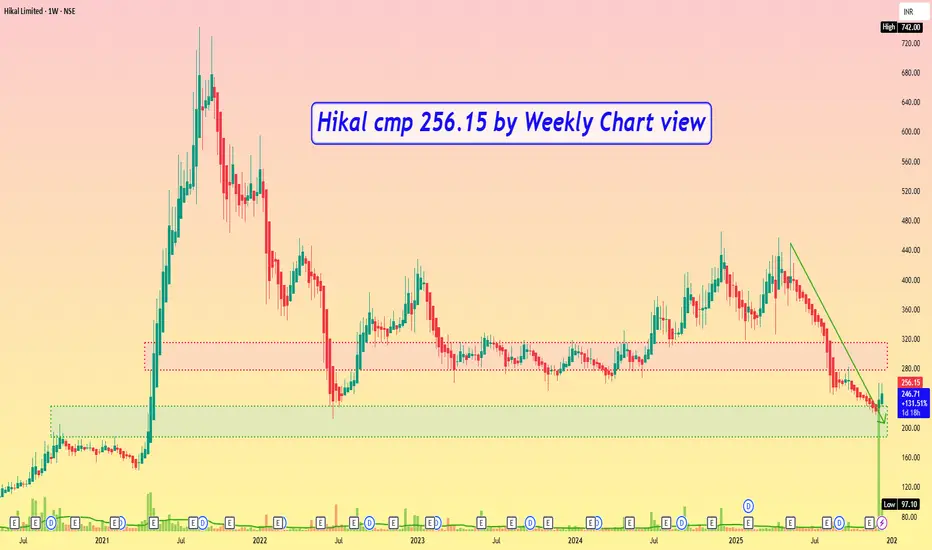
Hikal cmp 256.15 by Weekly Chart viewHikal cmp 256.15 by Weekly Chart view
- Support Zone 188 to 229 Price Band
- Resistance Zone 278 to 315 Price Band
- Support tested retested over past 4 weeks
- Falling Resistance Trendline Breakout done
- Volumes surge by demand based buying in last 2 weeks