NATIONALUMNATIONALUM is looking good. A breakout from the current levels could open the door for an up-move.
It recently broke an old resistance, then started moving in a range and showing strength.
Keep it in your watchlist for paper trading.
✅ If you like my analysis, please follow me here as a token of appreciation :)
in.tradingview.com/u/SatpalS/
📌 For learning and educational purposes only, not a recommendation. Please consult your financial advisor before investing.
Technicalchartanalysis

Inventurus Knowledge cmp 1696 by Daily Chart view since listedInventurus Knowledge cmp 1696 by Daily Chart view since listed
- Support Zone 1475 to 1575 Price Band
- Resistance Zone 1755 to 1855 Price Band
- Falling Price Channel Breakout well sustained
- Resistance Zone Breakout maybe decently expected
- Rising Price Channel Uptrend momentum going firmly
- Volumes are in close sync with average traded quantity
- Bullish Rounding Bottoms or considerate Cup and Handle don

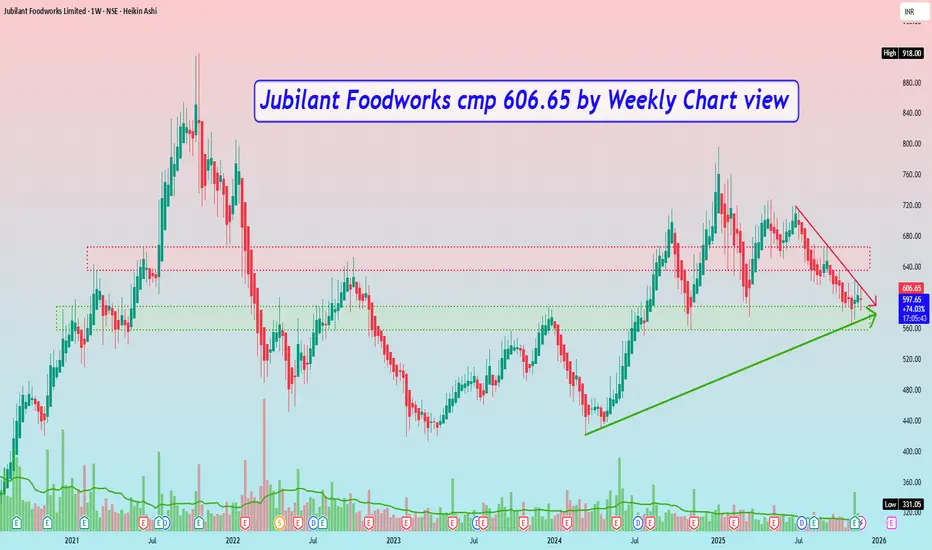
Jubilant Foodworks cmp 606.65 by Weekly Chart viewJubilant Foodworks cmp 606.65 by Weekly Chart view
- Weekly Support Zone 558 to 588 Price Band
- Weekly Resistance Zone 635 to 665 Price Band
- Volumes in close sync with average traded quantity
- Support Zone been tested retested over past few days
- Rising Support Trendline shouldering up-trending price move
- Falling Resistance Trendline tested retested by Breakout attempts
RR Kabel cmp 1420 by Weekly Chart view since listedRR Kabel cmp 1420 by Weekly Chart view since listed
- Support Zone 1285 to 1350 Price Band
- Resistance Zone 1525 to 1600 Price Band
- Resistance Zone Breakout in the making process

M&MM&M looks strong, if it sustains this price zone, there’s a good probability of an upside move.
The market structure is bullish, and price is trading above all key EMAs, supporting a continuation bias.
Keep it on your watchlist for paper trading.
✅ If you like my analysis, please follow me here as a token of appreciation :)
in.tradingview.com/u/SatpalS/
📌 For learning and educational purposes only, not a recommendation. Please consult your financial advisor before investing.

MAHLIFE (Mahindra Lifespace)MAHLIFE looks strong, it gave a breakout and then retested the zone.
If price sustains at the current level, there’s a good probability of an upside move.
Always use a stop-loss, even during paper trading, it helps build disciplined habits.
Keep it on your watchlist for paper trading.
✅ If you like my analysis, please follow me here as a token of appreciation :)
in.tradingview.com/u/SatpalS/
📌 For learning and educational purposes only, not a recommendation. Please consult your financial advisor before investing.

SYRMASYRMA has given a breakout with strong volume, and if it sustains near current levels, there’s a good probability of further upside.
Price is trading above all key EMAs, and the overall market structure also looks bullish, supporting the continuation move.
Keep it on your watchlist for paper trading.
✅ If you like my analysis, please follow me here as a token of appreciation :)
in.tradingview.com/u/SatpalS/
📌 For learning and educational purposes only, not a recommendation. Please consult your financial advisor before investing.

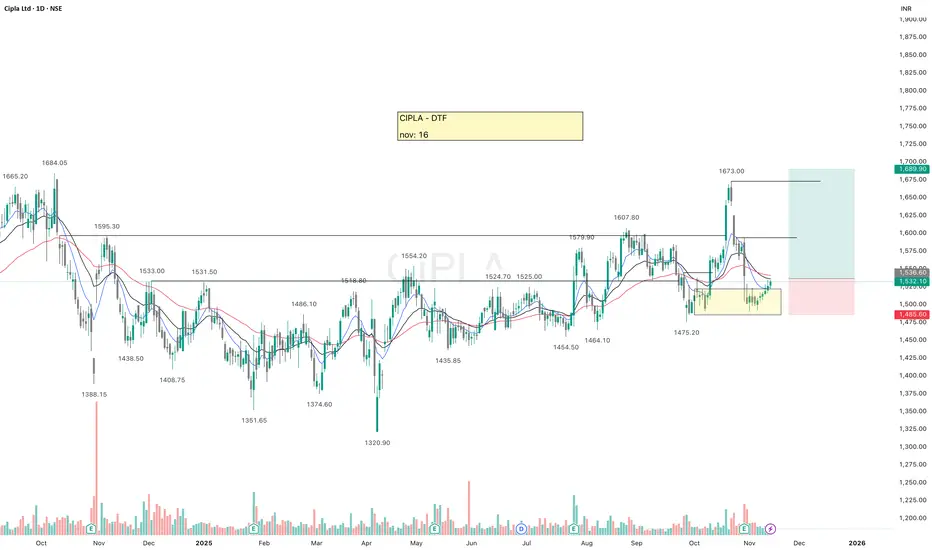
CIPLACIPLA looks strong, a breakout from this zone could trigger an upside move.
Price has already broken the previous resistance and retraced back to the 1500 zone, yet it didn’t break the previous swing low.
It’s consistently forming higher highs-higher lows, and steady volume is supporting each small candle, a sign of controlled accumulation and bullish intent.
Keep it in your watchlist for paper trading.
✅ If you like my analysis, please follow me here as a token of appreciation :)
in.tradingview.com/u/SatpalS/
📌 For learning and educational purposes only, not a recommendation. Please consult your financial advisor before investing.
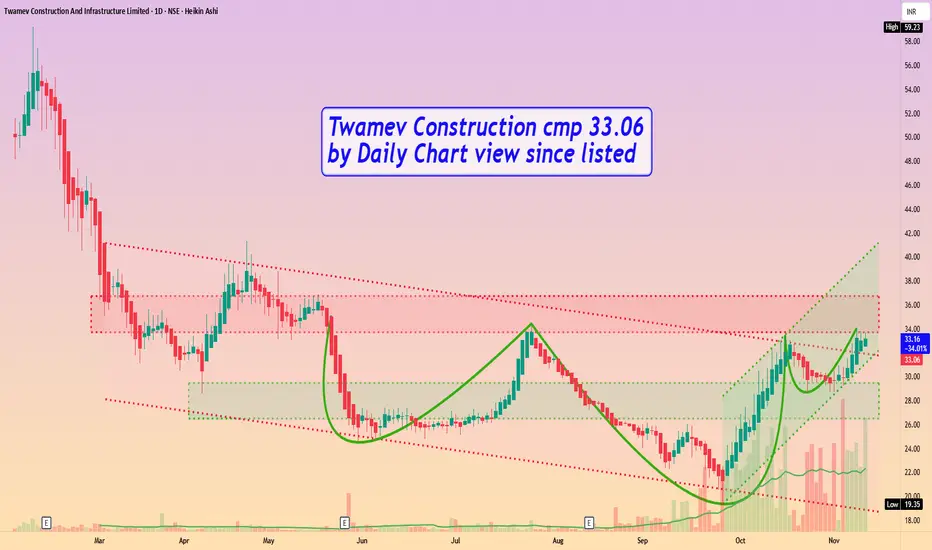
Twamev Construction cmp 33.06 by Daily Chart view since listedTwamev Construction cmp 33.06 by Daily Chart view since listed
- Support Zone 26.50 to 29.50 Price Band
- Resistance Zone 33.75 to 36.75 Price Band
- Back to back Bullish Rounding Bottom patterns
- Strong Uptrend momentum seen with Rising Price Channel
- Falling Price Channel Breakout done by the demand based buying
- Heavy Volumes enabled Breakout attempts observed from Resistance Zone
BANK NIFTY - Technical Analysis Bank Nifty is showing an interesting setup on the weekly chart.
After breaking out above its previous all-time high, the index has started contracting in a tight range, indicating healthy consolidation.
On the daily timeframe, it continues to take support near the 9 EMA, and during minor dips, it has also reversed from the 20 EMA, reflecting strong buying interest.
If Bank Nifty breaks out of this range with momentum, the upside potential remains open, sky’s the limit.
In case of a pullback, watch these key support zones:
🟩 57,500 – first immediate support
🟩 57,160 – secondary support
🟩 56,600 – third support
🟩 56,000 – major support zone if deeper retracement occurs
Overall market structure is Bullish, and a bit more consolidation or a short pullback will only strengthen the base for a sustained breakout.
✅ If you like my analysis, please follow me here as a token of appreciation :)
in.tradingview.com/u/SatpalS/
📌 For learning and educational purposes only, not a recommendation. Please consult your financial advisor before investing.

NIFTY - Technical analysisNIFTY gave breakout of the range and then retested the same, took support at 50ema and gave reversal.
Now there is probability of going towards 26104 and then crossing 26277, overall setup is Bullish.
Today there was gap up so in between it may fill this gap.
✅ If you like my analysis, please follow me here as a token of appreciation :)
in.tradingview.com/u/SatpalS/
📌 For learning and educational purposes only, not a recommendation. Please consult your financial advisor before investing.

Onmobile Global cmp 73.96 by Weekly Chart viewOnmobile Global cmp 73.96 by Weekly Chart view
- Support Zone 62 to 68 Price Band
- Resistance Zone 78 to 85 Price Band
- Bullish Rounding Bottom under Resistance Zone
- 1st Falling Resistance Trendline seems well sustained
- Next hurdles are Dotted Falling Resistance Trendline and Resistance Zone
- Volumes needed to provide fresh upside to give breakout above the Resistance
- Stock price trending well with positive technical indicators EMA, MACD, RSI, SAR, SuperTrend

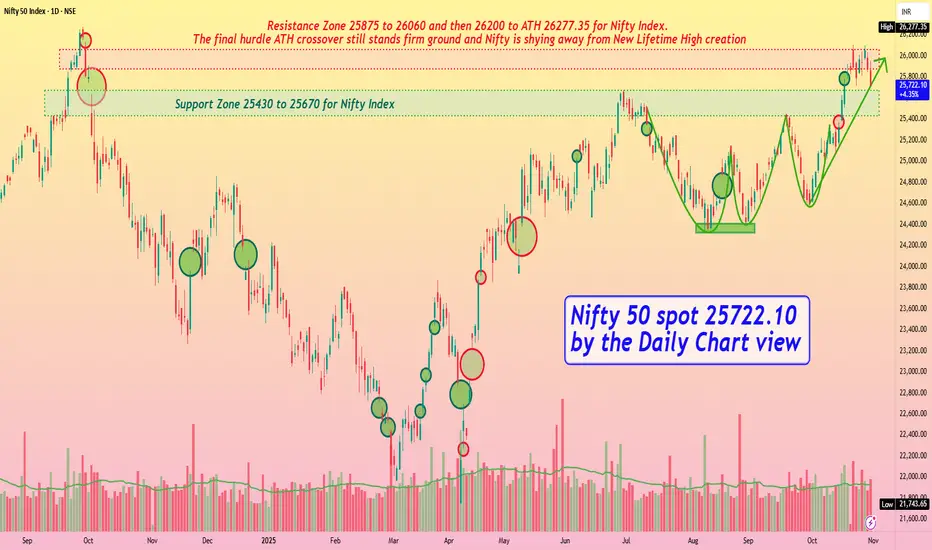
Nifty 50 spot 25722.10 by the Daily Chart view - Weekly UpdateNifty 50 spot 25722.10 by the Daily Chart view - Weekly Update
- Support Zone 25430 to 25670 for Nifty Index
- Rising Support Trendline seems in active mode but may be broken
- Nifty below Resistance Zone but taking rest tad above the Support Zone
- Resistance Zone 25875 to 26060 and then 26200 to ATH 26277.35 for Nifty Index
- Bullish Rounding Bottoms seems active but continued skepticism keeping the Nifty index weak
- The final hurdle ATH crossover still stands ground and Nifty shying away from New Lifetime High creation
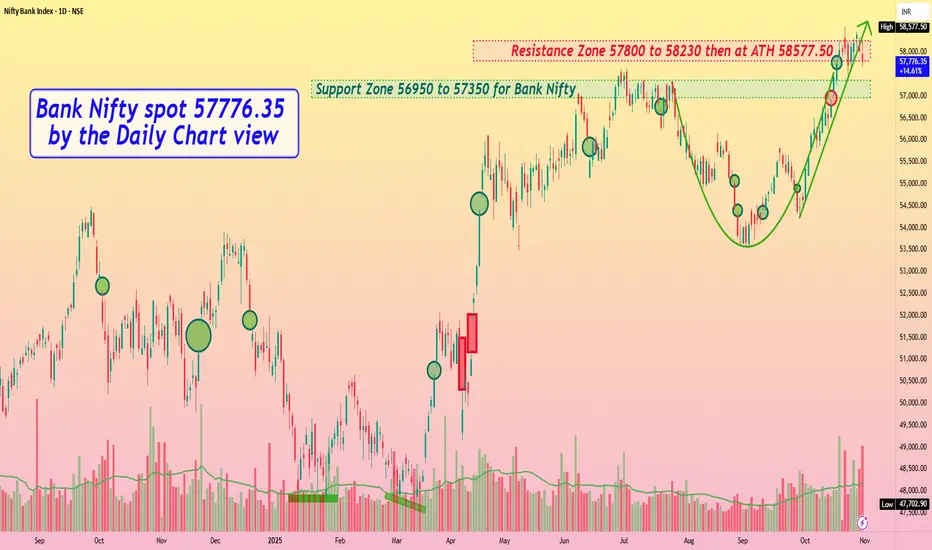
Bank Nifty spot 57776.35 by Daily Chart view - Weekly UpdateBank Nifty spot 57776.35 by Daily Chart view - Weekly Update
- Support Zone 56950 to 57350 for Bank Nifty
- Resistance Zone 57800 to 58230 then at ATH 58577.50
- Bank Nifty sustaining tad below Resistance Zone but above Support Zone
- Rising Support Trendline has been broken and bit of weakness seems prevailing
- Bullish Rounding Bottom seems active but for the sustained skepticism in general
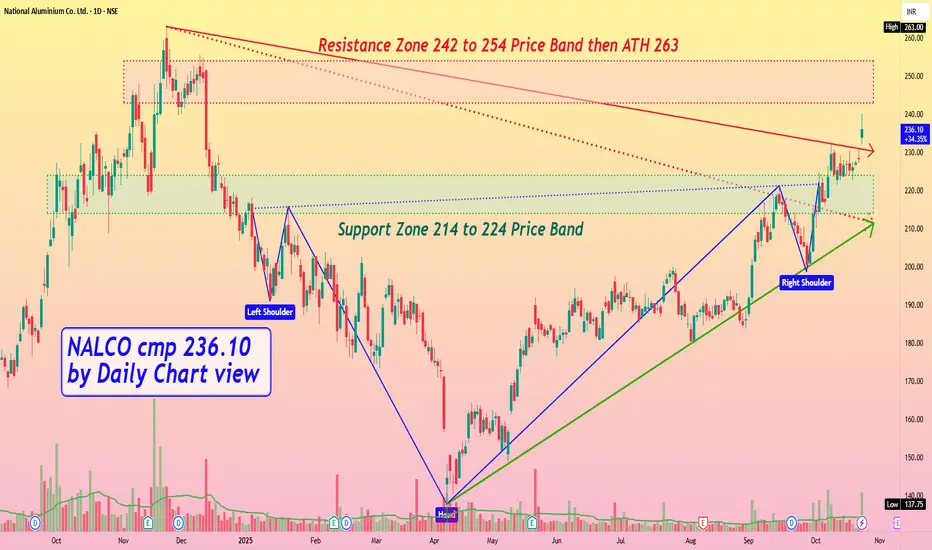
NALCO cmp 236.10 by Daily Chart viewNALCO cmp 236.10 by Daily Chart view
- Support Zone 214 to 224 Price Band
- Resistance Zone 242 to 254 Price Band then ATH 263
- Bullish Head & Shoulders completed by Support Zone neckline
- Dotted Falling Resistance Trendline Breakout has well sustained
- Falling Resistance Trendline Breakout attempted and work in progress
- Volumes spiking intermittently over past few days by close sync with avg traded qty
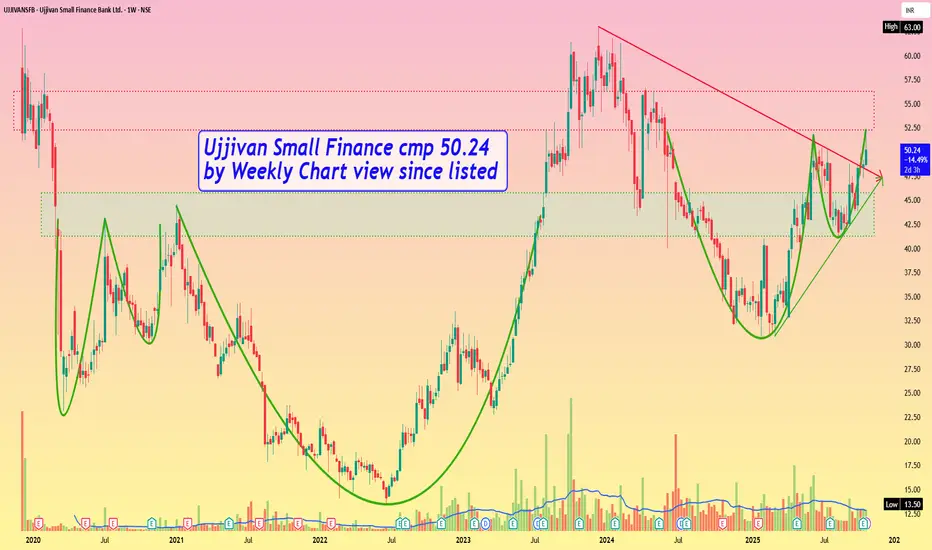
Ujjivan Small Finance cmp 50.24 by Weekly Chart view since listeUjjivan Small Finance cmp 50.24 by Weekly Chart view since listed
- Support Zone 41.25 to 45.75 Price Band
- Resistance Zone 52.25 to 56.25 Price Band
- Bullish Cup & Handle formed by Resistance Zone neckline
- Volumes spiking intermittently by a close sync with avg traded qty
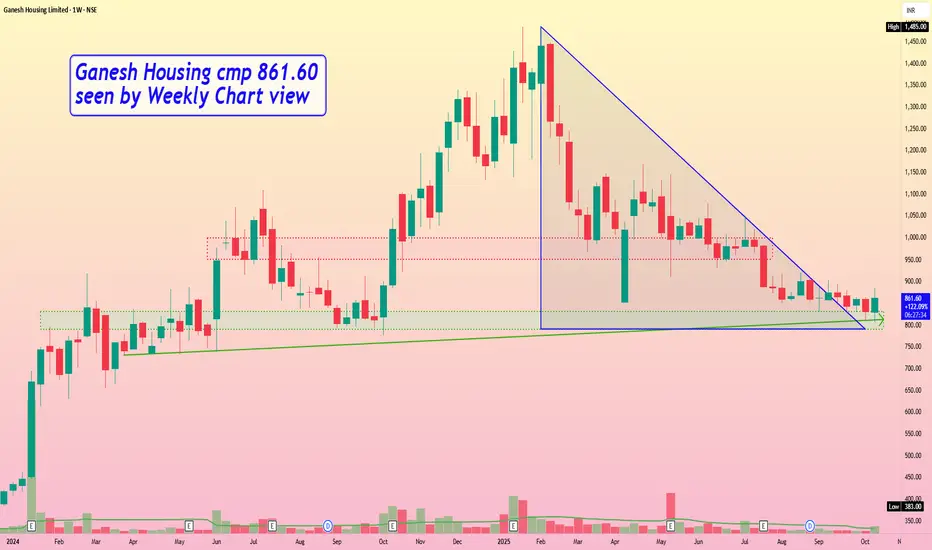
Ganesh Housing cmp 861.60 by Weekly Chart viewGanesh Housing cmp 861.60 by Weekly Chart view
- Support Zone 790 to 830 Price Band
- Resistance Zone 950 to 1000 Price Band
- Descending Triangle Breakout in the making process
- Support Zone seems tested retested over the past few weeks
- Volumes are flat, need to increase for fresh upside price movement
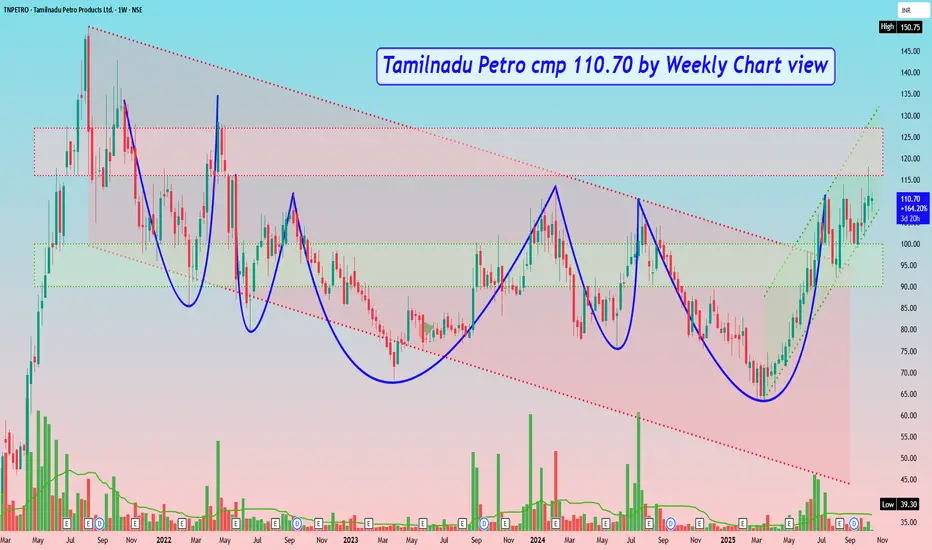
Tamilnadu Petro cmp 110.70 by Weekly Chart viewTamilnadu Petro cmp 110.70 by Weekly Chart view
- Weekly basis : Support Zone 90 to 100 Price Band
- Weekly basis : Resistance Zone 116 to 127 Price Band
- Multiple Bullish Rounding Bottoms around Support Zone and by Resistance Zone neckline
- Price was traversing in Falling Parallel Price Channel then took Breakout moving in Rising Parallel Price Channel
- Subject to the Resistance Zone Breakout and closure sustained above it for few days, may anticipate for fresh upside probability
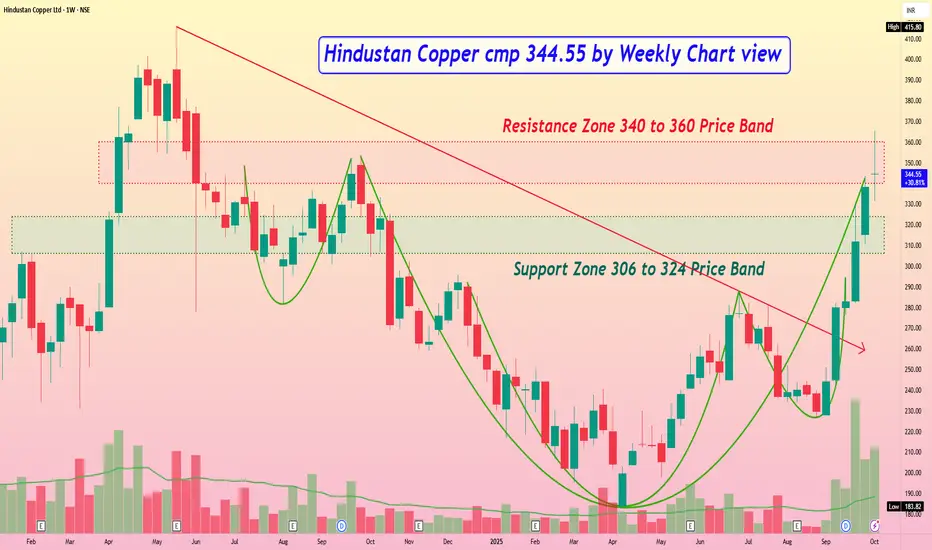
Hindustan Copper cmp 344.55 by Weekly Chart viewHindustan Copper cmp 344.55 by Weekly Chart view
- Support Zone 306 to 324 Price Band
- Resistance Zone 325 to 337 Price Band
- Falling Resistance Trendline Breakout is well sustained
- Bullish Rounding Bottom formed by Resistance Zone neckline
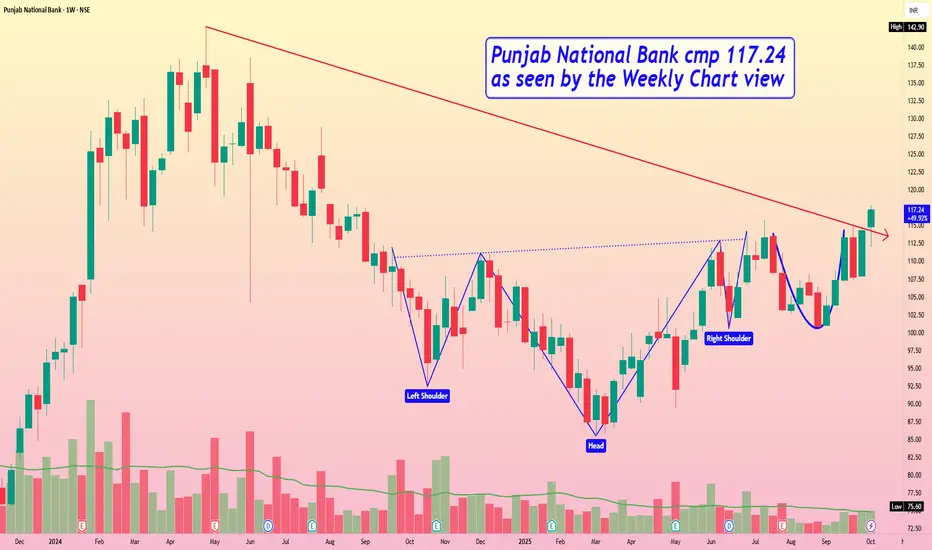
Punjab National Bank cmp 117.24 by Weekly Chart viewPunjab National Bank cmp 117.24 by Weekly Chart view
- Weekly basis Support levels seen at 107 > 98 > 87
- Weekly basis Resistance levels at 124 > 133 > ATH 142.90
- Bullish Head & Shoulders followed by Rounding Bottoms formed
- Volumes seen getting in close sync with the average traded quantity
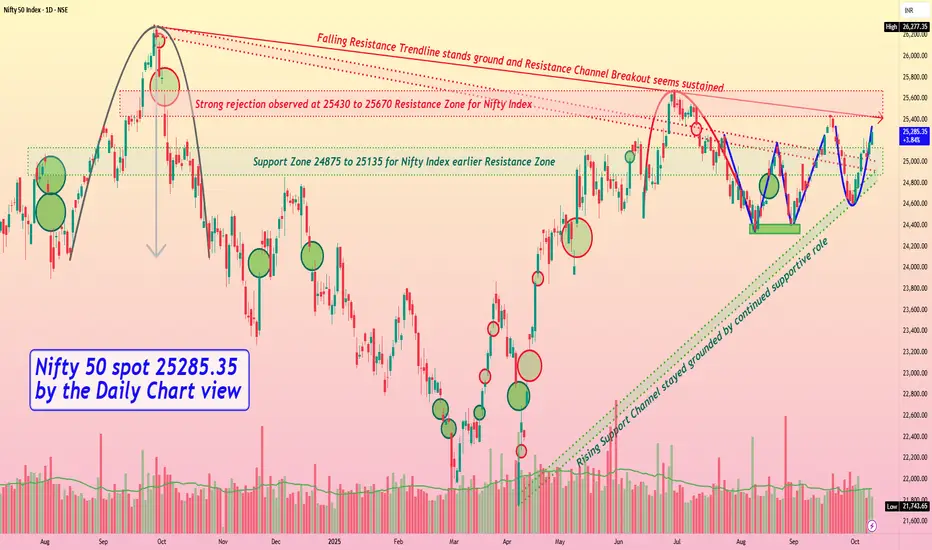
Nifty 50 spot 25285.35 by the Daily Chart view - Weekly updateNifty 50 spot 25285.35 by the Daily Chart view - Weekly update
- Support Zone 24875 to 25135 for Nifty Index earlier Resistance Zone
- Rising Support Channel stayed grounded by continued supportive role
- Strong rejection observed at 25430 to 25670 Resistance Zone for Nifty Index
- Falling Resistance Trendline stands ground and Resistance Channel Breakout seems sustained
- Bullish Technical patterns of "W" Double Bottom followed by Rounding Bottom formed around Support Zone
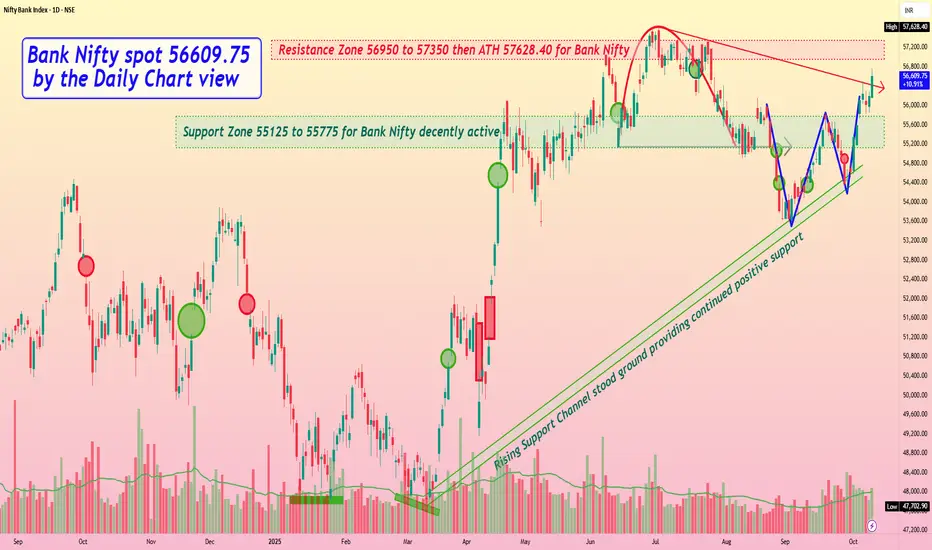
Bank Nifty spot 56609.75 by the Daily Chart view - Weekly updateBank Nifty spot 56609.75 by the Daily Chart view - Weekly update
- Support Zone 55125 to 55775 for Bank Nifty decently active
- Resistance Zone 56950 to 57350 then ATH 57628.40 for Bank Nifty
- Falling Resistance Trendline Breakout seems in the making for uptrend
- Rising Support Channel stood ground and provided steady positive support
- Bullish Rising W pattern done and well sustained by current trending momentum
- Support Zone tested and tested over the past full week, indicating probable positive trend
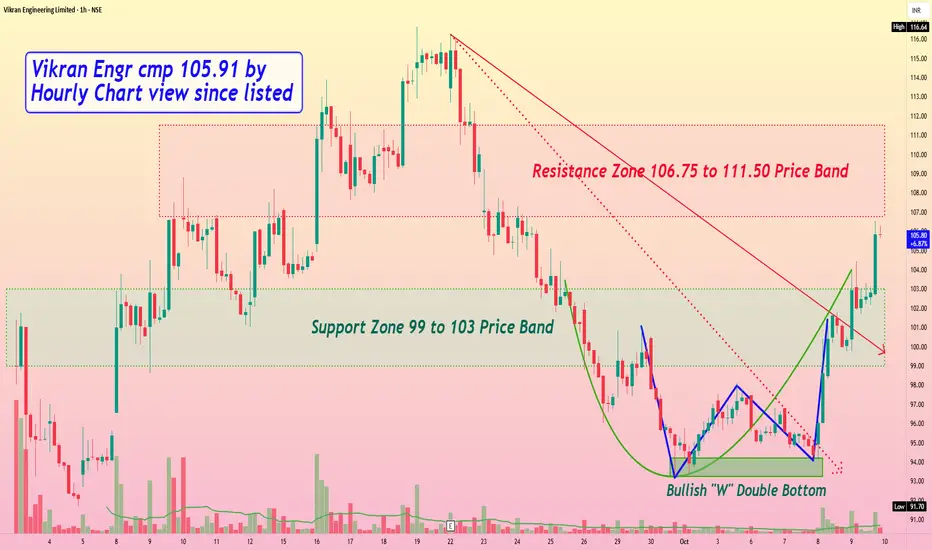
Vikran Engineering cmp 105.91 by Hourly Chart view since listedVikran Engineering cmp 105.91 by Hourly Chart view since listed
- Support Zone 99 to 103 Price Band
- Resistance Zone 106.75 to 111.50 Price Band
- Volumes are spiking well above avg traded quantity over past few days
- Subject to closure above Resistance Zone for few days, New ATH maybe anticipated
- Stock has formed bullish technical chart setup with Rounding Bottom and W Double Bottom