Blackbuck cmp 670.70 by Daily Chart viewBlackbuck cmp 670.70 by Daily Chart view
- Support Zone 625 to 643 Price Band
- Resistance Zone 670 to 694 Price Band
- Volumes in good sync with avg traded quantity
- Falling Resistance Trendline Breakout seem attempted
- Both of the Rising Support Trendline are well respected
- Bullish Rounding Bottoms under Resistance Zone neckline
Technicalchartpatterns

Kirloskar Brothers cmp 1647.20 by Daily Chart viewKirloskar Brothers cmp 1647.20 by Daily Chart view
- Support Zone 1510 to 1610 Price Band
- Resistance Zone 1760 to 1860 Price Band
- Support Zone tested retested over past 2 weeks
- Support Zone sustained thou price dipped below 3 times
- Volumes synced with avg traded qty with heavy spikes too
- Rising Support Trendline since May 2024 seems well respected

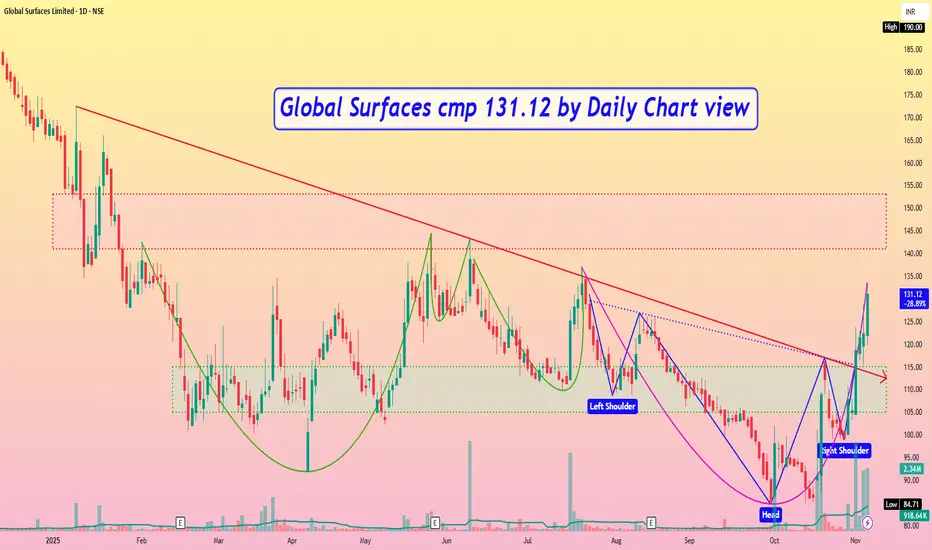
Global Surfaces cmp 131.12 by Daily Chart viewGlobal Surfaces cmp 131.12 by Daily Chart view
- Support Zone 105 to 115 Price Band
- Resistance Zone 141 to 153 Price Band
- Multiple Bullish Technical Chart patterns done
- Falling Resistance Trendline Breakout well sustained
- Majority of Technical Indicators seen trending positively
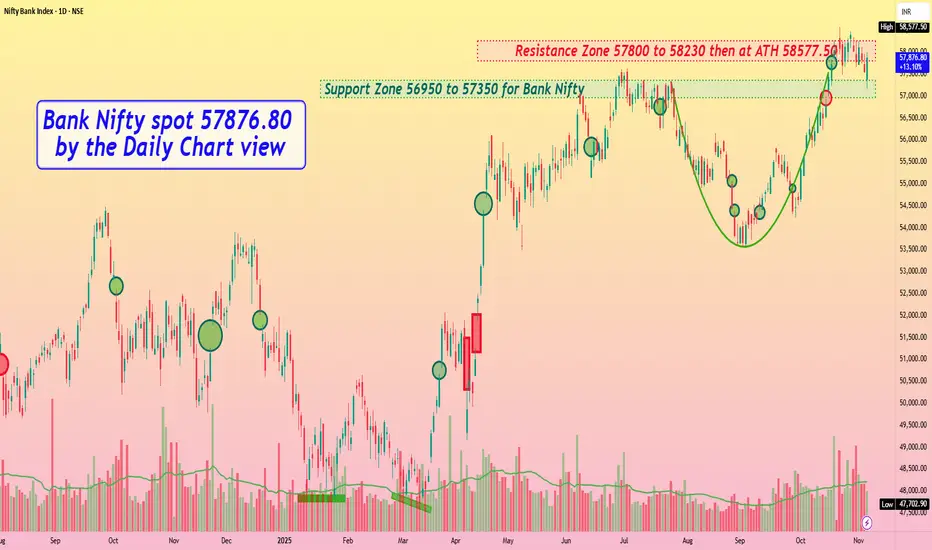
Bank Nifty spot 57876.80 by Daily Chart view - Weekly updateBank Nifty spot 57876.80 by Daily Chart view - Weekly update
- Support Zone 56950 to 57350 for Bank Nifty
- Resistance Zone 57800 to 58230 then at ATH 58577.50
- Bank Nifty sustaining between Support and Resistance Zones over 2 weeks
- Bullish Rounding Bottom still in active mode against the weak sentiments in general
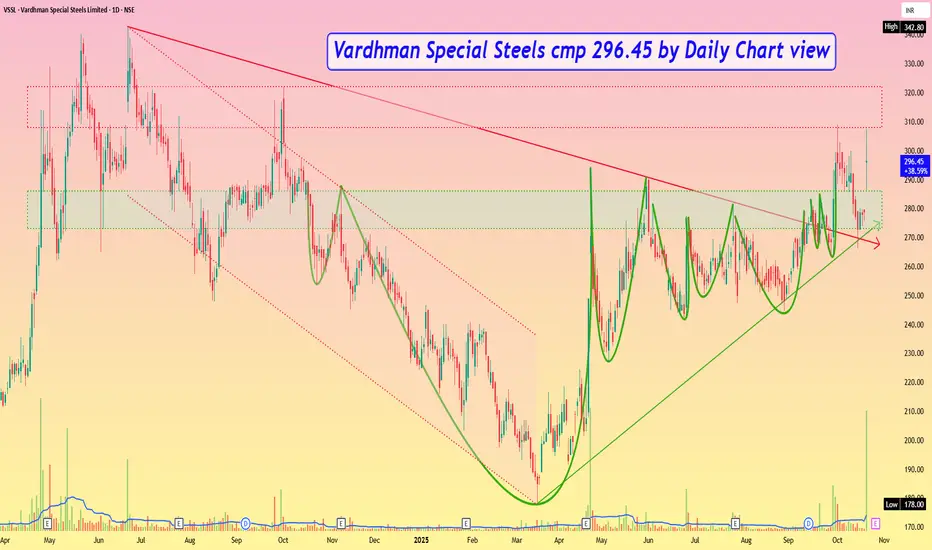
Vardhman Special Steels cmp 296.45 by Daily Chart viewVardhman Special Steels cmp 296.45 by Daily Chart view
- Support Zone 273 to 286 Price Band
- Resistance Zone 308 to 322 Price Band
- Falling Resistance Trendline Breakout well sustained
- Rising Support Trendline well respected by continued uptrend
- Support Zone tested, broken, retested by fresh breakout probability
- Volume surging intermittently over past few days, in close sync with avg traded quantity
- Considerate Head & Shoulders with multiple Rounding Bottoms formed around Support Zone neckline
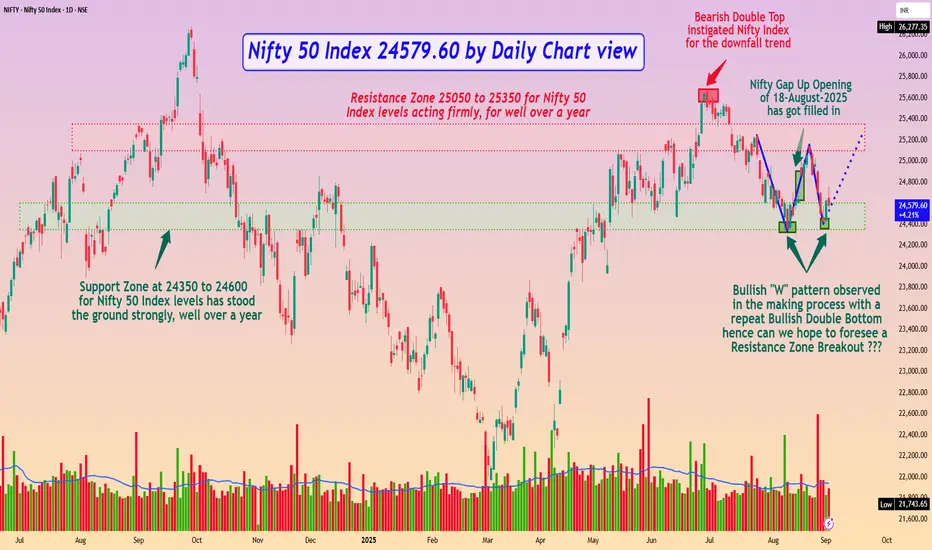
Nifty 50 Index 24579.60 by Daily Chart viewNifty 50 Index 24579.60 by Daily Chart view
- Nifty Gap Up Opening of 18-August-2025 has got filled in
- Bearish Double Top instigated Nifty Index for the downfall trend
- Resistance Zone 25050 to 25350 for Nifty 50 Index levels acting firmly, for well over a year
- Support Zone at 24350 to 24600 for Nifty 50 Index levels has stood the ground strongly, well over a year
- Bullish "W" pattern observed in the making process with a repeat Bullish Double Bottom hence can we hope to foresee a Resistance Zone Breakout ???
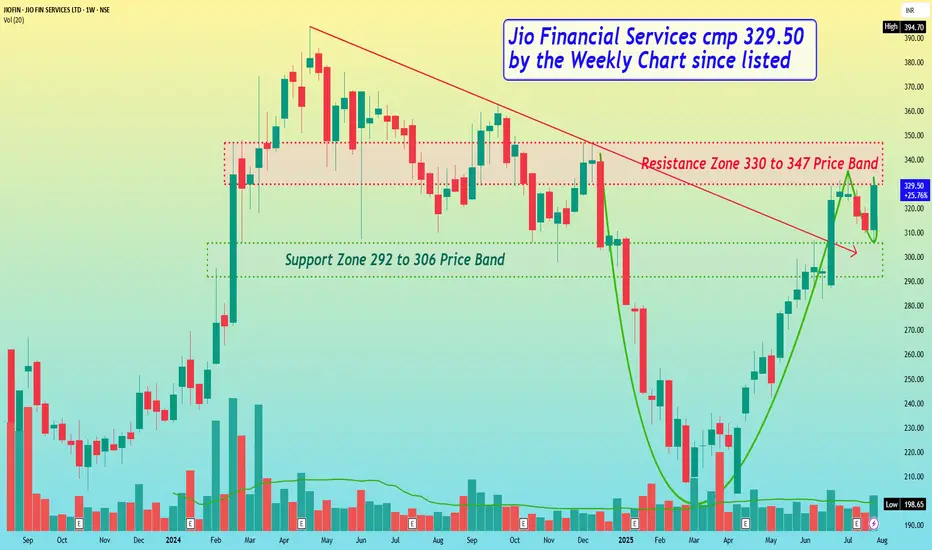
Jio Financial Services cmp 329.50 by the Weekly Chart since listJio Financial Services cmp 329.50 by the Weekly Chart since listed
* Support Zone 292 to 306 Price Band
* Resistance Zone 330 to 347 Price Band
* Price Breakout from Falling Resistance Trendline
* Volumes getting in sync with average traded quantity
* Bullish Cup and Handle done with Resistance Zone neckline
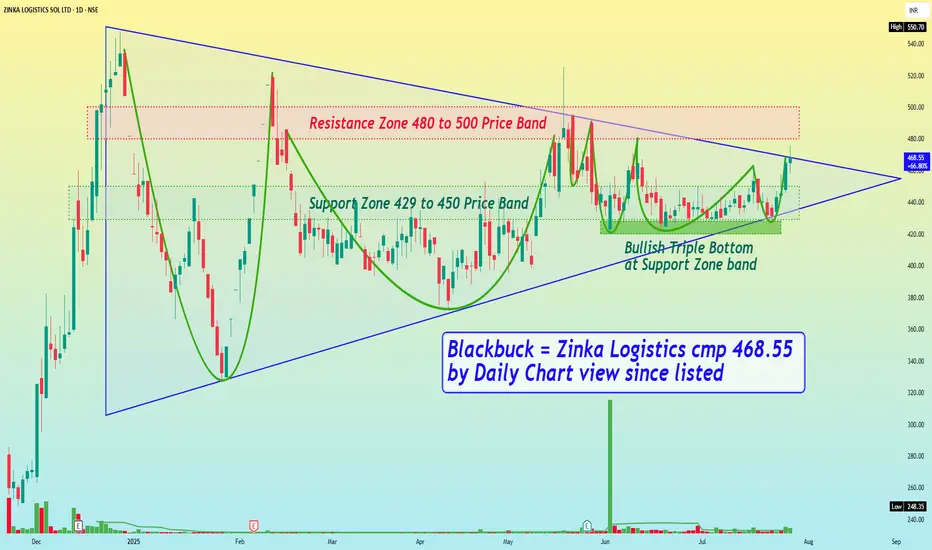
Blackbuck = Zinka Logistics cmp 468.55 by Daily Chart view sinceBlackbuck = Zinka Logistics cmp 468.55 by Daily Chart view since listed
- Support Zone 429 to 450 Price Band
- Resistance Zone 480 to 500 Price Band
- Symmetrical Triangle Breakout been attempted
- Closely considerate VCP pattern formation seems done
- Volumes are in close sync with the average traded quantity
- Technical Indicators BB, EMA, MACD, RSI, SAR showing positive trend
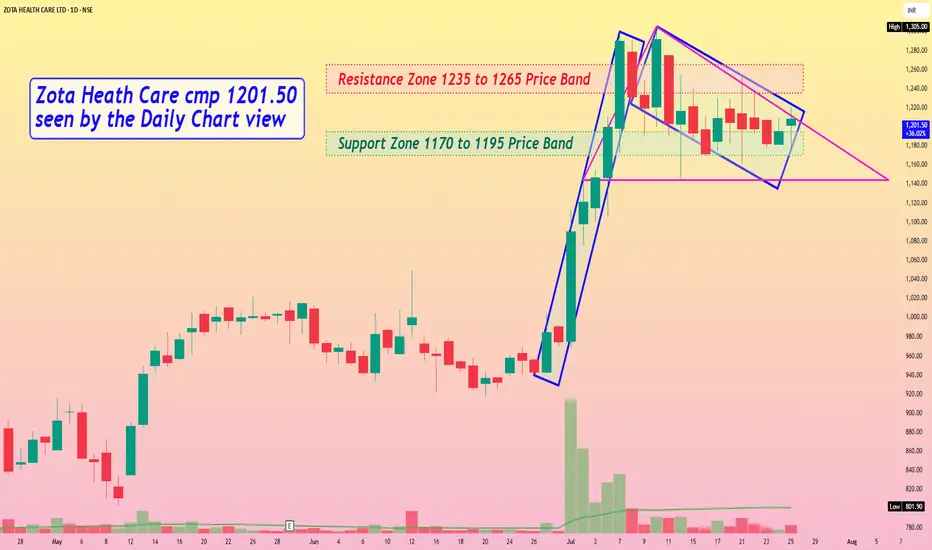
Zota Heath Care cmp 1201.50 seen by the Daily Chart viewZota Heath Care cmp 1201.50 seen by the Daily Chart view
- Support Zone 1170 to 1195 Price Band
- Resistance Zone 1235 to 1265 Price Band
- Volumes are steady need to increase for fresh upside
- Stock seems testing retesting Support Zone price band
- Bullish Pole and Flag pattern seem done after hitting ATH level
- Symmetrical Triangle Pattern too seems formed after ATH level
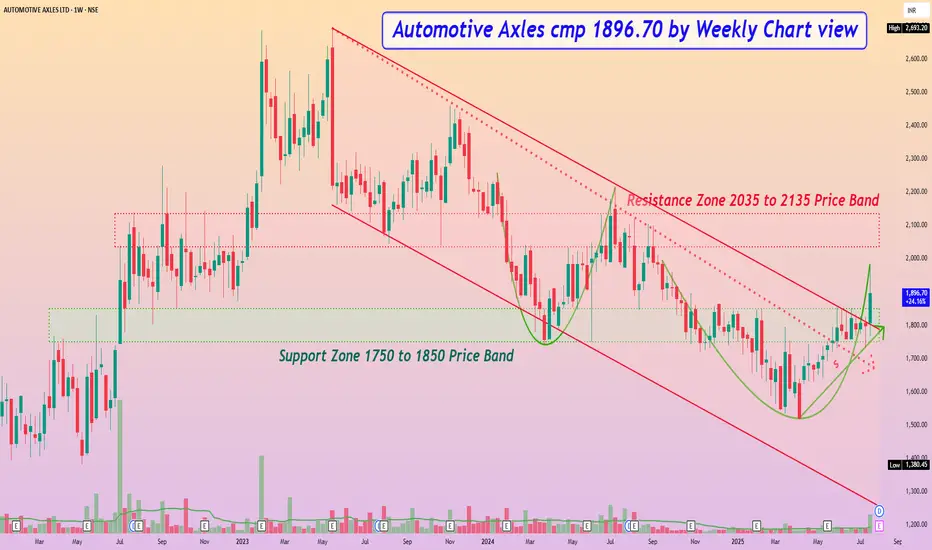
Automotive Axles cmp 1896.70 by Weekly Chart viewAutomotive Axles cmp 1896.70 by Weekly Chart view
- Support Zone 1750 to 1850 Price Band
- Resistance Zone 2035 to 2135 Price Band
- Falling Resistance Channel and Trendline Breakout well sustained
- Volumes surged by good demand based buying over the last week
- Bullish Rounding Bottom formed under the Resistance Zone price band
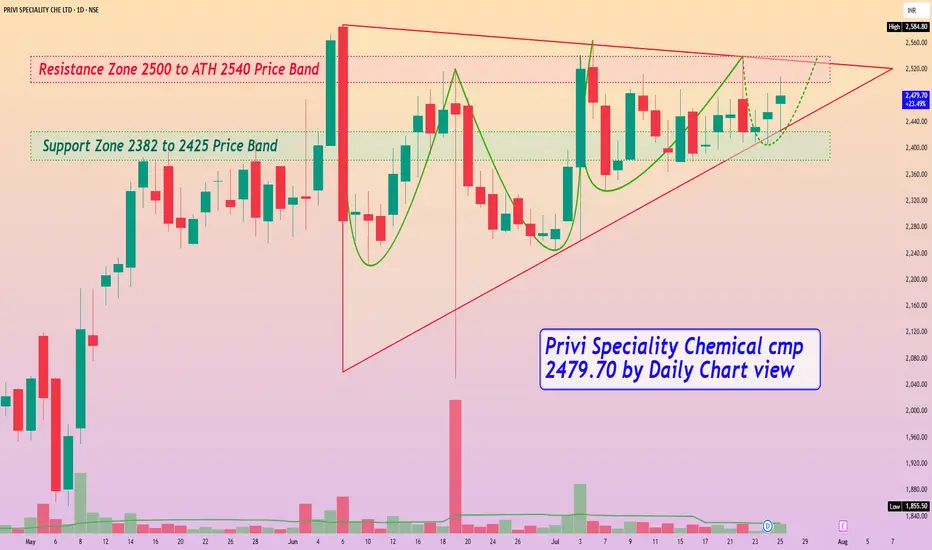
Privi Speciality Chemical cmp 2479.70 by Daily Chart viewPrivi Speciality Chemical cmp 2479.70 by Daily Chart view [/ b]
- Support Zone 2382 to 2425 Price Band
- Resistance Zone 2500 to ATH 2540 Price Band
- Ascending Triangle pattern Breakout in the making process
- Very considerate VCP pattern seems formed on the stock chart
- Volumes seen getting in close sync with the average traded quantity
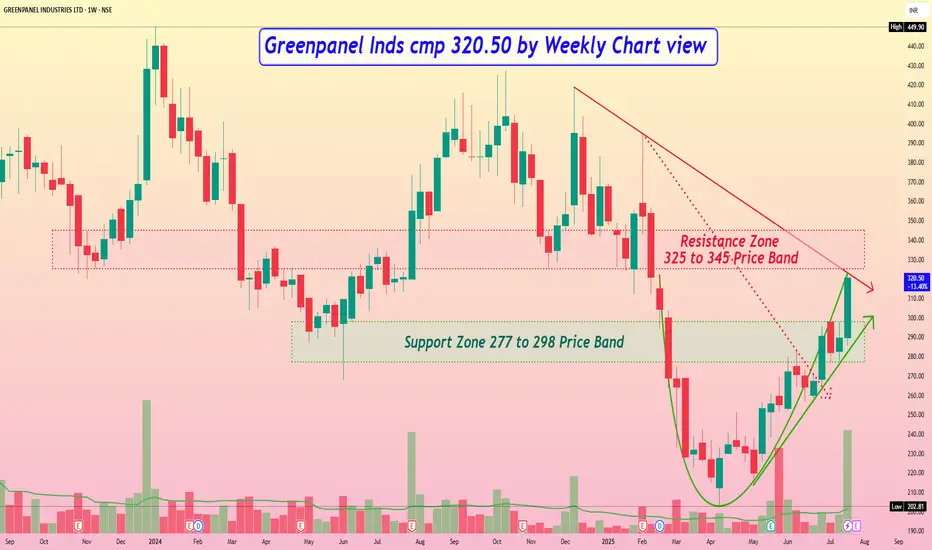
Greenpanel Inds cmp 320.50 by Weekly Chart viewGreenpanel Inds cmp 320.50 by Weekly Chart view
- Support Zone 277 to 298 Price Band
- Resistance Zone 325 to 345 Price Band
- Bullish Rounding Bottom with Resistance Zone neckline
- Rising Support Trendline seems well respected by price momentum
- Volumes have surged very heavily over past week by demand based buying
- 1st Falling Resistance Trendline Brake out done and 2nd Trendline Breakout attempted
- Most common Technical Indicators like BB, EMA, MACD, RSI, SAR are showing positive trend
Paisalo Digital cmp 31.80 by Weekly Chart viewPaisalo Digital cmp 31.80 by Weekly Chart view
- Support Zone 27.50 to 30.50 Price Band
- Resistance Zone 39.50 to 42.50 Price Band
- Rising Support Trendline and Support Zone both are well respected
- Descending Triangle pattern breakout seen in the making process seen for stock chart
- Heavy Volumes surging seen over the past few days indicative of good demand based buying

Sinclair Hotels cmp 106.73 by Daily Chart view since listedSinclair Hotels cmp 106.73 by Daily Chart view since listed
- Support Zone 94 to 99 Price Band
- Resistance Zone 113 to 118 Price Band
- Huge Volumes surged today by demand based buying
- Rising Support Trendline sustained by upside price momentum
- Breakout done and sustained from both the Falling Resistance Trendlines
- 7 odd months long Bullish Rounding Bottom done at Resistance Zone Neckline
- Bullish VCP Pattern is embedded inside the above Bullish Rounding Bottom pattern

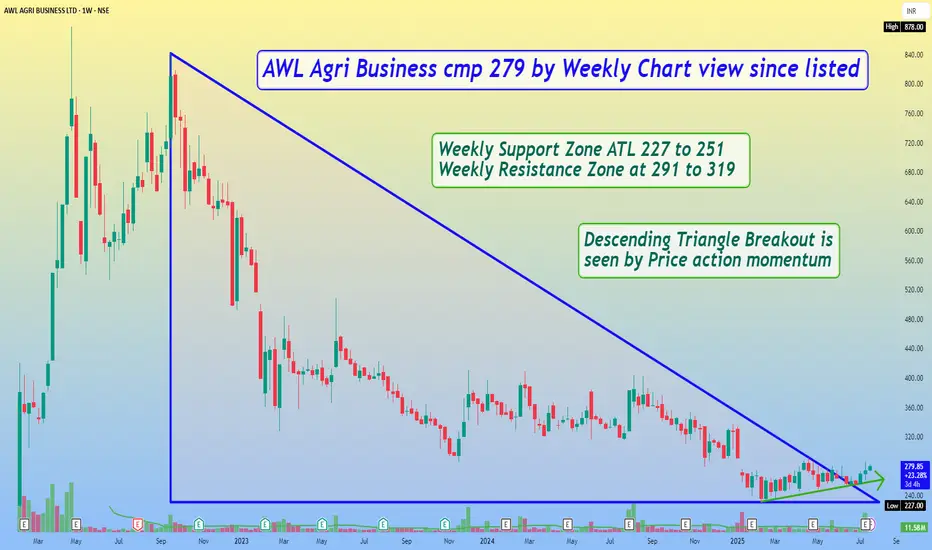
AWL Agri Business cmp 279 by Weekly Chart view since listedAWL Agri Business cmp 279 by Weekly Chart view since listed
- Weekly Support Zone ATL 227 to 251
- Weekly Resistance Zone at 291 to 319
- Descending Triangle Breakout is seen by Price action momentum
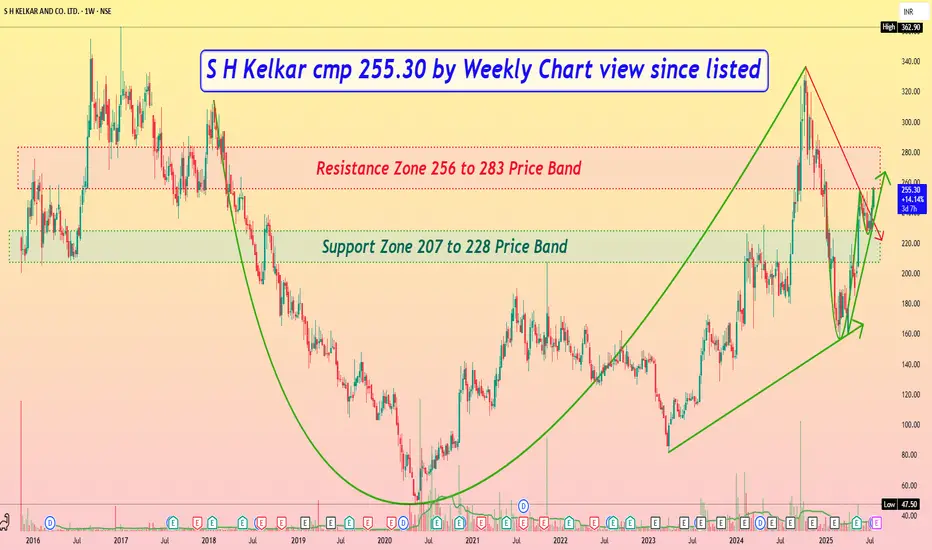
S H Kelkar cmp 255.30 by Weekly Chart view since listedS H Kelkar cmp 255.30 by Weekly Chart view since listed
- Support Zone 207 to 228 Price Band
- Resistance Zone 256 to 283 Price Band
- Volumes trying to sync with average traded quantity
- Support Zone tested retested by upside price momentum
- Bullish Cup & Handle seen completed formation with Resistance Zone neckline
- Fresh Breakout once Resistance Zone is crossed and price sustains closure above it for few days
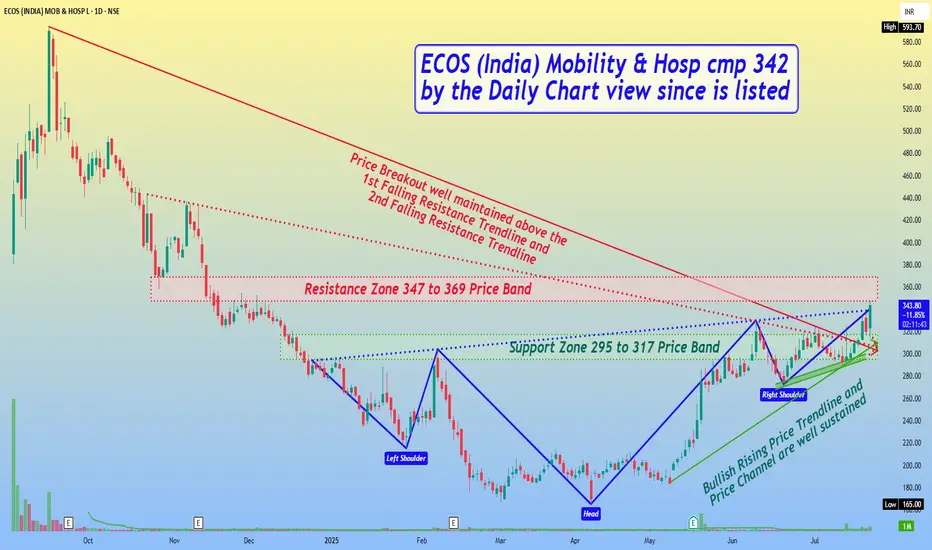
ECOS (India) Mobility & Hosp cmp 342 by Daily Chart since listedECOS (India) Mobility & Hosp cmp 342 by the Daily Chart view since is listed
- Support Zone 295 to 317 Price Band
- Resistance Zone 347 to 369 Price Band
- Bullish Rising Price Trendline and Price Channel are well sustained
- Above may also be interpreted as a Bullish "W" Double Bottom pattern
- *Rising Bullish Head & Shoulders pattern completed at Resistance Zone Neckline
- Volumes are intermittently spiking heavily indicative of demand based buying on the stock counter
- Price Breakout well maintained above the 1st Falling Resistance Trendline and 2nd Falling Resistance Trendline
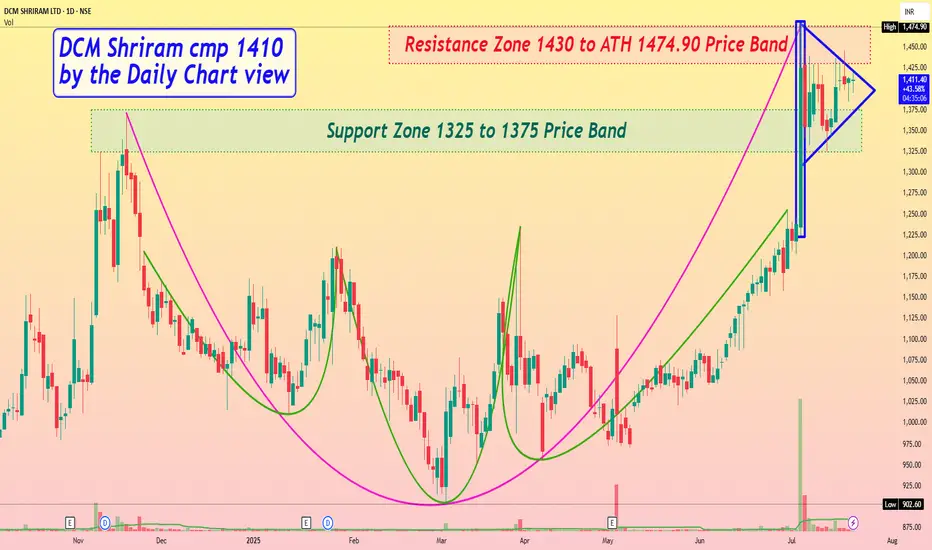
DCM Shriram cmp 1410 by the Daily Chart viewDCM Shriram cmp 1410 by the Daily Chart view
- Support Zone 1325 to 1375 Price Band
- Resistance Zone 1430 to ATH 1474.90 Price Band
- Support Zone been tested retested good and stock now consolidating
- *Bullish Pole and Flag pattern made around Support Zone and Resistance Zone*
- Volumes are flattish to slightly falling, need to increase for fresh upside breakout
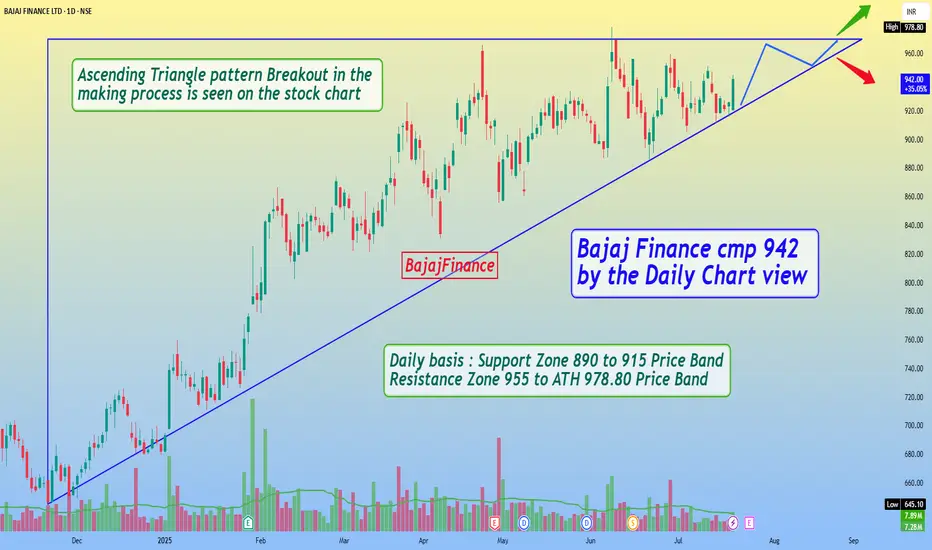
Bajaj Finance cmp 942 by the Daily Chart viewBajaj Finance cmp 942 by the Daily Chart view
- Daily basis : Support Zone 890 to 915 Price Band
- Resistance Zone seen at 955 to ATH 978.80 Price Band
- Ascending Triangle pattern Breakout in the making process is seen on the stock chart
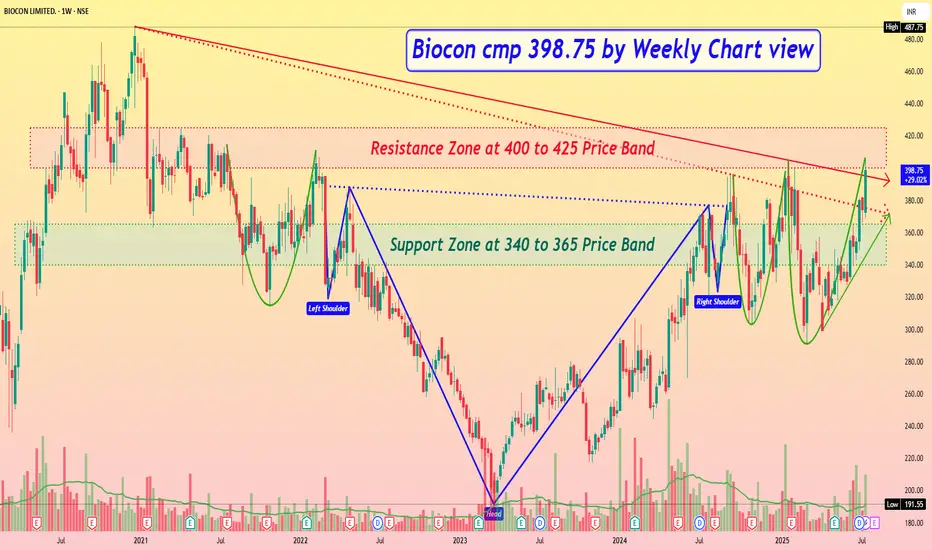
Biocon cmp 398.75 by Weekly Chart viewBiocon cmp 398.75 by Weekly Chart view
- Support Zone at 340 to 365 Price Band
- Resistance Zone at 400 to 425 Price Band
- 2nd Falling Resistance Trendline Breakout attempted
- 1st Falling Resistance Trendline Breakout done and sustained
- Stock Price restrained below Resistance Zone after ATH 487.75 in Dec 2020
- Volumes seen galloping heavily and surging well above the avg traded quantity
- Multiple Bullish Technical patterns completed under Resistance Zone Price Band
- *SUBJECT TO*..... Resistance Zone crossover by few days sustained closure, *ONLY then FRESH BREAKOUT* maybe expected*
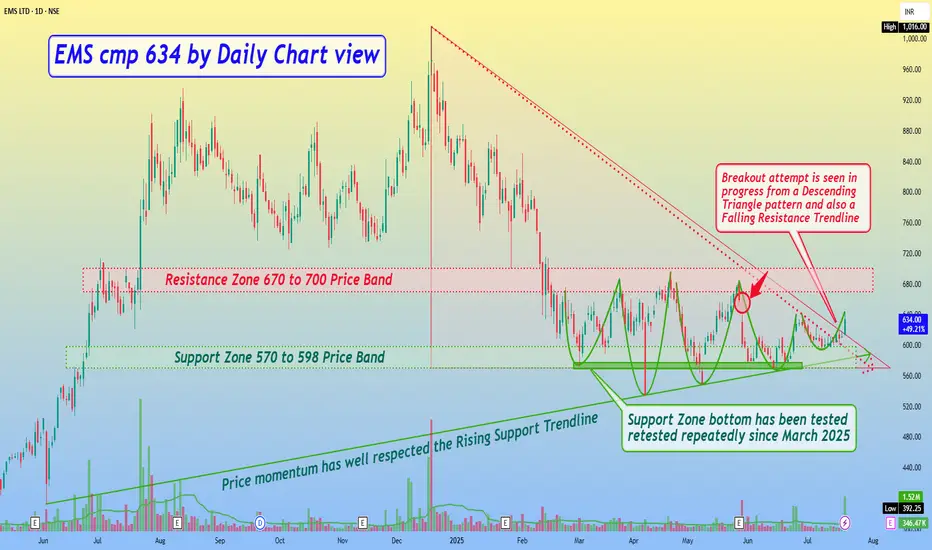
EMS cmp 634 by Daily Chart viewEMS cmp 634 by Daily Chart view
- Support Zone 570 to 598 Price Band
- Resistance Zone 670 to 700 Price Band
- Price momentum has well respected the Rising Support Trendline
- Support Zone bottom has been tested retested repeatedly since March 2025
- *Gap Down Opening of 29-May-2025 will act as tiny hurdle resistance crossing*
- Breakout attempt is seen in progress from a Descending Triangle pattern and also a Falling Resistance Trendline
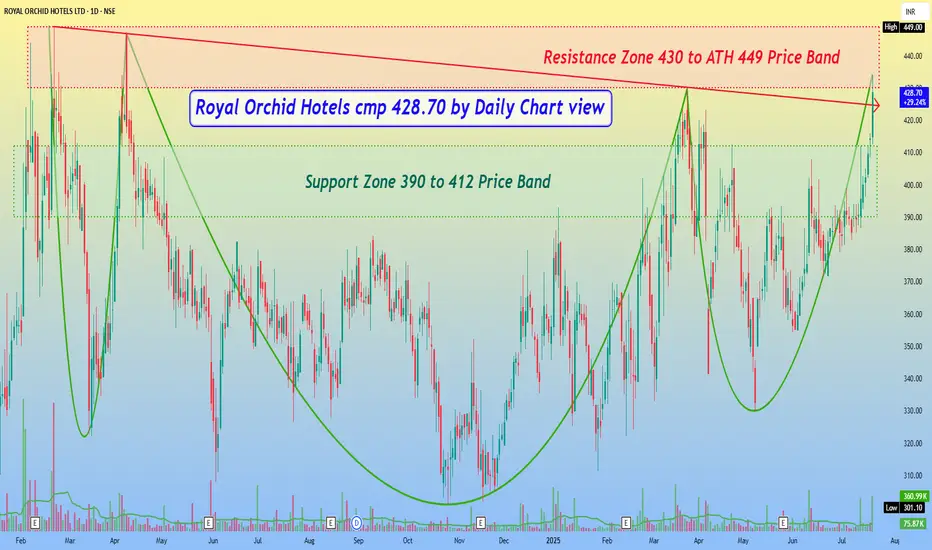
Royal Orchid Hotels cmp 428.70 by Daily Chart viewRoyal Orchid Hotels cmp 428.70 by Daily Chart view
- Support Zone 390 to 412 Price Band
- Resistance Zone 430 to ATH 449 Price Band
- Price attempting Breakout above Falling Resistance Trendline
- Repeated Bullish Rounding Bottoms having Resistance Zone Neckline
- Volumes are seen spiking regularly with heavy surges at intermittent intervals
- Price trending with Positively setup Technical Indicators BB, EMA, MACD, RSI, SAR, SuperTrend
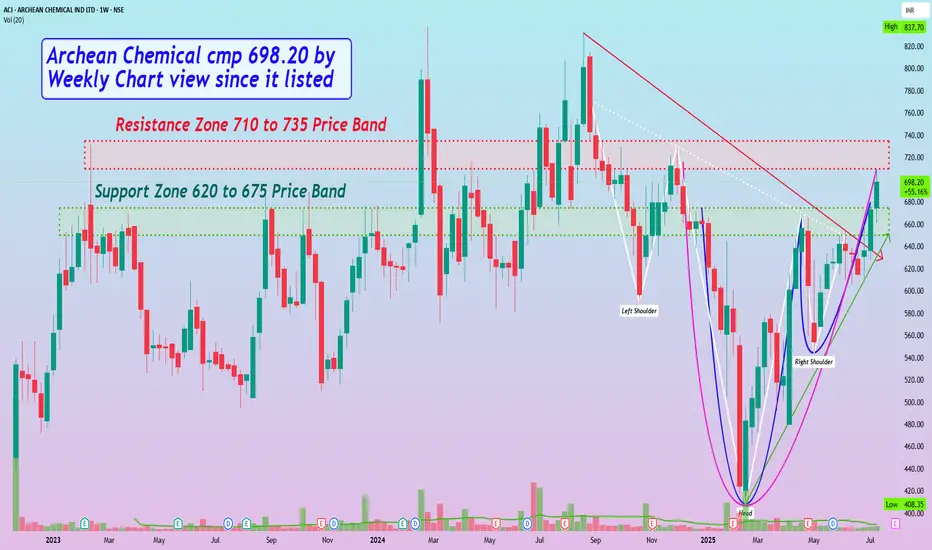
Archean Chemical cmp 698.20 by Weekly Chart view since it listedArchean Chemical cmp 698.20 by Weekly Chart view since it listed
- Support Zone 620 to 675 Price Band
- Resistance Zone 710 to 735 Price Band
- Volumes flattish, need to increase for Resistance Zone Breakout
- Bullish Rounding Bottom inclusive of Cup & Handle pattern completed
- A logically considerate slanting Bullish Head & Shoulder pattern too, has completed
- Falling Resistance Trendline Breakout sustained and Rising Support Trendline respected