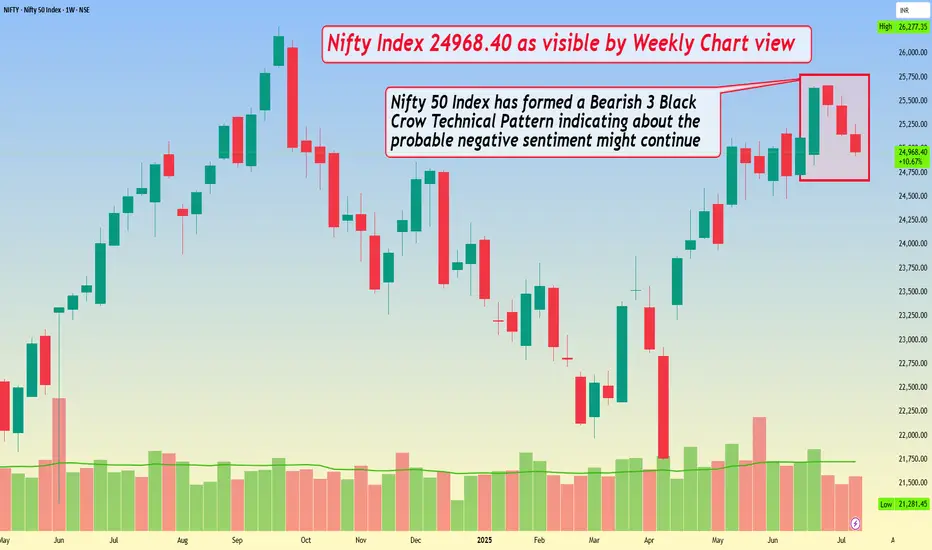
Nifty Index 24968.40 as visible by Weekly Chart viewNifty Index 24968.40 as visible by Weekly Chart view
- Nifty 50 Index has formed a Bearish 3 Black Crow Technical Pattern indicating about the probable negative sentiment might continue
- Nifty is also closely forming a sliding Bearish Double Top from ATH 26277.35 to current top 25669.35, which again syncs with the negative sentiment trend trajectory
Technicalchartpatterns
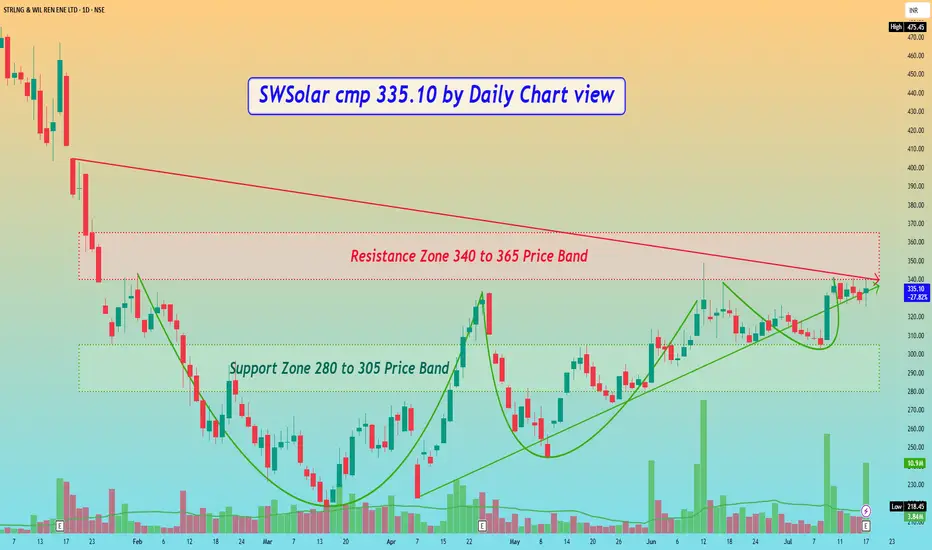
SWSolar Sterling & Wilson cmp 335.10 by Daily Chart viewSWSolar cmp 335.10 by Daily Chart view
- Support Zone 280 to 305 Price Band
- Resistance Zone 340 to 365 Price Band
- Bullish VCP Pattern completed on stock chart
- Volumes spiking heavily at regular intervals by demand based buying
- Resistance Zone Neckline Breakout maybe seen unfolding in the near future
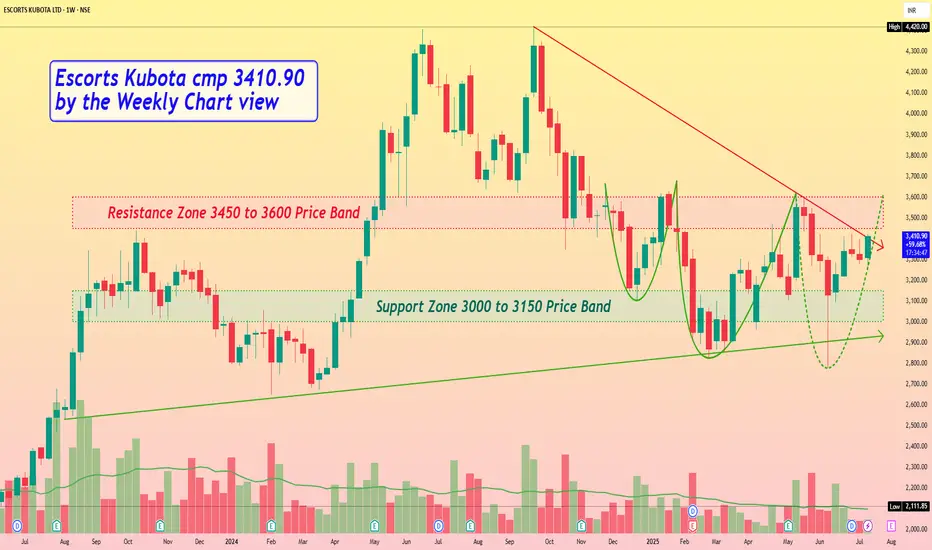
Escorts Kubota cmp 3410.90 by the Weekly Chart viewEscorts Kubota cmp 3410.90 by the Weekly Chart view
- Support Zone 3000 to 3150 Price Band
- Resistance Zone 3450 to 3600 Price Band
- 2 Bullish Rounding Bottoms done, 3rd in completion stage
- Volumes needed to push for fresh breakout across Resistance Zone
- Falling Resistance Trendline Breakout attempted by the current status
- Rising Support Trendline is well respected and sustained by price momentum
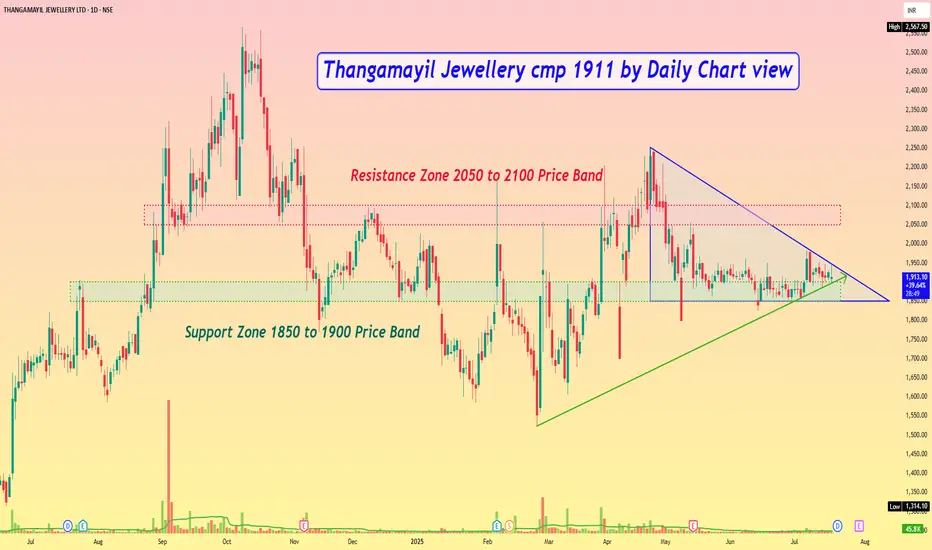
Thangamayil Jewellery cmp 1911 by Daily Chart viewThangamayil Jewellery cmp 1911 by Daily Chart view
- Support Zone 1850 to 1900 Price Band
- Resistance Zone 2050 to 2100 Price Band
- Symmetrical Triangle Breakout in the making process
- Price is currently testing retesting the Support Zone band
- Price action momentum respecting Rising Support Trendline
- Volumes are flat and need to increase for the upside momentum
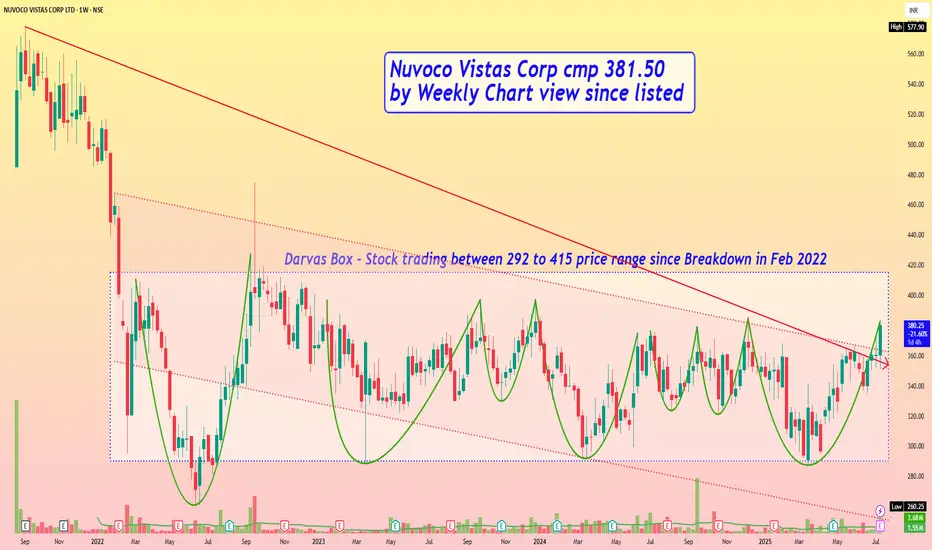
Nuvoco Vistas Corp cmp 381.50 by Weekly Chart view since listedNuvoco Vistas Corp cmp 381.50 by Weekly Chart view since listed
- Support Zone 335 to 355 Price Band
- Resistance Zone 395 to 415 Price Band
- Volumes generated over past few days based on expected good results outcome
- Darvas Box - Stock trading between 292 to 415 price range since Breakdown in Feb 2022
- Multiple Bullish Rounding Bottoms completed within Darvas Box indicative of probable breakout attempted
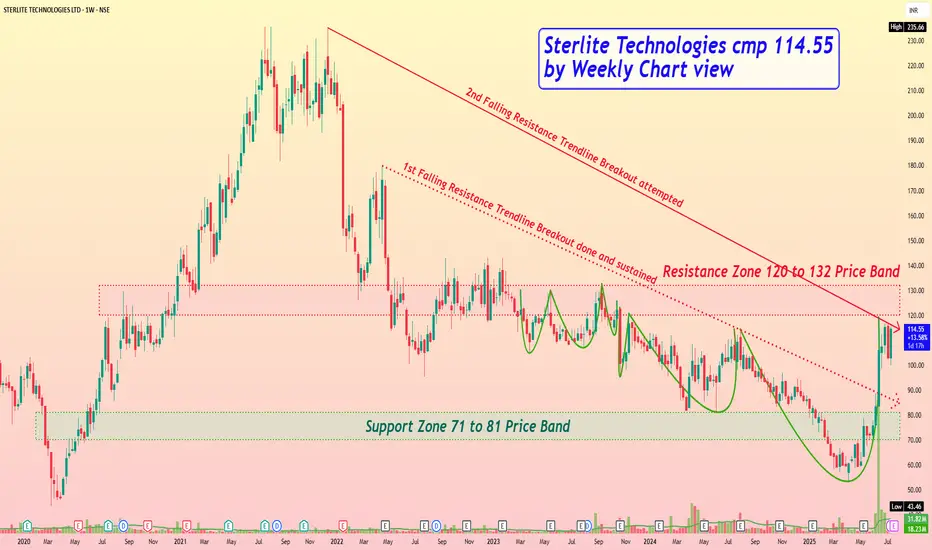
Sterlite Technologies cmp 114.55 by Weekly Chart viewSterlite Technologies cmp 114.55 by Weekly Chart view
- Support Zone 71 to 81 Price Band
- Resistance Zone 120 to 132 Price Band
- 2nd Falling Resistance Trendline Breakout attempted
- 1st Falling Resistance Trendline Breakout done and sustained
- Volumes spiked heavily over past few days by demand based buying
- Repeated Bullish Rounding Bottoms indicate probable Breakout above Resistance Zone neckline
LIC Housing Finance cmp 637.05 by Daily Chart viewLIC Housing Finance cmp 637.05 by Daily Chart view
- Support Zone 600 to 625 Price Band
- Resistance Zone 660 to 685 Price Band
- Rising Support Trendline seen well respected
- Volumes have spiked heavily today by demand based buying
- Breakout seemingly sustained for Double Falling Resistance Trendlines
- Support Zone acting as neckline for Multiple Bullish Technical Chart patterns
- Most common Technical Indicators BB, EMA, MACD, RSI, SAR trending positively
- Bullish Rounding Bottoms with considerate Cup & Handle and a faintly observant Head & Shoulders too

Vascon Engineers cmp 55.70 by Weekly Chart viewVascon Engineers cmp 55.70 by Weekly Chart view
- Support Zone 49.50 to 53.50 Price Band
- Resistance Zone 49.50 to 53.50 Price Band
- Volumes are getting close to average traded quantity
- Common Technical Indicators BB, EMA, SAR, MACD, RSI indicating positive trend
- Multiple Bullish Technical Chart patterns have emerged on the Daily and Weekly Charts
- Rounding Bottom, Head & Shoulders, Cup & Handle, VCP, as one may observe and interpret
