Madras Fertilizers cmp 80.25 by Daily Chart viewMadras Fertilizers cmp 80.25 by Daily Chart view
- Support Zone 76.25 to 79.25 Price Band
- Resistance Zone 83.50 to 87.50 Price Band
- Bullish *W* upwards inclined by the Resistance Zone neckline
- Falling Resistance Trendlines, 1st Breakout done, next coming soon
- Volumes spiked heavily last week Thursday by demand based buying
Technicalchartsetup

RACL Geartech cmp 1169.20 by Daily Chart view since listedRACL Geartech cmp 1169.20 by Daily Chart view since listed
- Support Zone 1050 to 1125 Price Band
- Resistance Zone 1195 to 1245 >>> ATH 1347.80
- Volumes have spiked very heavily over past 2 days
- Strong Bullish Bottom formed around the Support Zone
- Resistance Zone Breakout attempts in the making process
- Falling and Rising Price Channels repeated since day of listing
- Majority of the Technical Indicators showing positive momentum

Bank Nifty spot 59011.35 by Daily Chart view - Weekly UpdateBank Nifty spot 59011.35 by Daily Chart view - Weekly Update
- Bank Nifty has yet again closed within Support Zone range
- Support Zone been sustained at 58850 to 59375 for Bank Nifty
- Resistance Zone stands ground at 59825 to ATH 60114.30 for Bank Nifty
- Volumes have fallen well below the average traded quantity thru this week
- Falling Resistance Trendline still hovering on as Bank Nifty closed below trendline

NSDL cmp 1081.40 by Daily Chart viewNSDL cmp 1081.40 by Daily Chart view
- Support Zone 1040 to 1085 Price Band
- Resistance Zone 1135 to 1185 Price Band
- Bullish Triple Bottom at 1037 to 1049 Price Band
- Volumes flattish and under average traded quantity
- Price trending within Support Zone thru December 2025
- Falling Resistance Trendline Breakout seems taking process

CRISIL cmp 4322.10 by Weekly Chart viewCRISIL cmp 4322.10 by Weekly Chart view
- Support Zone 3960 to 4300 Price Band
- Resistance Zone 4600 to 4940 Price Band
- Support Zone tested retested for 3rd week now
- Rising Support Trendline seems to be well respected
- Volumes are keeping well above average traded quantity
- Continued Selling but Buying keeps Price above Support Band
- Price reversal from Support Zone maybe in making by Chart Status

Kross cmp 176.22 by Daily Chart view since listedKross cmp 176.22 by Daily Chart view since listed
- Support Zone 156 to 166 Price Band
- Resistance Zone 180 to 192 Price Band
- Volume attempting sync with avg traded qty
- Bullish Double Bottom "W" with Support Zone base
- Falling Resistance Trendline Breakout has well sustained
- Resistance Zone neckline acting as good hurdle for Breakout
- Majority of the Technical Indicators seen trending fairly positive

Bank Nifty spot 59069.20 by the Daily Chart view - Weekly UpdateBank Nifty spot 59069.20 by the Daily Chart view - Weekly Update
- Bank Nifty has closed within the Support Zone range
- Support Zone sustained at 58850 to 59375 for Bank Nifty
- Resistance Zone stands firmly at 59825 to ATH 60114.30 for Bank Nifty
- Volumes in close sync with avg traded quantity over with intermittent spikes
- Falling Resistance Trendline weighing hard for Bank Nifty has closed below trendline

IDFC First Bank cmp 83.79 by Weekly Chart viewIDFC First Bank cmp 83.79 by Weekly Chart view
- Support Zone 66 to 75 Price Band
- Resistance Zone 84 to 93 then ATH 100.70
- Bullish Cup and Handle setup made on the chart
- Falling Resistance Trendlines Breakouts well sustained
- Volumes are in close sync with the average traded quantity

Nifty 50 spot 26046.95 by the Daily Chart viewNifty 50 spot 26046.95 by the Daily Chart view
- Support Zone is intact at 25710 to 26010 for Nifty Index
- Resistance Zone stands stable at 26200 to ATH 26325.80 for Nifty Index
- Volumes keeping stable under average traded quantity over past few days
- Falling Resistance Trendline Breakout attempts seem in the making process

Walchandnagar Inds cmp 172.50 by Weekly Chart viewWalchandnagar Inds cmp 172.50 by Weekly Chart view
- Support Zone 144 to 163 Price Band
- Resistance Zone 205 to 225 Price Band
- Support Zone tested retested over past few weeks
- Volume spiked heavily last week and above avg traded qty

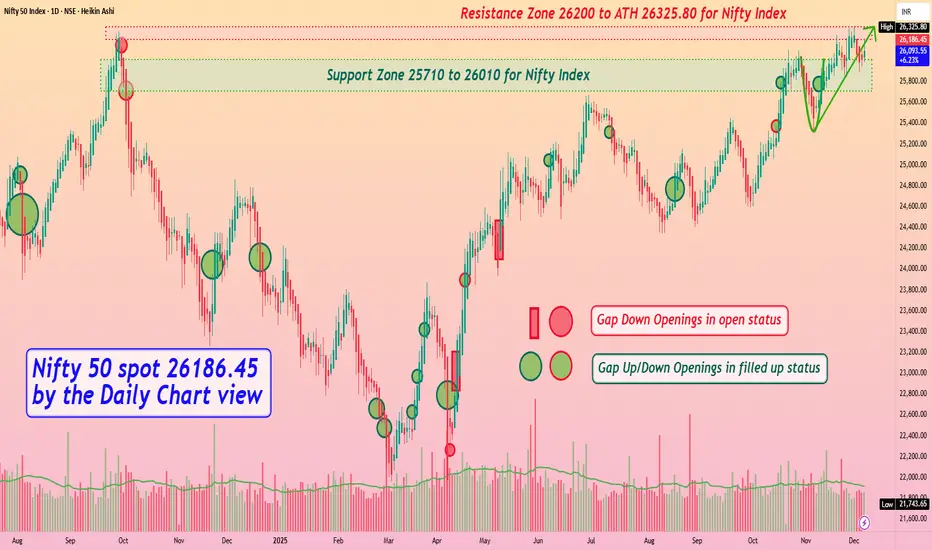
Nifty 50 spot 26186.45 by Daily Chart view - Weekly updateNifty 50 spot 26186.45 by Daily Chart view - Weekly update
- Support Zone 25710 to 26010 for Nifty Index
- Resistance Zone 26235 to ATH 26310.45 for Nifty Index
- Anticipate the subdued Bullish momentum to continue for Nifty 50
- Moreso Geo-Political tariff tricklers with certain Domestic factors creating weakness
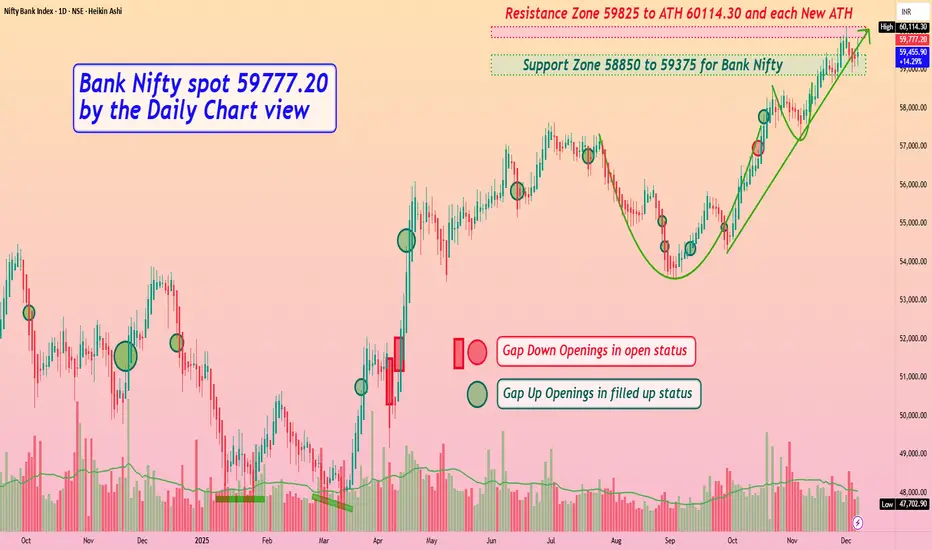
Bank Nifty spot 59777.20 by the Daily Chart view - Weekly updateBank Nifty spot 59777.20 by the Daily Chart view - Weekly update
- Support Zone 58850 to 59375 for Bank Nifty
- Resistance Zone 59780 to ATH 59897.50 and each New ATH
- Bullish momentum seems intact but Rising Support Trendline is Broken down
- Moreso Geo-Political tariff tricklers with certain Domestic factors creating weakness
Zuari Agro Chemicals cmp 294.80 by Monthly Chart viewZuari Agro Chemicals cmp 294.80 by Monthly Chart view
- Support Zone 239 to 274 Price Band
- Resistance Zone 325 to 362 Price Band
- Rounding Bottom by Resistance Zone neckline
- Breakout well sustained above dotted Falling Resistance Trendlines
- 3rd Falling Resistance Trendline from ATH level Breakout maybe made
- Rising Support Trendlines are well respected by upside price momentum
- Volumes with heavy spikes in between by close sync with avg traded quantity

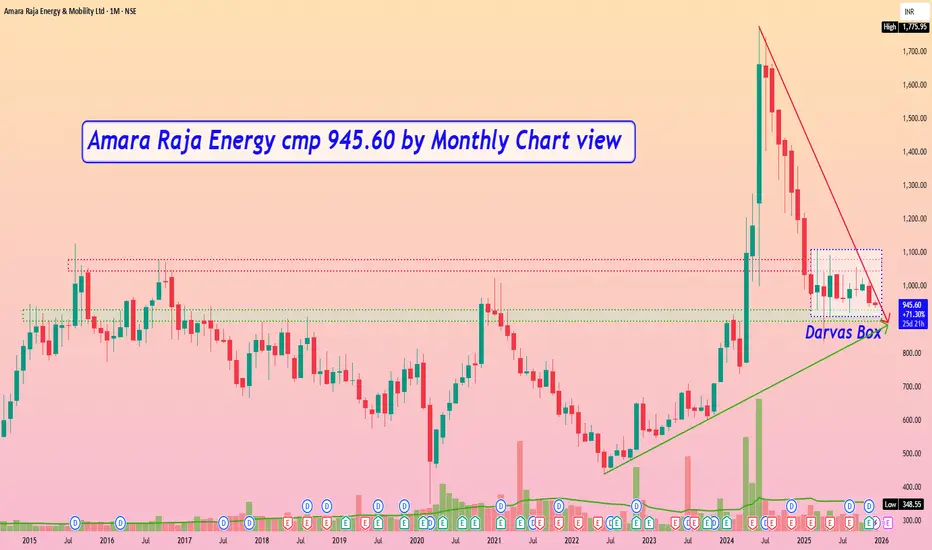
Amara Raja Energy cmp 945.60 by Monthly Chart viewAmara Raja Energy cmp 945.60 by Monthly Chart view
- Support Zone 895 to 930 Price Band
- Resistance Zone 1045 to 1080 >> 1110 Price Band
- Volumes seen closely flat to falling since hitting ATH in June 2024
- Volumes indicate consolidation and accumulation since February 2025
- Darvas Box : Price trending within 910 to 1110 range since February 2025
- Support Zone well respected over past few months but Price retracing at the Resistance Zone
MAS Financial cmp 313 by Daily Chart viewMAS Financial cmp 313 by Daily Chart view
- Support Zone 275 - 295 Price Band
- Resistance Zone 325 to 345 Price Band
- Falling Resistance Trendline Breakout seems been sustained
- Repeat Bullish Rounding Bottoms done with last in making process
- Volumes are seen to be in decent sync with the average traded quantity
- Good accumulation since August 2025 within Support and Resistance Zone

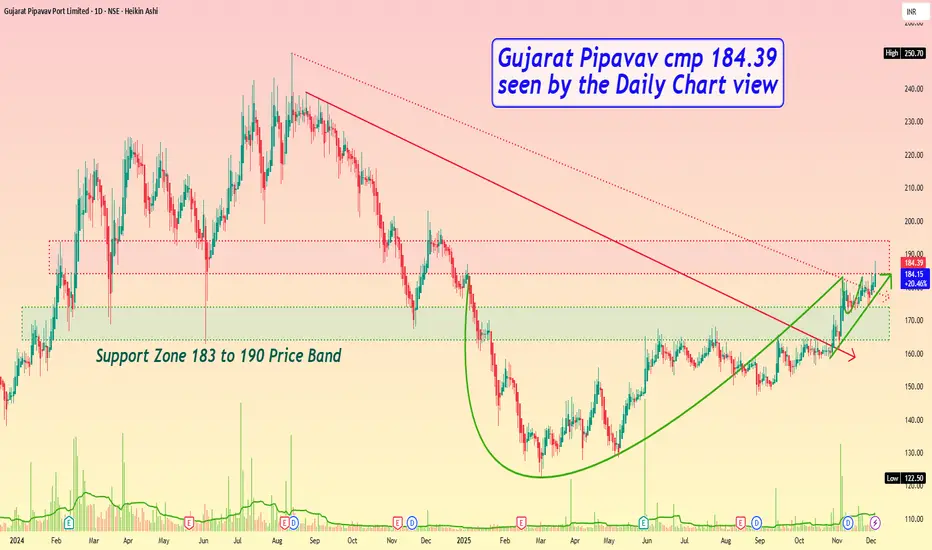
Gujarat Pipavav cmp 184.39 by Daily Chart viewGujarat Pipavav cmp 184.39 by Daily Chart view
- Support Zone 164 to 174 Price Band
- Resistance Zone 184 to 194 Price Band
- Bullish Cup & Handle formed by Resistance Zone neckline
- Breakout from both Falling Resistance Trendline well sustained
- Volumes spiking heavily to well above and in sync with avg traded qty
- Positively trending Technical Indicators BB, EMA, MACD, RSI, SAR, SuperTrend
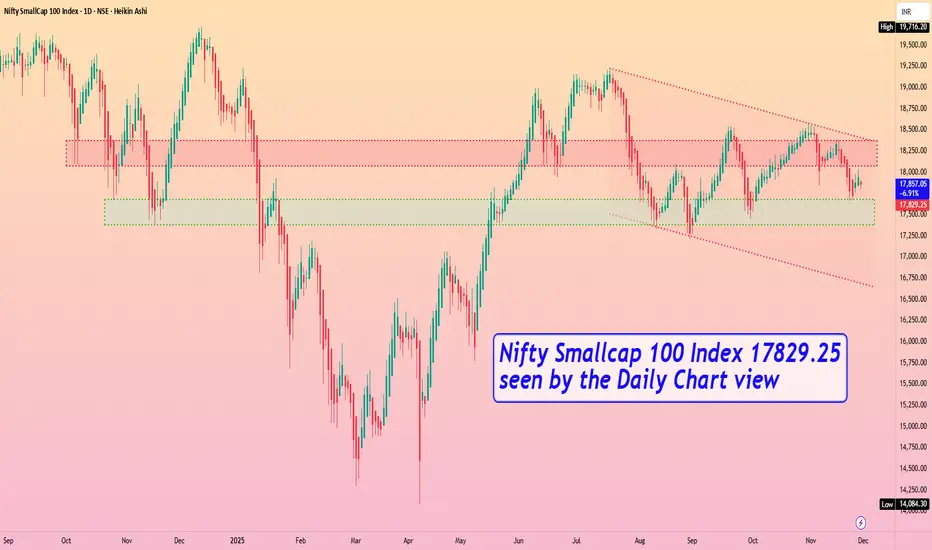
Nifty Smallcap 100 Index 17829.25 by Daily Chart viewNifty Smallcap 100 Index 17829.25 by Daily Chart view
- Support Zone 17375 to 17675 Index Band
- Resistance Zone to 18075 to 18375 Index Band
- Index formed Lower High Lower Lows since mid of July 2025
- Current status indicating Support Zone shoulder for probable upside
- Let us all hope for the best to happen and keep our fingers crossed 🤞🏽🤞🏽🤞🏽🤞🏽🤞🏽
- IF ..... next full week we see closure above Support Zone with breach into Resistance Zone then fresh upside breakout may be anticipated.
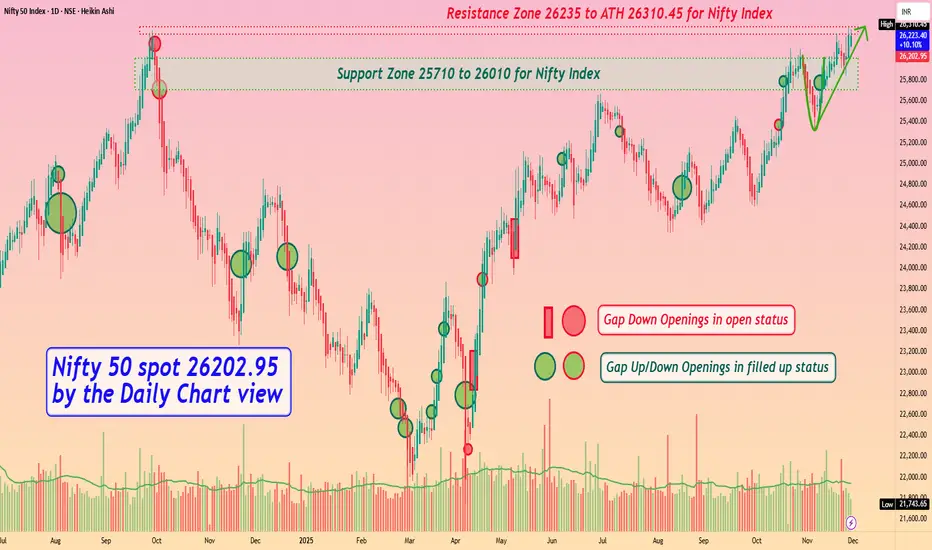
Nifty 50 spot 26202.95 by Daily Chart view - Weekly updateNifty 50 spot 26202.95 by Daily Chart view - Weekly update
- Support Zone 25710 to 26010 for Nifty Index
- Resistance Zone 26235 to ATH 26310.45 for Nifty Index
- Finally after 14 months Nifty 50 hit New Lifetime High Milestone 26310.45
- Hope to see Bullish momentum continue for Nifty 50 with positive expectation
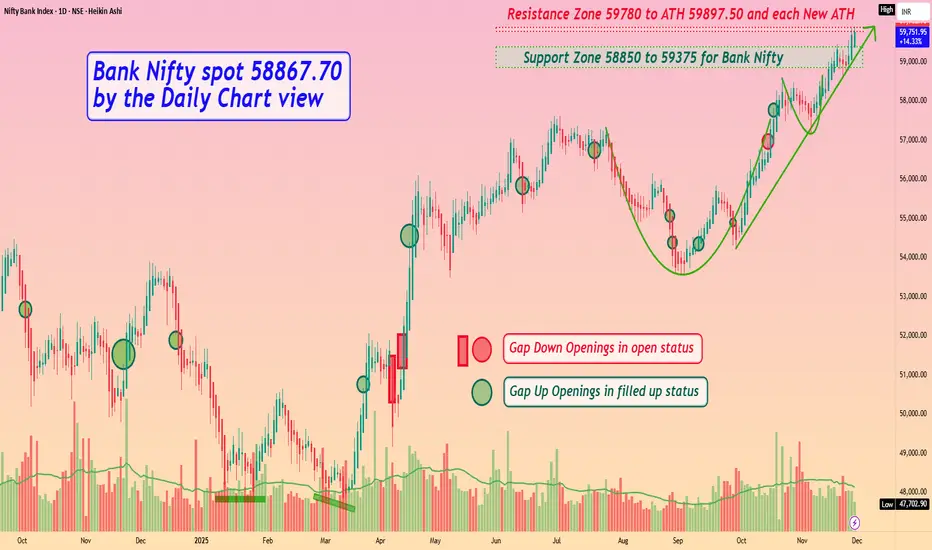
Bank Nifty spot 58867.70 by Daily Chart view - Weekly updateBank Nifty spot 58867.70 by Daily Chart view - Weekly update
- Support Zone 58850 to 59375 for Bank Nifty
- Resistance Zone 59780 to ATH 59897.50 and each New ATH
- Bank Nifty seems gotten in a habit to create ATH every other day
- Bullish momentum well trending on Bank Nifty and expect more to come
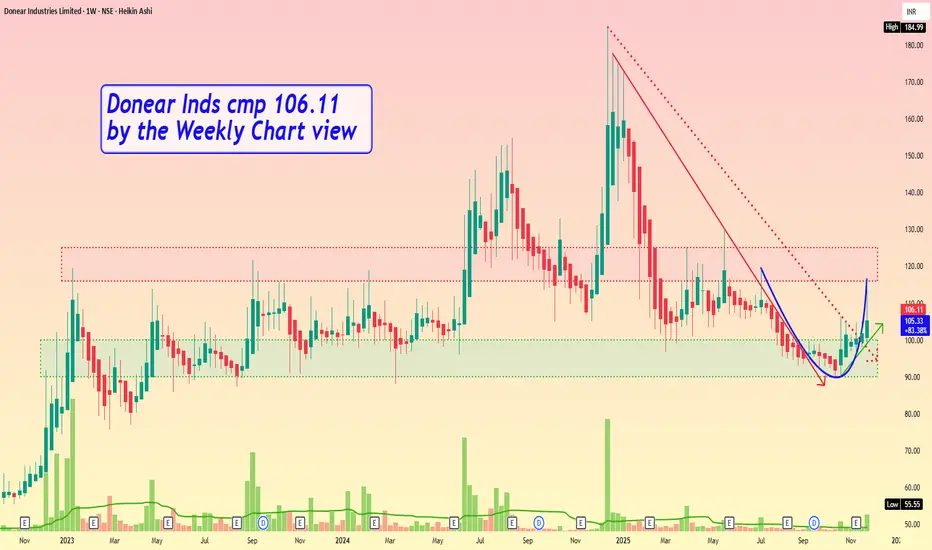
Donear Inds cmp 106.11 by the Weekly Chart viewDonear Inds cmp 106.11 by the Weekly Chart view
- Support Zone 90 to 100 Price Band
- Resistance Zone 116 to 125 Price Band
- Price shouldering along the Rising Support Trendline
- Breakout from Falling Resistance Trendline well sustained
- Bullish Rounding Bottom done by Resistance Zone neckline
- Support Zone tested retested prior to price moved to upscale
- Volumes are intermittently spiking heavily over past few weeks
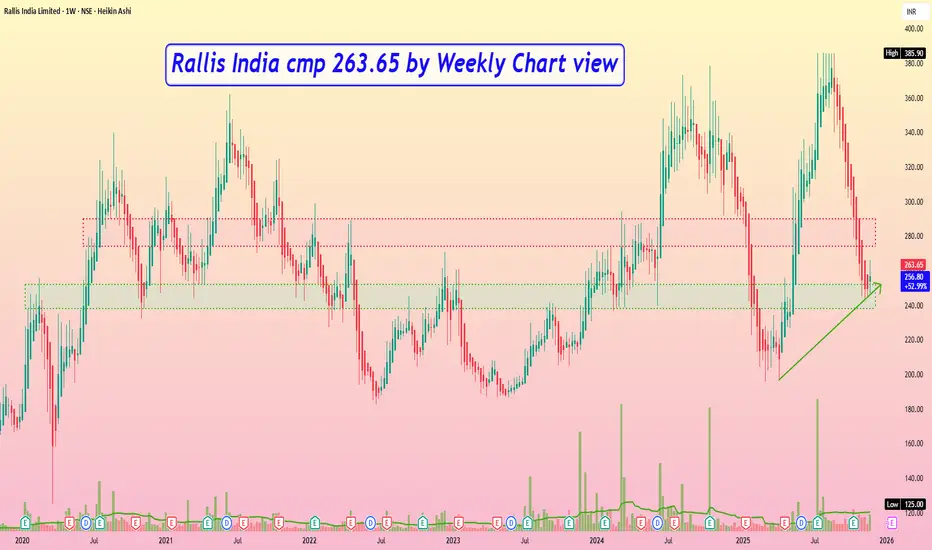
Rallis India cmp 263.65 by Weekly Chart viewRallis India cmp 263.65 by Weekly Chart view
- Support Zone 238 to 252 price Band
- Resistance Zone 274 to 290 price Band
- Stock fell from ATH 385.90 by Bearish Top formation
- Support Zone (since Sept 2014) tested retested for fresh up move
- Volumes below avg traded qty need to increase for upward price movement
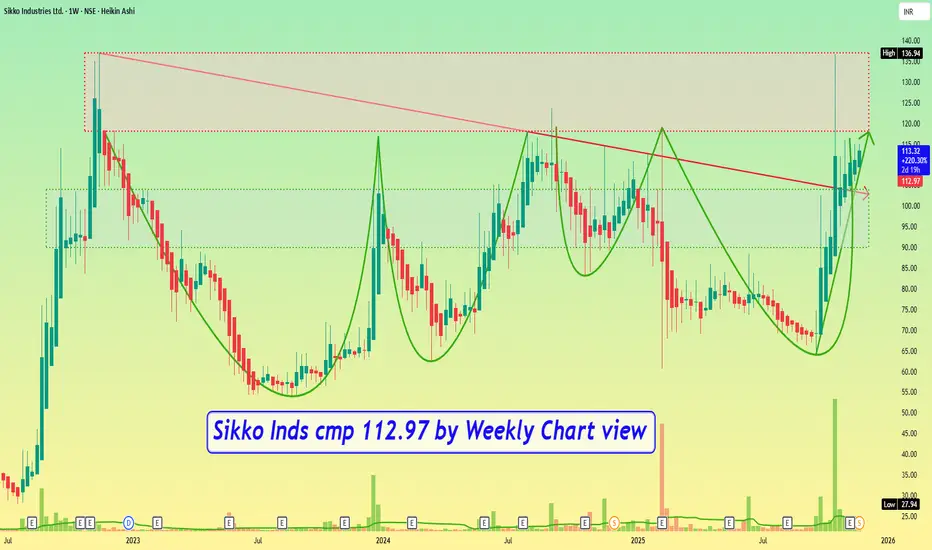
Sikko Inds cmp 112.97 by Weekly Chart viewSikko Inds cmp 112.97 by Weekly Chart view
- Support Zone 90 to 104 Price Band
- Resistance Zone 118 to ATH 136.94 Price Band
- Volumes in good sync with average traded quantity
- Bullish Rounding Bottoms by Resistance Zone neckline
- Resistance Zone holding strongly at each breakout attempts
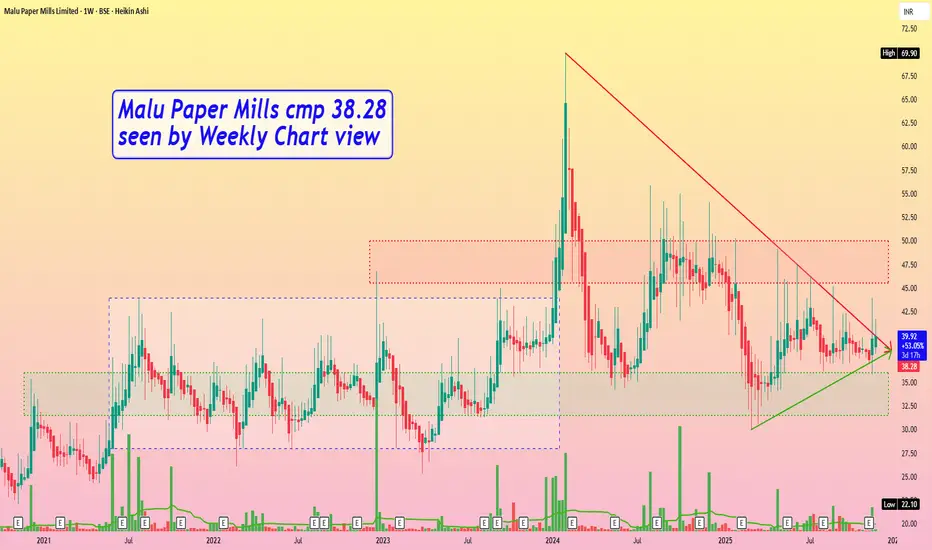
Malu Paper Mills cmp 38.28 by Weekly Chart viewMalu Paper Mills cmp 38.28 by Weekly Chart view
- Support Zone 31.50 to 36 Price Band
- Resistance Zone 45.50 to 50 Price Band
- Darvas Box Strategy Breakout done in Jan 2024
- Volumes spiking regularly over the past few weeks