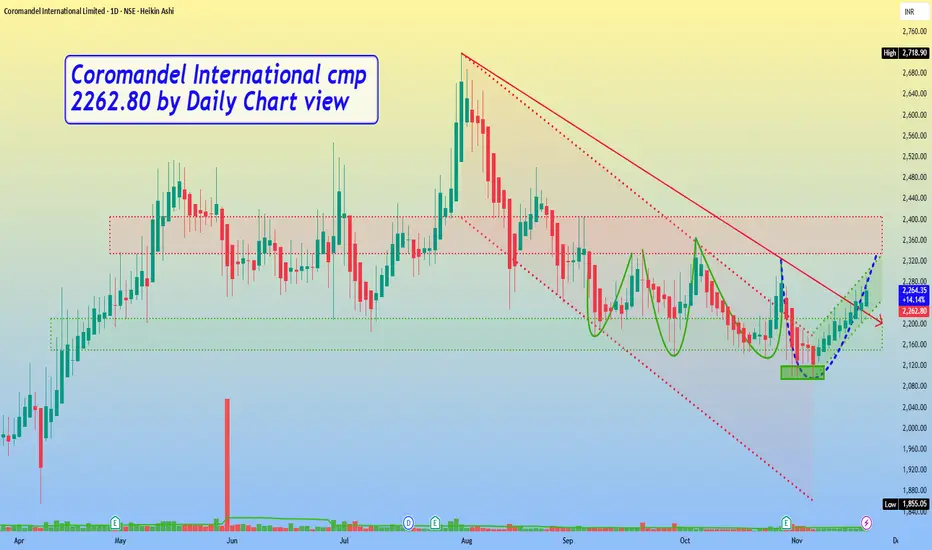
Coromandel International cmp 2262.80 by Daily Chart viewCoromandel International cmp 2262.80 by Daily Chart view
- Support Zone 2150 to 2210 Price Band
- Resistance Zone 2335 to 2405 Price Band
- Falling Resistance Trendline Breakout has well sustained
- Bullish Triple Bottom made around 2095 to 2120 Price Band
- Repeated Bullish Rounding Bottoms by Resistance Zone neckline
- Volumes seem steady and need to increase for Resistance Zone Breakout
Technicalchartsetup
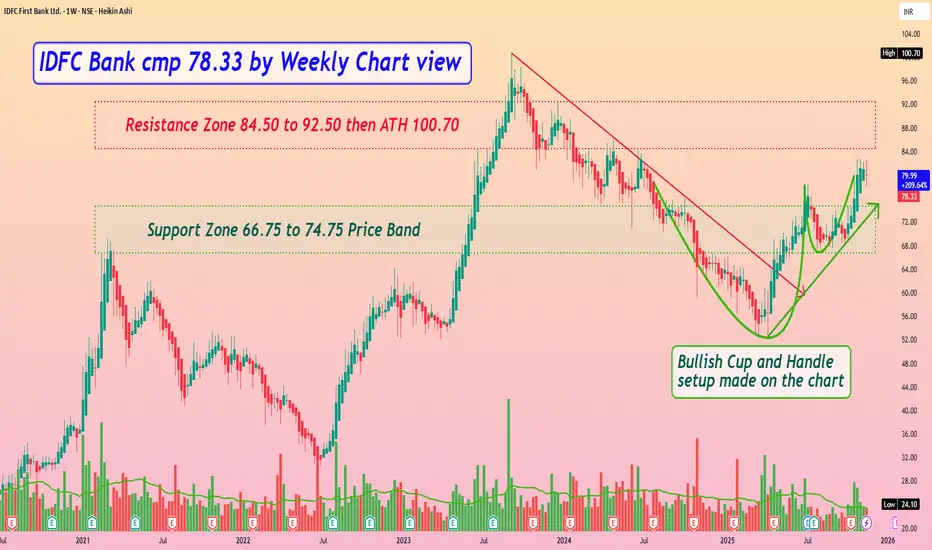
IDFC Bank cmp 78.33 by Weekly Chart viewIDFC Bank cmp 78.33 by Weekly Chart view
- Support Zone 66.75 to 74.75 Price Band
- Resistance Zone 84.50 to 92.50 then ATH 100.70
- Bullish Cup and Handle setup made on the stock chart
- Volumes are in good sync with the average traded quantity
- Rising Support Trendline well sustained and trending positively
- Resistance Zone Breakout by increased volumes to pave way for New ATH
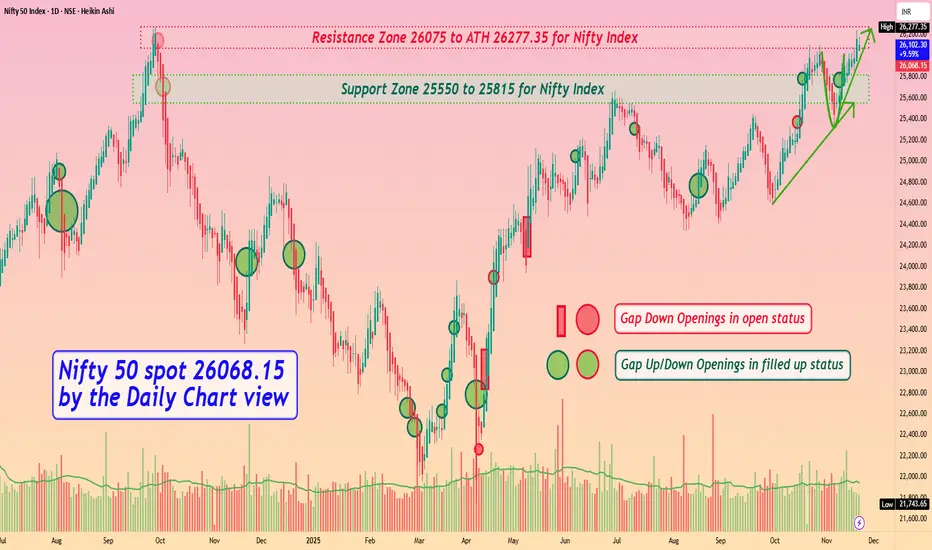
Nifty 50 spot 26068.15 by the Daily Chart view - Weekly updateNifty 50 spot 26068.15 by the Daily Chart view - Weekly update
- Support Zone 25550 to 25815 for Nifty Index
- Resistance Zone 26075 to ATH 26277.35 for Nifty Index
- Nifty keeping off to create ATH by Domestic and Geo Political events
- Bullish momentum intact but general Global paleness keeps New ATH distant
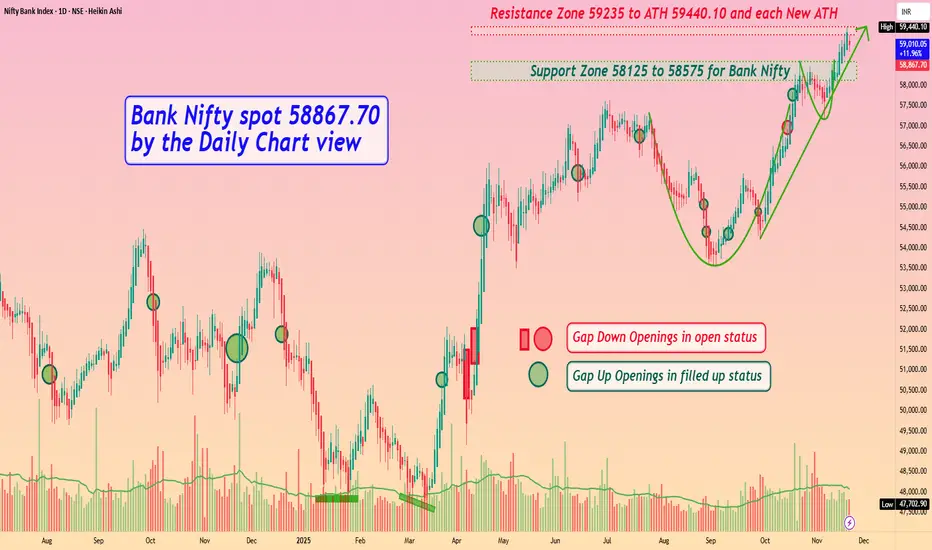
Bank Nifty spot 58867.70 by Daily Chart view - Weekly updateBank Nifty spot 58867.70 by Daily Chart view - Weekly update
- Support Zone 58125 to 58575 for Bank Nifty
- Resistance Zone 59235 to ATH 59440.10 and each New ATH
- Bullish momentum intact, aiding New ATH pretty much on daily basis
- Domestic and Geo Political events kept Bank Nifty off from creating New ATH
IDBI Bank cmp 104.62 by Monthly Chart viewIDBI Bank cmp 104.62 by Monthly Chart view
- Support Zone at 64 to 84 Price Band
- Resistance Zone at 108 to 128 Price Band
- Breakout attempted from Falling Resistance Trendline
- Bullish Head and Shoulders by the Resistance Zone neckline
- Monthly Volumes spiking regularly over a year since Sept 2024
- Positively trending Technical Indicators BB, EMA, MACD, RSI, SAR, SuperTrend

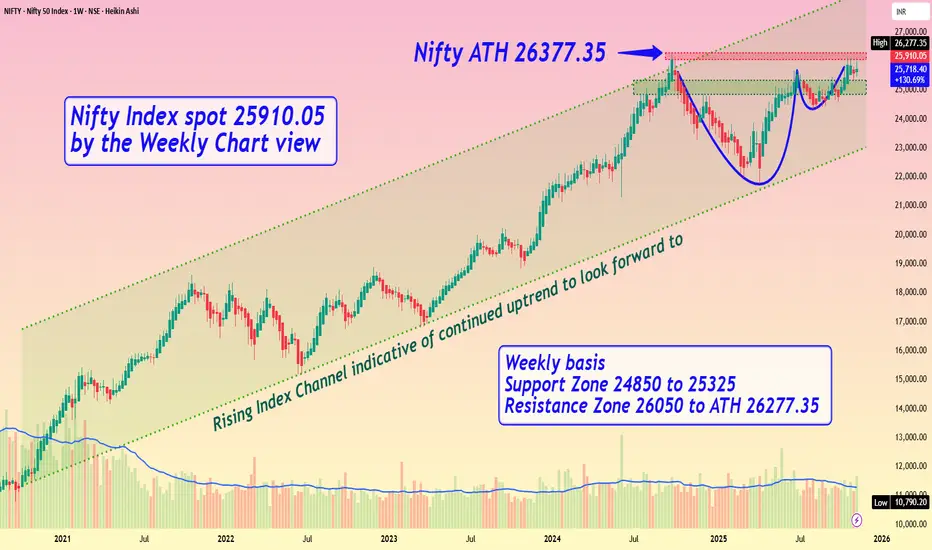
Nifty Index spot 25910.05 by the Weekly Chart viewNifty Index spot 25910.05 by the Weekly Chart view
- Weekly basis - Support Zone 24850 to 25325
- Weekly basis - Resistance Zone 26050 to ATH 26277.35
- Rising Index Channel indicative of continued uptrend to look forward to .....
- Bullish Cup and Handle pattern shows breakout expectation from Resistance Zone
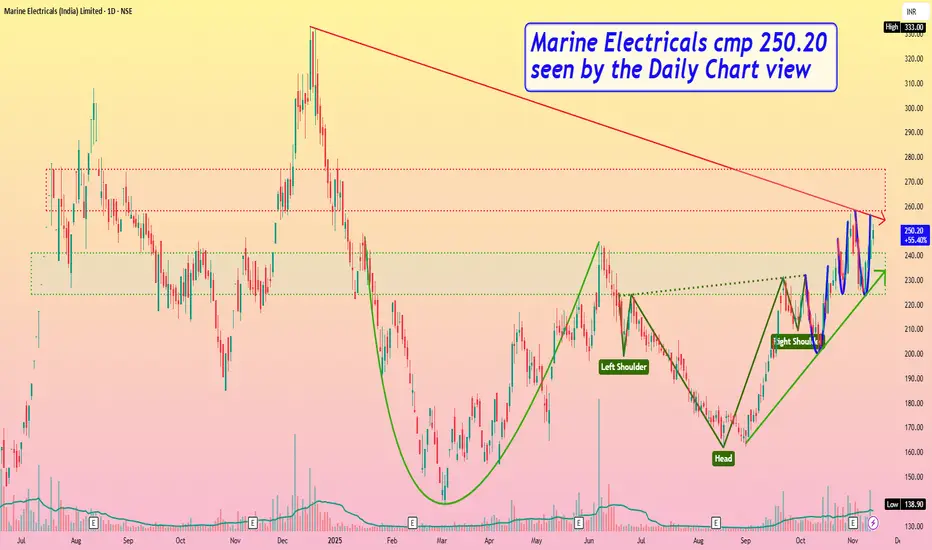
Marine Electricals cmp 250.20 by Daily Chart viewMarine Electricals cmp 250.20 by Daily Chart view
- Support Zone 224 to 241 Price Band
- Resistance Zone 258 to 275 Price Band
- Bullish Chart setup by Rounding Bottoms, pre and post Head & Shoulders
- Volumes seen spiking very heavily and well above the average traded quantity
- Positively trending Technical Indicators BB, EMA, MACD, RSI, SAR, SuperTrend, VWAP
- Breakout attempted above Falling Resistance Trendline and Rising Support Trendline sustained
- Fresh Breakout probable subject to Resistance Zone crossing and closure sustained above it for few days
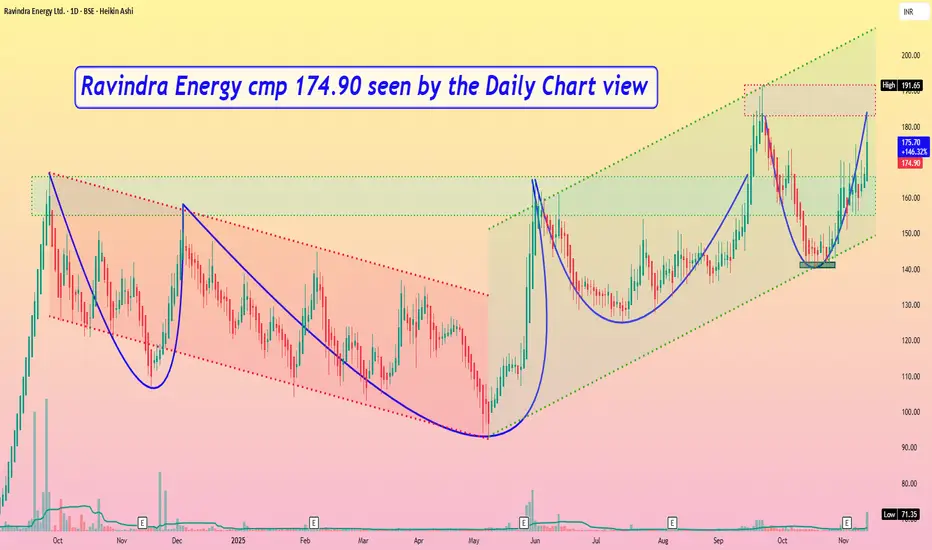
Ravindra Energy cmp 174.90 by Daily Chart viewRavindra Energy cmp 174.90 by Daily Chart view
- Support Zone 155 to 166 Price Band
- Resistance Zone 183 to ATH 191.60 Price Band
- Bullish Triple Bottom formed at 140 to 142 price band
- Repeated Bullish Rounding Bottoms with considerate VCP too
- Volumes spiking in good numbers intermittently over past few weeks
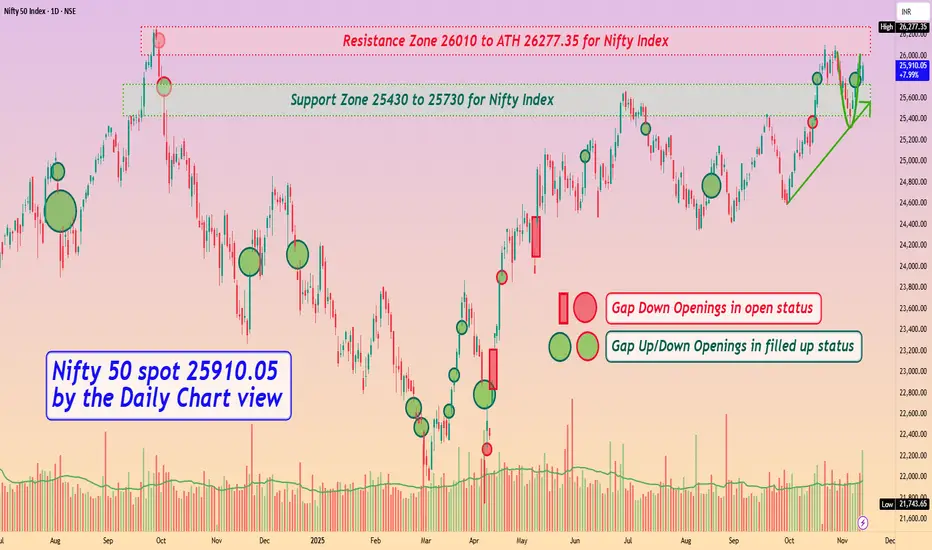
Nifty 50 spot 25910.05 by Daily Chart view - Weekly UpdateNifty 50 spot 25910.05 by Daily Chart view - Weekly Update
- Support Zone 25430 to 25730 for Nifty Index
- Resistance Zone 26010 to ATH 26277.35 for Nifty Index
- Rising Support Trendline seems respected by weekly positive closure
- Rounding Bottom Bullish momentum by Resistance Zone neckline seems sustained
- Nifty timidly shy from creating a New Lifetime High by crossing ATH final hurdle remains effectively elusive
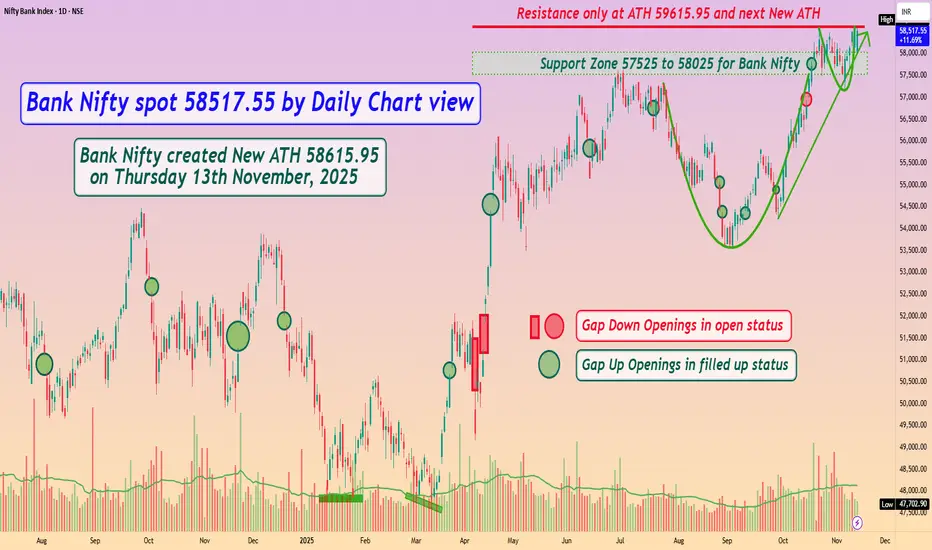
Bank Nifty spot 58517.55 by Daily Chart view - Weekly UpdateBank Nifty spot 58517.55 by Daily Chart view - Weekly Update
- Support Zone 57525 to 58025 for Bank Nifty
- Resistance only at ATH 59615.95 and next New ATH
- Bank Nifty created New ATH 58615.95 on Thursday 13th November, 2025
- Bullish momentum of Rounding Bottoms by Support Zone and Resistance Zone necklines well sustained
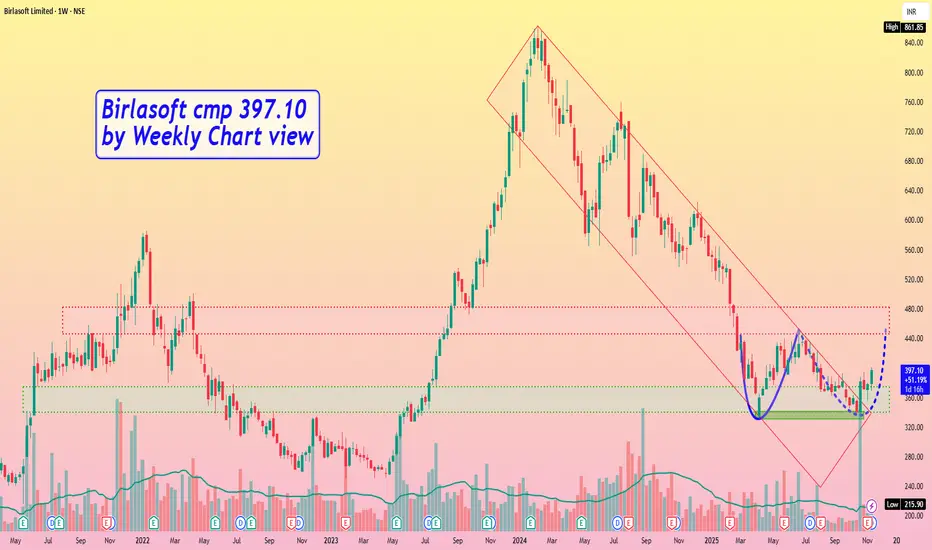
Birlasoft cmp 397.10 by Weekly Chart viewBirlasoft cmp 397.10 by Weekly Chart view
- Support Zone 340 to 375 Price Band
- Resistance Zone 446 to 482 Price Band
- Falling Price Channel Breakout seems been sustained
- Bullish "W" Double Bottom seems to be in the making process
- Fresh Breakout subject to Resistance Zone crossover and closure above it for few days
Sambhv Steel Tubes cmp 121.45 by the Daily Chart since listedSambhv Steel Tubes cmp 121.45 by the Daily Chart since listed
- Support Zone 107 to 116 Price Band
- Breakout done from the Falling Price Channel
- Rising Price Channel taking upside momentum
- Volumes gradually picking up indicating continued uptrend
- Resistance Zone 125 to 135 Price Band then 142 to ATH 149.25

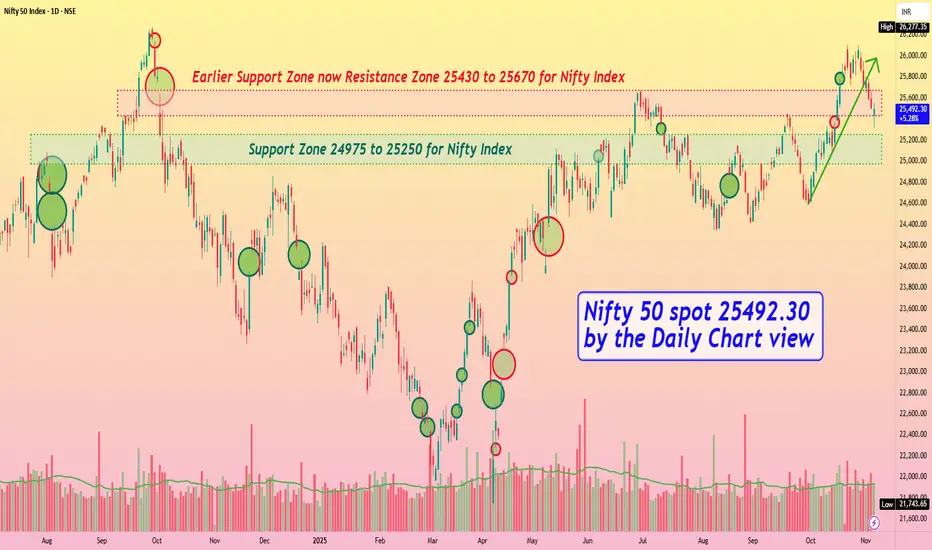
Nifty 50 spot 25492.30 by the Daily Chart view - Weekly updateNifty 50 spot 25492.30 by the Daily Chart view - Weekly update
- Support Zone 24975 to 25250 for Nifty Index
- Earlier Support Zone now Resistance Zone 25430 to 25670 for Nifty Index
- Rising Support Trendline Breakdown done basis the ongoing weak sentiments in general
- The final hurdle ATH remains elusive and Nifty keeps distinctly shy to create a New Lifetime High
Shriram Finance cmp 796.50 by Daily Chart viewShriram Finance cmp 796.50 by Daily Chart view
- Support Zone 728 to 760 Price Band
- Resistance only at ATH 814.15 done on Tuesday 04-Nov-2025
- The current Technical Chart setup is indicative of a very good upside with tentative target price level +/- 1025

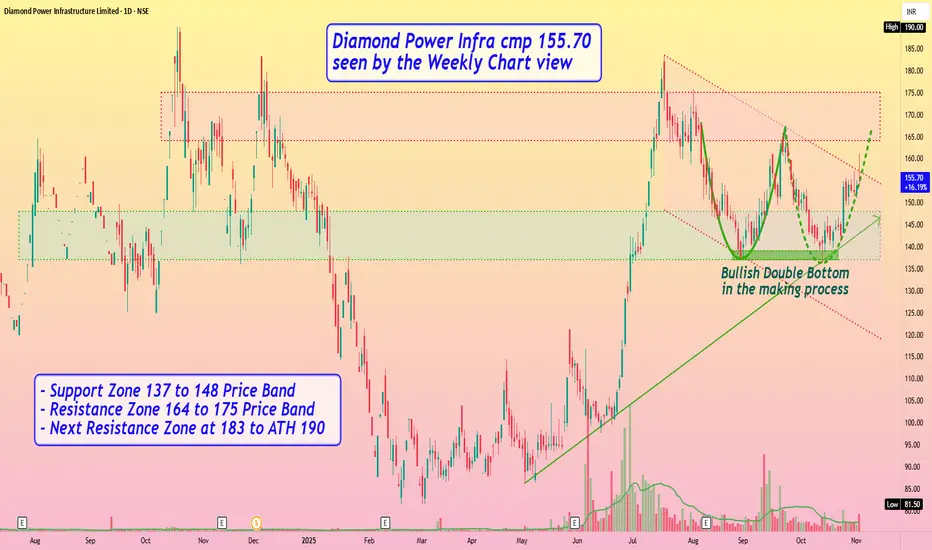
Diamond Power Infra cmp 155.70 seen by the Weekly Chart viewDiamond Power Infra cmp 155.70 seen by the Weekly Chart view
- Support Zone 137 to 148 Price Band
- Resistance Zone 164 to 175 Price Band
- Next Resistance Zone at 183 to ATH 190
- Bullish Double Bottom in the making process
- Rising Support Trendline seems well respected
- Volumes spiking regularly by close sync with avg traded qty
- Falling Price Channel Breakout seems to be in the making process
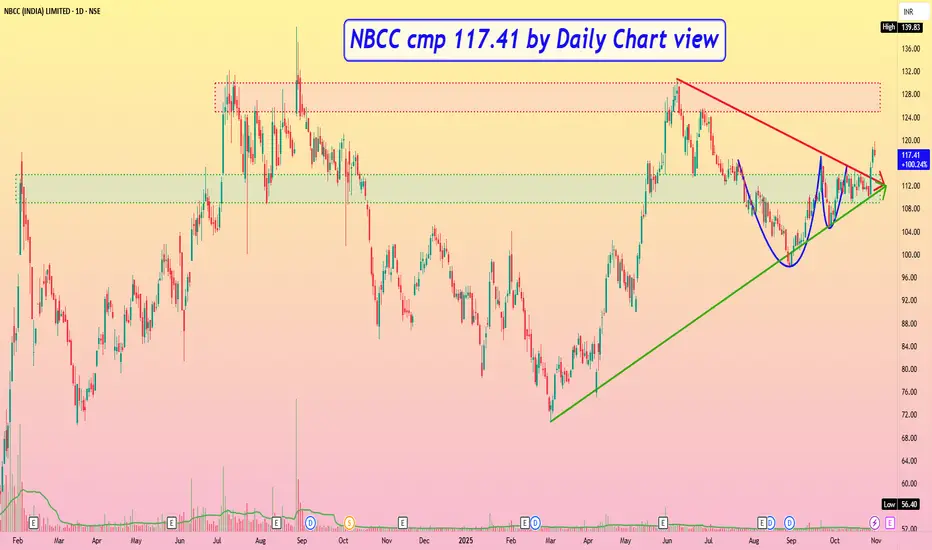
NBCC cmp 117.41 by Daily Chart viewNBCC cmp 117.41 by Daily Chart view
* Support Zone 109 to 114 Price Band
* Resistance Zone 125 to 130 Price Band then 137 to ATH 139.83
* Bullish Cup and Handle pattern is made around the Support Zone
* Symmetrical Triangle pattern breakout seems to be in making process
* Volumes in good sync with avg traded quantity and spiking above it too
* Falling Resistance Trendline Breakout with Rising Support Trendline well respected
Edelweiss Financial Services cmp 120.61 by Daily Chart viewEdelweiss Financial Services cmp 120.61 by Daily Chart view
- Support Zone 107.50 to 113.50 Price Band
- Resistance Zone 123.50 to 129.50 Price Band
- Falling Resistance Trendlines Breakout been attempted
- Price rejection couple of times on approaching Resistance Zone
- Volumes spiking regularly and in close sync with avg traded quantity
- Bullish patterns of Head & Shoulders followed by Cup & Handle and Rounding Bottom

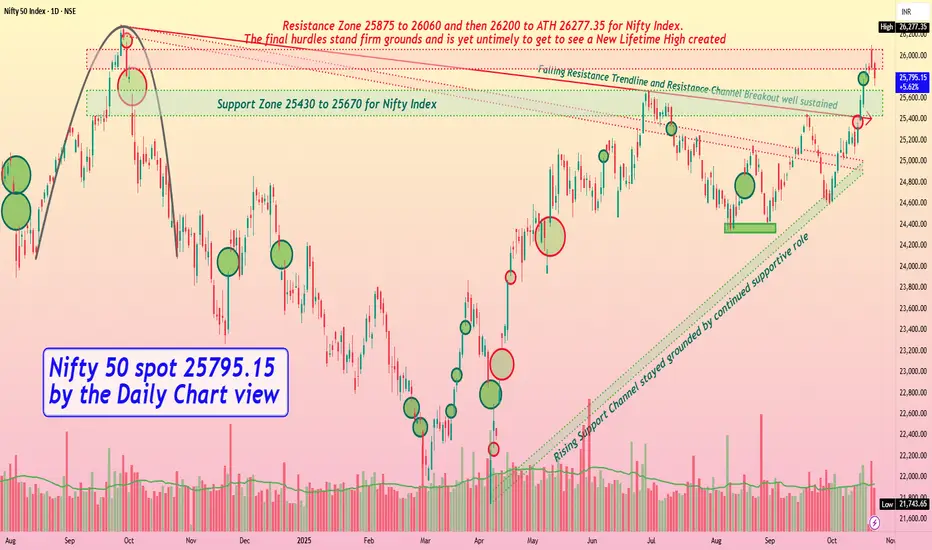
Nifty 50 spot 25795.15 by Daily Chart view - Weekly updateNifty 50 spot 25795.15 by Daily Chart view - Weekly update
- Support Zone 25430 to 25670 for Nifty Index
- Rising Support Channel stayed grounded by continued supportive role
- Falling Resistance Trendline and Resistance Channel Breakout well sustained
- Resistance Zone 25875 to 26060 and then 26200 to ATH 26277.35 for Nifty Index
- The final hurdles stand firm grounds and is yet untimely to get to see a New Lifetime High created
- Nifty Index earlier shied away to cross the 25K level and now acting likewise to breach the ATH 26277.35 mark
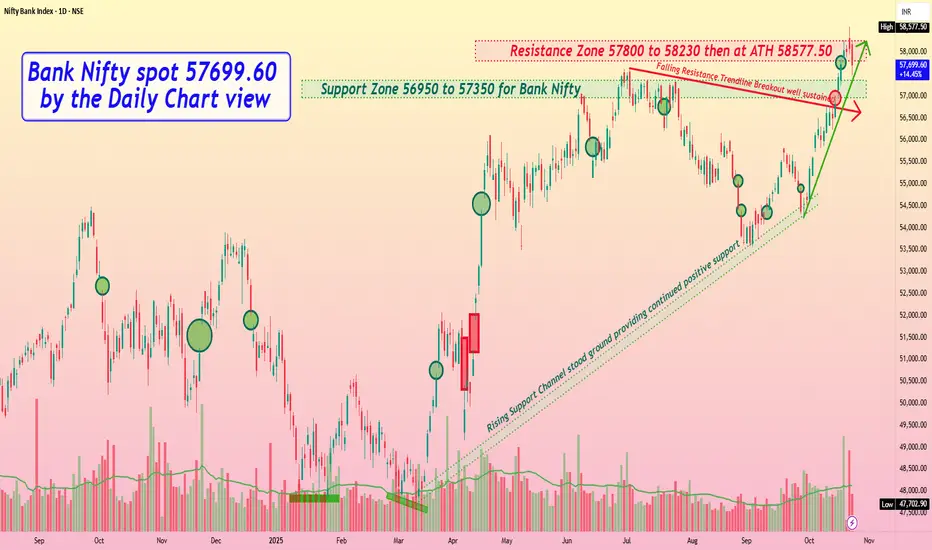
Bank Nifty spot 57699.60 by the Daily Chart view - Weekly updateBank Nifty spot 57699.60 by the Daily Chart view - Weekly update
- Support Zone 56950 to 57350 for Bank Nifty
- Resistance Zone 57800 to 58230 then at ATH 58577.50
- Falling Resistance Trendline Breakout has been well sustained
- Gap Up Opening of 16th October remains vacant, may need to be filled and closed off
- Rising Support Channel stood supportive ground and Rising Trendline seems in active mode
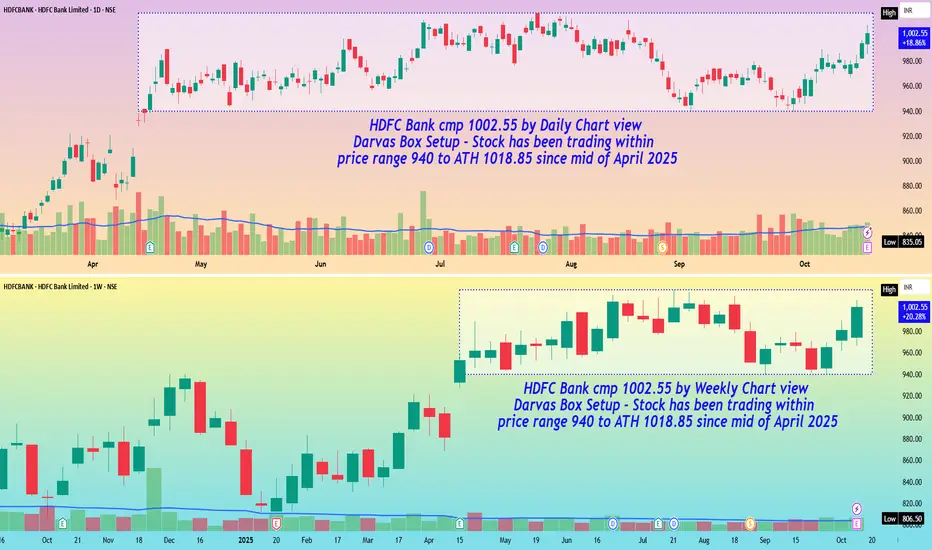
HDFC Bank cmp 1002.55 by Daily and Weekly Chart viewHDFC Bank cmp 1002.55 by Daily and Weekly Chart view
- Darvas Box Setup : Stock has been trading within price range 940 to ATH 1018.85 since mid of April 2025
- Stock chart has made Bullish Rounding Bottoms on both timeframes providing a technically logical upside target of +/- 1100 in the near future
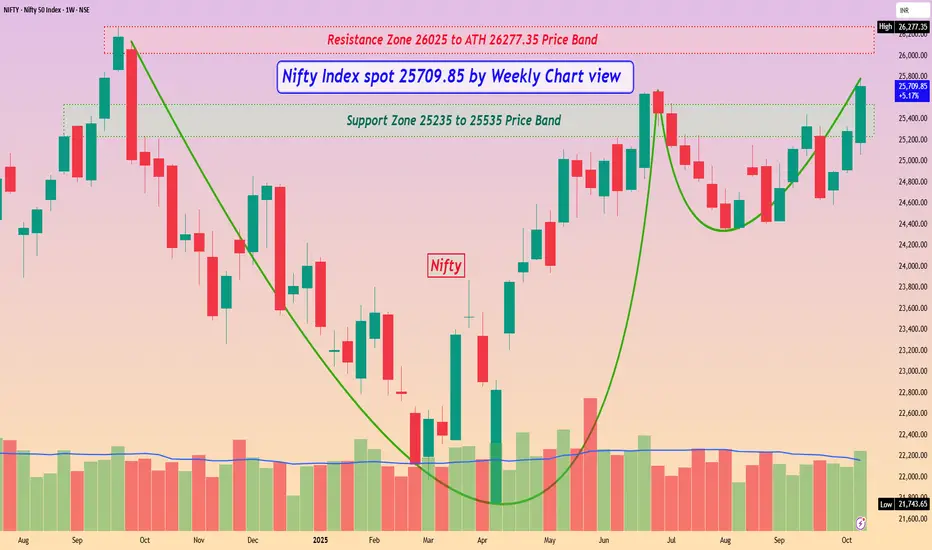
Nifty Index spot 25709.85 by Weekly Chart viewNifty Index spot 25709.85 by Weekly Chart view
- Support Zone 25235 to 25535 Price Band
- Resistance Zone 26025 to ATH 26277.35 Price Band
- Crystal Clear Bullish Cup & Handle formed around Support Zone
- Lets hope for the best to happen based on this Nifty 50 Index Chart setup
- Sharing this beautiful Nifty Index Chart setup, courtesy by a curious Co-Learners observation 😊👍🏽🤞🏽
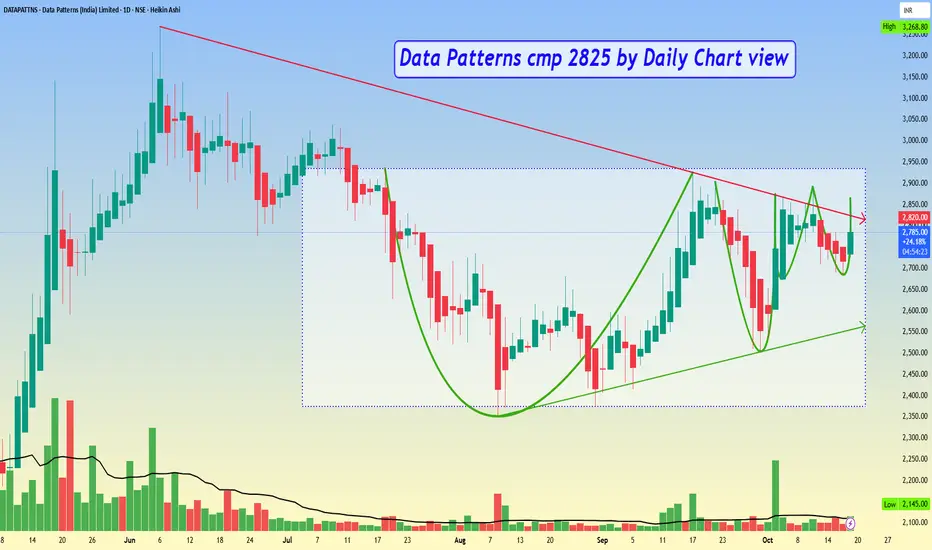
Data Patterns cmp 2825 by Daily Chart viewData Patterns cmp 2825 by Daily Chart view
* Support Zone 2585 to 2685 Price Band
* Resistance Zone 2935 to 3065 Price Band
* Stock has made a near tight and contracting VCP pattern
* Falling Resistance Trendline Breakout in the making process
* Darvas Box pattern with price trending between 2375 to 2935
* Bullish Rounding Bottom formed by the Resistance Zone neckline
* Volumes spiking intermittently by good numbers over past few weeks
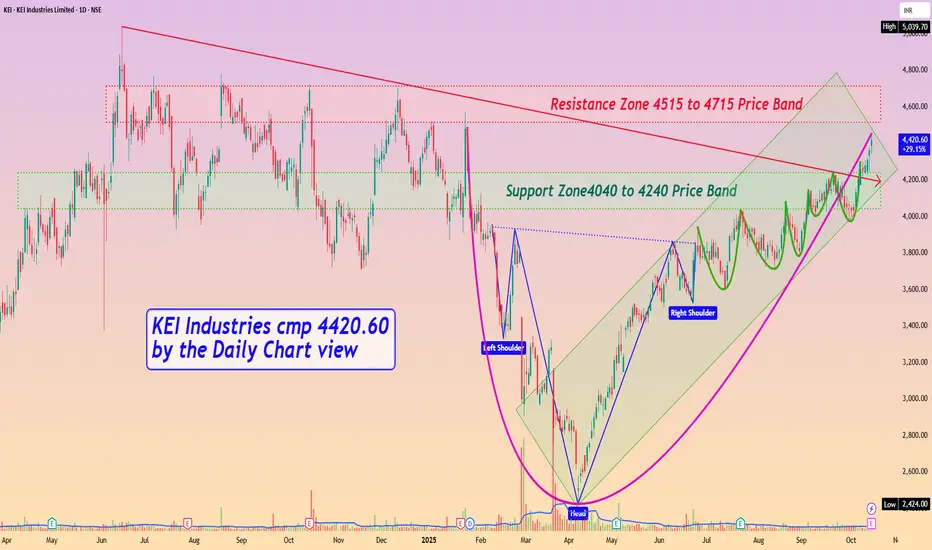
KEI Industries cmp 4420.60 by Daily Chart viewKEI Industries cmp 4420.60 by Daily Chart view
- Support Zone4040 to 4240 Price Band
- Resistance Zone 4515 to 4715 Price Band
- Falling Resistance Trendline Breakout seems sustained
- Support Zone under test retest phase over the past few days
- Price seen is traversing inside Rising Parallel Parallel Price Channel
- Volumes are seen to be in close sync with the average traded quantity
- Multiple Bullish Patterns formed of Rounding Bottom, Head & Shoulder and a tight VCP too