XAUUSD| Unstoppable Uptrend, Gold Benefits from Fed & ETF Inflow📊 Market Context
Gold continues to maintain its upward trend amidst the political and economic instability in the US. The US government has entered its second week of shutdown with no signs of reaching an agreement, raising further concerns about the impact on economic performance.
Simultaneously, the Fed's entry into a monetary easing cycle since September, with expectations of further 25-point rate cuts in October and December, is driving strong buying momentum in gold.
Not just investors, but global central banks are also continuing to accumulate gold, adding 15 tonnes to reserves, indicating a gradual shift away from US public debt.
All these factors combined continue to reinforce a sustainable upward trend, opening up opportunities for strategic BUY moves.
🔎 Technical Analysis (H1/H4)
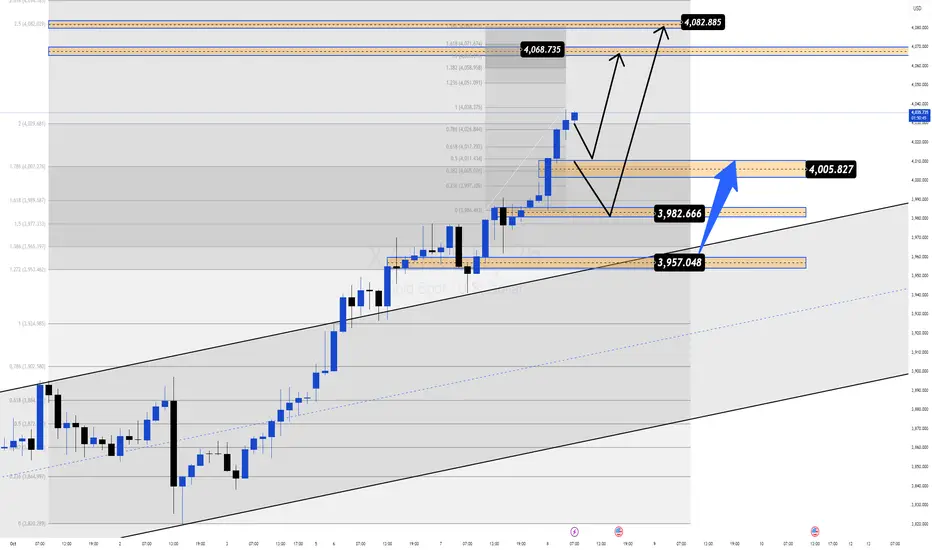
Prices remain within the upward channel, continuously retesting and bouncing off support zones.
Buy Scalp Zone 4004–4002: a quick reaction zone in the short term.
Main Buy Zone 3986–3984: key support, combined with FVG.
Target Resistance: 4068–4082 (Liquidity Zone).
📈 Trading Plan
✅ BUY SCALP: 4004–4002
SL: 3996
TP: 4008 - 4012 - 4016 - 4020 - 4030 - 4040 - ????
✅ BUY ZONE: 3986–3984
SL: 3980
TP: 3990 - 3995 - 4000 - 4010 - 4020 - 4030 - 4040 - ????
⚠️ Risk Management Note
The 4000 level is a psychological resistance – prone to liquidity sweeps.
Prioritise waiting for clear price action signals at BUY zones.
Adjust volume sensibly as volatility may increase with political news & Fed impacts on market sentiment.
✅ Summary
Gold's uptrend remains solid thanks to political instability, Fed easing, record ETF inflows, and central banks continuing to hoard gold. Strategy prioritises BUY at 4004–4002 and 3986–3984 with targets aiming at 4068–4082.
Technicalindicators
Bulls Reloading After a Healthy Pullback | Next Target: 4090+📊 Market Context
After a powerful bullish rally that pushed gold to record highs, XAUUSD retraced about 1% on Thursday as traders took profit from the recent surge. However, this move appears to be a technical correction, not a trend reversal — as indicators have shown overbought conditions for several sessions.
Despite this short-term pullback, the long-term uptrend remains intact.
Gold is up more than 50% year-to-date, driven by:
🌍 Ongoing geopolitical and trade tensions,
💰 The Federal Reserve’s monetary easing cycle,
🏦 Record central bank gold accumulation,
⚔️ Rising global uncertainty, fueling strong safe-haven demand.
Overall, this retracement could be an ideal setup for BUY re-entries, as bulls look to reload positions toward the 4090–4100 liquidity zone.
🔎 Technical Analysis (H1/H4)
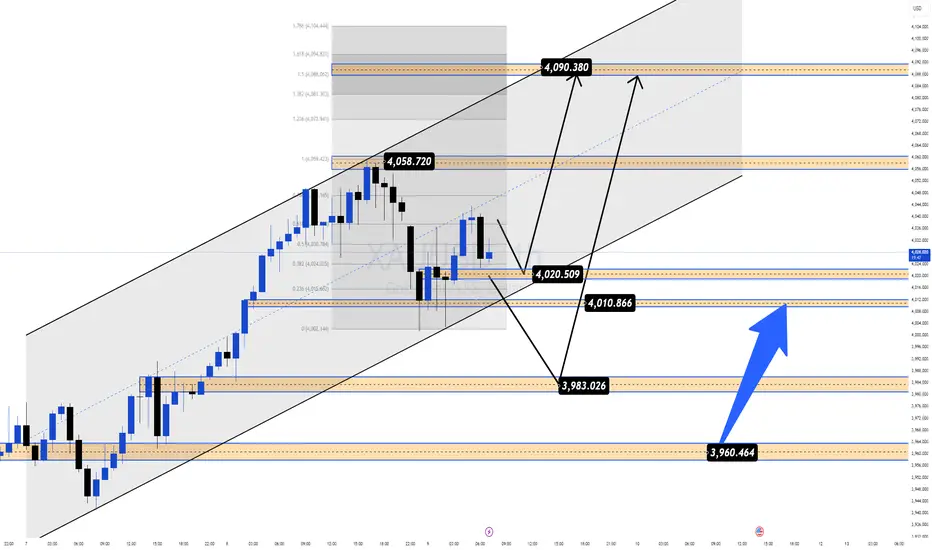
Price remains inside the medium-term bullish channel, showing strong reactions around 4000–3980 support.
4010–4008 acts as a quick scalp zone for short-term entries.
3984–3982 serves as a key structural support and liquidity reaction area.
4090–4092 (Liquidity Sell Zone) stands as the major resistance — potential liquidity trap area.
📈 Trading Plan
✅ BUY SCALP: 4010–4008
SL: 4002
TP: 4015 - 4020 - 4030 - 4040 - 4050 - ????
✅ BUY ZONE: 3984–3982
SL: 3978
TP: 3990 - 3995 - 4000 - 4005 - 4010 - 4020 - ????
✅ SELL ZONE: 4090–4092
SL: 4098
TP: 4085 - 4080 - 4070 - 4060 - 4050 - ????
⚠️ Risk Management Notes
The 4000 level remains a strong psychological and structural support — only enter long positions with confirmed price action signals.
Be cautious around 4090–4100, where liquidity sweeps and false breakouts are likely.
Adjust position size properly to manage volatility during high-impact news or geopolitical updates.
✅ Summary
Gold is undergoing a healthy correction phase within its broader uptrend.
The strategy remains BUY-focused at 4010–4008 and 3984–3982,
with upside targets toward 4060–4090,
and a potential short-term SELL opportunity near 4090–4092 if rejection signals appear.
💡 MMFLOW TRADING – Trade with market structure, follow liquidity, and ride the BIGWIN setups!
GOLD XAU/USD – Intraday Plan | Bulls Targeting 4,000$Gold has once again proven its safe-haven dominance, pushing close to 3,980$ during the Asian session. Despite USD fluctuations and global market risk-on vibes, buyers remain firmly in control. The psychological milestone of 4,000$ is now directly in focus.
🔎 Technical Snapshot (M30)
Trend remains bullish, supported by the Fibo channel.
Dip-buying pressure continues to dominate intraday price action.
Sellers will only gain short-term control near the 3988 – 4000$ resistance zone.
🔑 Key Trading Levels
BUY Zone (Fibo 0.618): 395x → Ideal intraday demand.
Support Zone: 393x → Must hold for bullish structure.
Immediate Resistance: 397x → Current ATH zone.
SELL Reaction Zone: 3988 – 4000$ → Potential short scalp.
Major Resistance: 4000 – 4006$ → Strong psychological wall.
📌 Trading Plan (FranCi$$ Style)
✅ BUY on Dips
Entry: 395x – 393x
Targets: 3975 → 3988 → 4000$
Stop Loss: Below 392x
⚡ SELL Scalp
Entry: 3988 – 4000$
Targets: 3970 → 3950$
Stop Loss: Above 4015$
🎯 Final Take
Gold’s path remains upward, but the 4000$ barrier is where bulls meet the biggest challenge. Smart traders will look to buy dips for continuation and use scalp sells only at strong rejection zones.
🔥 Stay tuned with FranCi$$ for realtime intraday updates – precision signals, scalping setups, and golden opportunities!

[INTRADAY] #BANKNIFTY PE & CE Levels(08/10/2025)Bank Nifty is expected to open flat near the 56,200 level after a strong rally in the previous sessions. The index has been consolidating within a narrow range, suggesting a pause before the next directional move.
On the upside, a sustained move above 56,450–56,500 could trigger a bullish breakout, leading to an upside toward 56,650, 56,850, and 56,950+. A breakout above 56,950 will further strengthen the bullish momentum and may push the index toward new short-term highs.
On the downside, immediate support lies around 56,050–55,950. A breakdown below this zone may lead to mild selling pressure, dragging the index toward 55,750, 55,650, and 55,550-.
Overall, the sentiment remains cautiously positive. Traders should wait for a confirmed breakout or breakdown from the current consolidation zone before initiating fresh positions, while maintaining strict stop-loss levels.

Gold Near ₹4000, BofA Warns of Mid-Cycle Adjustment 📊 Market Context
Gold prices are inching closer to the ₹4,000/oz mark, but a fresh warning from Bank of America has made the market cautious. Strategist Paul Ciana notes that gold is over 20% above the MA200 – a level seen before sharp corrections in historical peak cycles (2008, 2011, 2020, 2022).
However, medium-term forecasts from Goldman Sachs, UBS, and even BofA still suggest that gold could reach ₹4200–₹4900/oz next year. This means the long-term upward trend is still intact – but the current phase is prone to unexpected corrections to shake off FOMO buying pressure.
🔎 Technical Analysis (H1/H4)
Prices are fluctuating near the ATH Zone and the crucial liquidity area around ₹3990–₹4000.
Buy Zones: ₹3935–₹3933 (CP zone & FVG reaction) offer an opportunity to accumulate orders.
Sell Zone: ₹3993–₹3995 (Liquidity Zone) – a liquidity trap is likely when prices approach the ₹4000 mark.
🔑 Key Levels
BUY Zones: ₹3935–₹3933, main support at ₹3910.
SELL Zone: ₹3993–₹3995, closely watch liquidity.
Psychological resistance: ₹4000.
📈 Scenario & Trading Plan
✅ BUY ZONE 1: ₹3935–₹3933
SL: ₹3927
TP: ₹3940 - ₹3945 - ₹3950 - ₹3960 - ₹3970 - ₹3980 - ???
✅ SELL ZONE: ₹3993–₹3995
SL: ₹4000
TP: ₹3988 - ₹3984 - ₹3980 - ₹3970 - ₹3960 - ???
⚠️ Risk Management Notes
The ₹3990–₹4000 area is extremely liquid – a peak sweep is likely before reversal.
Only enter trades with clear price action confirmation, avoid FOMO as prices near the psychological mark.
Adjust volume sensibly as volatility may be higher than usual with the market debating the risk of a “mid-cycle correction”.

Gold Breaks $3900: Safe-Haven Demand Soars & Fed Fuels the Rally📊 Market Context
Gold continues to assert its strength by breaking the psychological barrier of $3,900, becoming the central asset amidst financial and political turmoil.
US government shutdown → defensive capital flows strongly into gold.
Fed expected to cut interest rates by another 0.25 points → further strengthens the advantage for the non-yielding precious metal.
Lack of economic data → investors closely follow private reports, adding uncertainty and supporting gold's role as the “number 1 safe haven”.
👉 Market sentiment is perfectly aligned: USD under pressure, capital moving away from risky assets, BUY side FOMO continues to amplify → gold stands before the opportunity to climb and conquer the 3950–3990 range.
🔎 Technical Analysis (H1/H4)
Main trend: Strong uptrend, price holding above the rising trendline.
BUY ZONE 1: 3904–3902 → Volume CP Zone, supports momentum.
BUY ZONE 2: 3885–3883 → Retest old ATH, accumulation zone for the next rally.
SELL Zone: 3949–3950 → Liquidity Zone, prone to liquidity traps.
Extended target: 3994 (Fib 3.618).
🔑 Key Levels
BUY Zones: 3904–3902, 3885–3883
SELL Zone: 3949–3950
Resistance: 3950, 3994
Support: 3900, 3880
📈 Scenario & Trading Plan
✅ BUY ZONE 1: 3904–3902
SL: 3898
TP: 3910 - 3915 - 3925 - 3935 - 3945 - ???
✅ BUY ZONE 2: 3885–3883
SL: 3878
TP: 3895 - 3905 - 3920 - 3935 - 3945 - ???
⚠️ SELL ZONE (scalp/trap): 3949–3950
SL: 3955
TP: 3940 - 3935 - 3925 - ???
⚠️ Risk Management Notes
Liquidity may sweep above 3950 before adjusting → need to wait for price action confirmation.
Avoid FOMO at the peak, prioritize BUY only when price adjusts to support zones.
Order volume should be slightly reduced before unexpected Fed policy announcements.
✅ Summary
Gold is in the “golden phase” of an uptrend: political instability + dovish Fed + safe haven demand = BUY is the main strategy. Plan to accumulate around 3904–3902 and 3885–3883, with an extended target of 3950–3990. SELL is only a short-term strategy at the liquidity zone.
📢 Follow MMFLOW TRADING for real-time updates & BIGWIN setups with the team!

GOLD Marching Toward $4,000 Zone? Gold Holds Firm Above 3,900Gold starts the week with relentless bullish momentum, breaking through 3,900 USD for the first time and eyeing new record highs.
The rally is fueled by safe-haven demand as the US government shutdown drags on and market expectations grow for an upcoming Fed rate cut. Despite a stronger USD and risk appetite in equities, gold buyers remain firmly in control.
🔎 Technical Outlook (H1 – FIBO Matrix)
📍 Reaction Buy Zones
3884 – 3880 (Fibo 0.5 support) → Short-term demand pocket.
386x (Fibo 0.618 H1) → Stronger liquidity-backed support, high-probability rebound zone.
📍 Reaction Sell Zones
393x – 394x (Fibo Extension 1.5 – 1.618) → Intraday resistance, possible rejection.
4,000 (Psychological Round Level) → Key psychological barrier; heavy liquidity likely.
🎯 Trade Plan
1️⃣ BUY Scenario
Entry: 3884 – 3880 / 386x, wait for bullish confirmation.
Targets: 3925 → 3940 → 4000.
Stop Loss: Below 3850.
2️⃣ SELL (Short-term Scalp)
Entry: 393x – 394x or rejection at 4000.
Targets: 3900 → 3884.
Stop Loss: Above 3952.
⚡ Key Insights
Trend bias remains bullish → Prefer long setups from strong Fibo supports.
3925 is the immediate hurdle, 4000 the ultimate psychological wall.
Watch USD volatility and Fed commentary for intraday direction.
💬 What’s your take, India?
Do you expect Gold to hit 4,000 this week, or will sellers defend the zone? Drop your setups 👇

Gold Soars on FOMO – 1000-Pip Opportunity Ahead!GOLD PLAN FOR 06.10 | Captain Vincent
✳️ Hello to all traders,
Today, we are not only analysing Gold (XAU/USD) from a purely technical perspective ⚙️, but also witnessing the perfect confluence between technicals and fundamental news. A bullish storm is forming, promising attractive trading opportunities.
📊 1. Technical Analysis: Sustainable Bullish Structure
From a technical standpoint, the uptrend of Gold on the H1 chart is undeniable.
🔹 Break of Structure (BoS):
Gold continuously breaks previous highs, indicating that buying pressure is completely dominant.
Each BoS point is a clear affirmation of the strength of the uptrend.
🔹 Potential Demand Zone:
After each rally, the price often takes a “pause” to accumulate.
Currently, the price may adjust to the $3,883,020 - $3,911,169 zone, where the confluence between Fair Value Gap (FVG) and Bullish Order Block (Bullish OB) – creates an ideal launchpad for the next rally.
🏦 2. Fundamental Analysis: The Fire Has Been Lit
If technicals show the way, then fundamental news is the fuel driving the uptrend.
🔸 US Government Shutdown:
This event creates political and economic instability, causing capital to flee from risky assets.
Gold – the number one safe haven – is directly benefiting as investors seek to preserve their assets.
🔸 Fed Ready to Cut Interest Rates:
The market is almost certain that the Fed will cut interest rates by 0.25%.
This reduces the appeal of the USD, further strengthening Gold's advantage, which is a non-yielding asset.
🔸 “Thirst” for Economic Data:
The government shutdown also disrupts the release of important economic data, leaving the market lacking information and increasing uncertainty.
In this environment, Gold continues to hold its safe haven role.
🎯 3. Comprehensive Trading Plan
When technicals and fundamentals align, the reliability of the trading strategy is significantly enhanced.
Strategy:
Wait to buy (Long) when the price adjusts to the demand zone $3,883,020 - $3,905,169.
Entry signals:
Observe confirmation of a bullish reversal in this zone such as:
Pin bar candles, engulfing
Or BoS on the M15 chart
Targets:
Short-term: $3950 – $3990
Long-term: Target “+1000 pips”
Risk management:
Place Stop Loss below the Bullish OB to protect the account.
🧭 Conclusion
The current market sentiment is very favourable for the Buyers:
USD is under downward pressure
Defensive capital flows are strongly moving into Gold
The FOMO effect can stimulate an extended rally
The combination of a solid technical structure and strong fundamental support is creating an almost perfect bullish picture.
👉 Be patient, stick to the plan, and await this golden opportunity.
💼 Wishing everyone an effective and victorious trading day!

US Government Shutdown, Gold Benefits & FOMO BUY Continues📊 Market Context The gold market kicks off Q4/2025 with great enthusiasm as safe-haven flows continue to surge.
Not only that, the potential delay of the NFP employment report this week further fuels the market's "thirst" for directional information, positioning gold as the central asset in everyone's sights. Meanwhile, the USD is under pressure from political uncertainties and expectations that the Fed is moving closer to further rate cuts.
Combined, the current picture shows that gold is not only maintaining its strength after a breakout rally but also has the opportunity to expand and conquer new high price territories, as safe-haven capital and FOMO momentum from the BUY side continue to amplify.
🔎 Technical Analysis (H1/H4)
The price maintains the main upward trend, staying above the support structure.
Important BUY ZONE: 3833–3831 (Fibo + CP zone) – this area is likely to react strongly.
Secondary BUY ZONE: 3817–3815 (OBS zone) – stronger support, suitable for accumulating additional BUY orders.
Resistance area 3919–3923 (Liquidity Sell Zone) may be where liquidity traps appear.
✅ BUY ZONE 1: 3833–3831
SL: 3827
TP: 3838 - 3842 - 3846 - 3850 - 3855 - 3860 - 3870 - ???
✅ BUY ZONE 2: 3817–3815
SL: 3810
TP: 3822 - 3826 - 3830 - 3835 - 3840 - 3850 - 3860 - 3870 - ???
✅ Summary Gold is directly benefiting from political instability and the delay in US economic data. The main trend remains BUY with safe-haven flows, with strategic zones at 3833–3831 and 3817–3815. The expansion target aims for 3870–3880 and beyond to 3920+ if buying momentum remains strong.

XAUUSD – Gold Bulls Eye New Highs | Francis FiboMatrix Plan📊 Market Outlook
Gold keeps climbing with momentum, now approaching the 3,800$ zone. The market is fuelled by expectations of more Fed rate cuts and rising demand for safe-haven assets as global uncertainties stay elevated.
Silver is also breaking higher, heading toward its historic $50 target, confirming the broader strength in precious metals.
📍 Trading Levels
✅ BUY Zone: 3782 – 3780
🛑 Stop Loss: 3772
🎯 Take Profits:
TP1 → 3800
TP2 → 3829
TP3 → 3848
TP4 → 3885+ (long-term hold if 377x holds support)
⚡ Trading Plan
Only look for BUY setups on dips – no shorting in this phase.
Keep position sizing balanced; trail stops once price moves past 3829.
Bias remains bullish as long as gold holds above 377x support.
💡 Francis Note
This is not just a trade – it’s part of the bigger wave. Play the retracements smart, respect risk, and let the trend do the heavy lifting.
💬 Your View?
Is gold ready to break beyond 3,885 → 3,900, or will we get a quick pullback first? Drop your charts and setups below 👇

XAUUSD – FIBO MATRIX Trading Plan | Key Levels for TodayMarket Snapshot
Gold is attracting steady buying interest as dovish Fed expectations keep the USD capped near 3-week highs.
At the same time, geopolitical tensions and tariff concerns add to safe-haven demand.
Focus now shifts to US PCE inflation data, which could trigger the next big move.
📍 Important Price Zones (M30)
🔴 SELL Reaction Zones
3767 – 377x → Major rejection area (Fibo 0.786).
3810 – 3817 → Strong SELL zone (Fibo 1.5 – 1.618).
🟢 BUY Support Zones
3725 → First support zone.
3690 – 3695 → Deep pullback support (Fibo confluence).
🎯 Trading Ideas
1️⃣ SELL Setup
Entry: 3767 – 377x (if rejection signal shows).
Targets: 3750 → 3725.
SL: Above 3778.
2️⃣ BUY Setup
Entry: 3725 with bullish confirmation.
Targets: 3760 → 377x.
SL: Below 3715.
3️⃣ Deep BUY Opportunity
Entry: 3690 – 3695 zone.
Targets: 3725 → 3760.
SL: Below 3685.
⚡ Trading Insights
Respect the Fibo reaction levels for clean entries.
Risk range: 6–8 USD to avoid stop hunts.
Book profits in steps: 1R → 2R → 3R for strong RR balance.
💬 Community Talk
Do you see gold breaking above 3770 first, or dropping to 3725/3695 before bouncing back? Share your chart view 👇

XAUUSD – Wolfe Waves forming on H4 chart, clear correction signaHello Trader,
On the H4 chart, gold is forming a quite standard Wolfe Waves pattern. The 5th wave has completed, and the price is moving into the crucial resistance zone of 3760 – 3770, which is also a potential Sell Zone. Given the current structure, the preferred scenario is a short-term downward correction before the main trend resumes.
Technical Analysis
The price has touched the 2.618 Fibonacci Extension and reacted with a decline, indicating profit-taking pressure.
The MACD still shows the previous buying force was quite strong, but the histogram is starting to weaken, aligning with the possibility of a correction wave emerging.
Area 3760 – 3770: a critical resistance zone, also coinciding with the 5th wave line of Wolfe Waves.
Trading Scenario
Sell order according to Wolfe Waves
Entry: 3760 – 3770
SL: 3782 (above resistance zone)
TP: 3710 -3660 -3610 – 3620 (key level Wolfe target)
Sell when price confirms below trendline
Entry 3727-3730
sl 3735
tp 3715-3700-3686-3665
Short-term Buy Scalping
Entry: 3705 – 3708
SL: 3700
TP: 3720-3730 – 3745- 3766
Note: This is just a short-term retracement strategy, going against the correction, so risk management is crucial.
Conclusion
Short-term: Prioritise observing reversal signals at 3760 – 3770 to Sell.
Medium-term: Wait for Buy opportunities around 3564 – 3574 to align with the main trend.
The market is entering a distribution and correction phase, so patiently waiting for candle confirmations at key zones will be key to optimising entry.
This is the Wolfe Waves scenario I propose for gold during this period. You can refer to and adjust according to your own strategy.
Follow me for the fastest updates when the price structure changes.

XAUUSD – Daily Trading Plan
Hello Traders,
Gold opened the Asian session holding its price structure firmly. The 3708 level will be the key pivot today:
If price sustains above this level, the next upside targets are 3750 and possibly 3780.
If price reacts lower at 3708 resistance, then 3650 or even 355x could be the zones to watch for buying opportunities.
Fundamental Context
Last week’s correction was triggered by comments from the Fed Chair on interest rate policy. The Fed does not intend to cut rates too frequently, and this week’s PCE data will play a decisive role in shaping the outlook.
Trading Strategy for Today
Buy Setup
Entry: 3650 – 3653
SL: 3645
TP: 3662 – 3675 – 3690 – 3706 – 3725
Sell Setup 1
Entry: 3700 – 3703
SL: 3708
TP: 3690 – 3675 – 3662 – 3650 – 3633
Sell Setup 2
Entry: 3738 – 3740
SL: 3746
TP: 3725 – 3710 – 3700 – 3675 – 3650
Summary
The preferred bias for today is to look for buy opportunities on dips, in line with the broader uptrend.
Follow me to receive the latest updates as soon as market structure changes

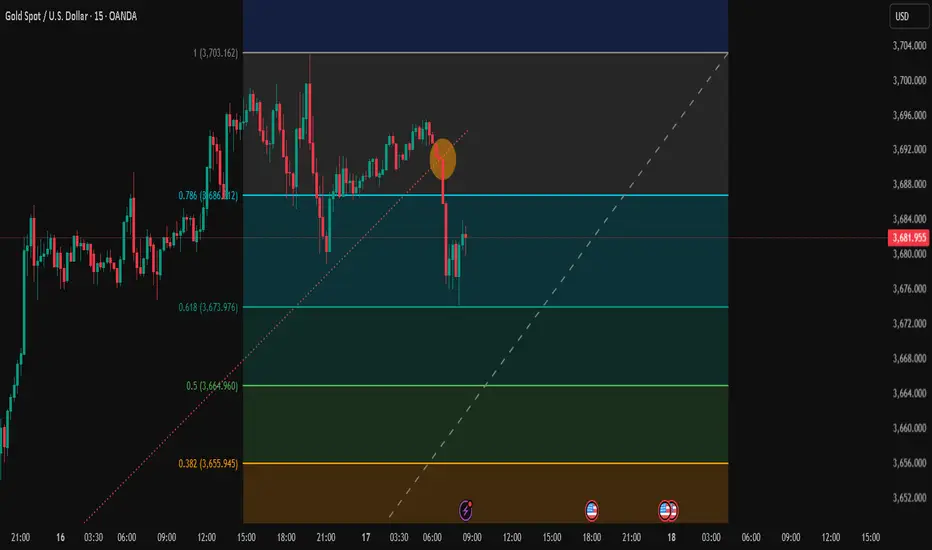
Trading Analysis for Gold Spot / U.S. Dollar (15-Minute Chart)Sell XAU/USD now at 3688.00 level and take a stop loss of 3703.00 and the targets will be as follows.
Entry range 3691.00 to 3687.00
Take Profit 1 = 3673.00
Take Profit 2 = 3665.00
Take Profit 3 = 3655.00
Take Profit 4 = 3645.00
Stock Loss 3703.00
Based on the provided 15-minute chart for Gold Spot / U.S. Dollar (XAU/USD), published by NaviPips on TradingView.com on June 30, 2025, at 17:53 UTC, here’s a suggested trading setup for a buy position:
Current Price and Trend: The current price is 3,241.875, with a slight increase of +0.250 (+0.01%). The chart shows a recent downtrend that appears to be stabilizing near the current level, suggesting a potential reversal point.
Buy Entry: Enter a buy position at 3,312.875 (current price), as it aligns with a support zone where the price has found a base, indicated by the horizontal dashed line and recent consolidation.
Stop Loss: Place a stop loss at 3,295.250, below the recent low, to protect against further downside. This level is approximately 10.625 points below the entry, defining the risk.
Take Profit Levels:
Take Profit 1: 3,317.875, a conservative target about 20.000 points above the entry, aligning with a minor resistance zone.
Take Profit 2: 3,324.750, a mid-range target approximately 31.875 points above the entry.
Take Profit 3: 3,332.500, a deeper target about 45.625 points above the entry, indicating a potential trend reversal.
Price Action: The chart indicates a downtrend with a possible bottoming pattern near the current level. The support zone and upward candlestick suggest a buy opportunity if the price holds.
Risk-Reward Ratio: The distance to the stop loss (10.625 points) compared to the take profit levels (20.000 to 45.625 points) offers a favorable risk-reward ratio, ranging from approximately 1:1.9 to 1:4.3.
Conclusion
Enter a buy at 3,241.875, with a stop loss at 3,295.250 and take profit levels at 3,317.875, 3,324.750, and 3,332.500. Monitor the price action for confirmation of an upward move, and be cautious of a potential continued downtrend if the price breaks below the stop loss level. (Note: I assume "take profot" was a typo for "take profit" and have corrected it accordingly.)
XAUUSD H1 – Pennant + Head & ShouldersXAUUSD H1 – Pennant + Head & Shoulders: Two Key Levels 3657 / 3627
Hello Traders,
Gold opened the week with a bounce of over 20 points from the rising trendline and is now consolidating within a Pennant, which aligns with a small Head & Shoulders structure on the H1 chart. At the moment, the market is waiting for a breakout and confirmation to establish a clearer direction.
Pattern: A narrowing Pennant Flag alongside an H&S (left shoulder – head – right shoulder).
Key Zones to Watch
3655–3660: Crucial reaction zone (trendline + Pennant top).
3627: Critical support — a break below would invalidate the short-term bullish structure.
Fibonacci Levels:
1.618 in the mid-range, 2.618 lower — possible targets for a deeper correction.
MACD (12,26,9): Histogram has turned negative → short-term bearish momentum has the edge, though clear confirmation is still pending.
Trading Scenarios
Bullish Setup
Entry: Retest around 3654–3657
Targets: 3663 – 3670 – 3680 → 3695
Stop: Below 3648
Bearish Setup
Entry: Sell directly on breakdown, or wait for a retest near 3671–3674
Targets: 3663 – 3650 – 3633 – 3615 → 3595 → 3568 → 3540
Stop: Above 3679
the market is currently pricing in near certainty of a 0.25% Fed rate cut on 17th September, while the probability of a 0.50% cut still remains on the table.
If you find this analysis helpful, feel free to share your thoughts in the comments. I’ll update the outlook as soon as the price structure changes — follow me to get the latest setups first.

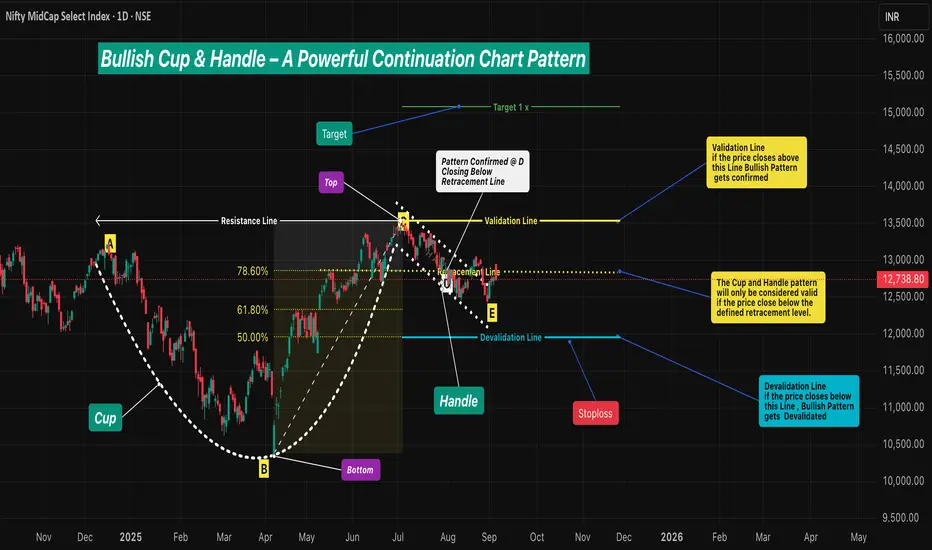
Bullish Cup & Handle – A Powerful Continuation Chart Pattern🔹 Intro / Overview
☕ The Cup and Handle is a 📈 bullish continuation pattern often studied in technical analysis.
⚔️ It forms when there is a fight between bulls 🐂 and bears 🐻 — the Cup develops as both remain strong.
📉 During the Handle, sellers 🛑 temporarily gain strength.
📈 But when price closes above the Validation Line, buyers regain control 💪 and bullish momentum dominates.
____________________________________________________________
📖 How to Identify
✅ Validation → The pattern is valid if price closes above the Validation Line.
❌ Devalidation → The pattern is invalid if price closes below the Devalidation Line(before Validation).
📉 Retracement Rule →The pattern is only confirmed if the price closes below the Retracement Line during the Handle formation.
This ensures a proper pullback forms before breakout .
____________________________________________________________
📖 Key Points of Pattern
✅ A valid Cup requires the retracement condition — confirmation occurs only if price closes below the Retracement Line .
⚖️ Balanced Highs → Point A (left peak) and Point C (right peak) should be relatively close in price, ensuring a proper Cup shape 🍵.
🔒 The Handle must not break the structural integrity of the Cup.(No Close Below Devalidation Lines)
____________________________________________________________
🎯 Trading Plan (Educational Only)
📌 Entry → Considered only after confirmation when price closes above the Validation Line.
🛡️ Stop-Loss (SL) → After validation, the Devalidation Line may act as an SL.
🎯 Target (TP) →
First Target → 1R (equal to the risk defined by Entry–SL distance).
Remaining Lots → Trail using ATR, Fibonacci levels, Box Trailing, or structure-based stops.
____________________________________________________________
📊 Chart Explanation
🍵 The Cup forms with a rounded base Point B and two balanced tops: Point A (left peak) & Point C (right peak) - The marginal price difference should be small to ensure a reliable Cup.
📈 The Retracement Line ( Point D ) confirms the pattern only if price closes below the Fibonacci Level of 78.60% and above the 50.00% .
📉 The Handle develops as price pulls back, with Point E marking the Handle low. and Good Handle of Cup is Formed (this low should not go below 50.00% Level )
📏 The Fibonacci retracement levels are drawn from Point B (Cup base) to Point C (right peak). These levels provide a reference framework to observe Retracement (minimum 78.60%) , Validation (100.00%) , and Devalidation (50.00%) areas for educational study of the structure.
____________________________________________________________
👀 Observations
✨ Works best after a strong uptrend 🚀 or at major support–resistance zones 🧱.
⚖️ A balanced Cup (Top Right ≈ Top Left) improves reliability.
📏 Handle Formation
The Handle should be shorter than the Cup depth — and should also be longer than the required minimum depth for proper structure.
If the Handle is too deep, it weakens the setup — and also if it is too short, the formation loses reliability.
____________________________________________________________
❗ Why It Matters
🔍 Shows the market battle between buyers and sellers.
💪 Highlights how buyers regain dominance after retracement validation.
⚖️ Balanced structure + strict rules = better filtering of weak setups.
📝 Provides clarity on entry, SL, and TP with a structured framework.
____________________________________________________________
🎯 Conclusion
The Cup and Handle pattern, when validated through Fibonacci retracement rules 📉, balanced highs ⚖️, and proper Handle structure 🔒, offers a disciplined framework for studying bullish continuation setups.
🔥 Patterns don’t predict. Rules protect.
____________________________________________________________
⚠️ Disclaimer
📘 For educational purposes only.
🙅 Not SEBI registered.
❌ Not a buy/sell recommendation.
🧠 Purely a learning resource.
📊 Not Financial Advice.
BTC/USD Supply Zone Rejection SetupThis BTC/USD 30-min chart shows price climbing within a rising channel toward a POI Supply Zone (114,201 – 114,940 USD). The market is respecting both the support line and rejection line while trading above the EMA 70 (111,733) and EMA 200 (112,102), indicating bullish momentum in the short term.
Key Analysis Using Strategies:
Trend/EMA Strategy: Price is above both EMAs, signaling bullish continuation until the supply zone.
Channel Strategy: Price is moving inside an ascending channel; upper channel resistance aligns with the supply zone, suggesting potential reversal.
Supply & Demand: Strong supply zone at 114,201–114,940 is the key resistance area to watch for rejection.
Price Action: After breakout from EMA and minor consolidation, price shows bullish structure with higher highs and lows.
Risk Management: Possible short entry at supply zone (114,201–114,940) with stop-loss above 114,940, and targets near 112,100 and 109,000.
📌 Summary: Short-term bullish toward supply zone, but a potential bearish reversal setup forms at 114,201–114,940 if rejection occurs, with downside targets around 112,100 → 109,000.

USOIL Bearish Reversal & Selling OpportunityUSOIL (WTI Crude Oil) – Bearish Setup Analysis
The chart shows a clear bearish structure with multiple confirmations:
Trendline Rejection & Break: Price rejected from the upper rejection line and later broke the rising trendline, confirming bearish momentum.
FVG (Fair Value Gap) Selling Zone: Price retested the imbalance zone (63.53–63.94), creating a strong selling opportunity.
EMA Confluence: Both the 70 EMA and 200 EMA are above the price, acting as dynamic resistance, supporting bearish bias.
Market Structure Shift (MSS): Breakdown of higher lows signals shift to bearish structure.
Target: Downside continuation expected towards 61.65, the next liquidity and support zone.
Stop Loss: Above 63.94 (selling zone invalidation).
📉 Strategy: Look for sell entries around 63.53–63.94 zone, with target at 61.65 and stop loss above 63.94.

EUR/USD Buy Setup from Support Zone towards 1.1743 TargetEUR/USD 2H Chart Analysis
The chart shows EUR/USD trading within a rising channel, with the price currently retesting the support zone (1.1600–1.1620).
Trend & Structure: Price has been respecting channel support and resistance. Currently, it bounced off the lower boundary of the channel, signaling a potential bullish reversal.
Support & Resistance: Strong support at 1.1600 zone, resistance/target at 1.1743.
Moving Averages: EMA 70 (1.1655) and EMA 200 (1.1648) are near, acting as dynamic resistance. A bullish break above them confirms upside continuation.
Candlestick & Momentum: Long wicks near support indicate buyer interest, suggesting accumulation before reversal.
Risk Management: Stop loss should be placed just below 1.1580 (last swing low).
✅ BUY Setup: From 1.1600–1.1620 support zone, targeting 1.1743 with stop loss below 1.1580.
📊 Strategies Used: Trendline channel, EMA confirmation, support/resistance, candlestick patterns, and risk-reward setup.

USD/JPY Bullish Continuation Towards 149.00This USD/JPY (1H) chart shows a bullish setup:
Price is respecting the ascending channel (support & rejection lines).
Currently, price is near the FVG (Fair Value Gap) zone between 147.257 – 147.526, suggesting a possible retracement before continuation upward.
Both EMA 70 & EMA 200 are aligned closely, acting as dynamic support.
A long entry is expected from the FVG zone with a target point at 148.975 – 149.002.
Stop-loss lies below the FVG around 147.251.
👉 Overall bias: Bullish continuation towards 149.00 after filling the FVG.

BTC/USD Bearish Retest Setup – Eye on 106.6K TargetTrend: BTC is in a downtrend channel (rejection line above, support line below).
EMA Signals: Price is trading below EMA 70 & EMA 200 → bearish bias remains strong.
Supply & Demand:
Support zone: around 112,000 – 112,500 (price just bounced).
RBR Supply zone: 114,300 – 116,000 where sellers are likely waiting.
📊 Strategies in play
Support–Resistance: Bounce at support, retest expected at supply zone.
EMA Strategy: Bearish since candles trade under 200 EMA.
Break & Retest: Price could retest supply before resuming drop.
Target Projection: If rejection at supply holds, target = 106,600 zone (chart target point).
⚖️ Risks
A clean break above 116,000 would invalidate bearish setup and open room for reversal.
Range trading possible between 112k–116k before breakout.
✅ Summary: BTC short-term bias remains bearish. Expect retest of 114.3k–116k supply before continuation lower toward 106.6k target. Only a strong breakout above 116k flips the trend bullish.

XAU/USD – Bullish Breakout: Buy Dips Toward $3,409 Target📊 XAU/USD (Gold) – 2H Analysis
Gold has just broken out of its descending channel, showing a clear change of character (CHOH) around the $3,348–$3,358 support zone. This breakout suggests bullish momentum is taking control after weeks of compression.
Key Observations:
✅ Support Zone: $3,348–$3,358 is now a strong demand zone (previous rejection area flipped to support).
✅ Moving Averages: Price is above both the EMA 70 ($3,342) and EMA 200 ($3,346), strengthening the bullish bias.
✅ Projection: A potential continuation rally toward $3,409 (major liquidity target).
⚠️ Risk: If the support zone fails, price could re-test $3,334 or even $3,326.
Trading Plan (Short-Term):
Entry (Buy): Around $3,358–$3,348 (support retest).
Stop Loss: Below $3,342 (under EMAs).
Target 1: $3,390
Target 2: $3,409
👉 In summary: Gold is in a bullish reversal phase, and buying dips into the support zone offers the best risk-reward setup.

EUR/USD Bearish Rejection at Resistance Zone – Target 1.15392📉 EUR/USD 1H Chart Analysis
Trend: The chart is showing a clear bearish trend inside a descending channel (support & rejection lines). Price continues to respect this downward structure.
Resistance Zone: A strong supply/resistance area is marked at 1.16148 – 1.16307 (highlighted in pink). Sellers are likely to defend this zone.
Indicators:
Price is trading below the 70 EMA and 200 EMA, confirming bearish momentum.
EMA crossover suggests continued downward pressure.
Price Action: Recently, a small pullback (yellow highlight) is visible after touching the lower boundary of the channel, indicating a short-term retracement before another bearish push.
Strategy:
📍 Entry: Look for short entries near the resistance zone (1.16148 – 1.16307).
⛔ Stop Loss: Above 1.16456 (previous high / EMA resistance).
🎯 Target: First target 1.15392, aligning with the projected channel support and marked demand area.
✅ Summary:
EUR/USD remains bearish as long as price stays below the EMAs and inside the descending channel. Expect rejection from the resistance zone and continuation to the downside toward 1.15392.
