How to Trade Nifty Using Demand & Supply ZonesWhen markets move sharply up or down, many traders often wonder “Where should I enter?” or “Where might a reversal happen?” — That’s where Demand and Supply zones become your best trading friends. Let’s decode this chart and see how you can trade Nifty smartly using this powerful concept.
🔎 A Smart Trader's Guide to Spotting High-Probability Reversals
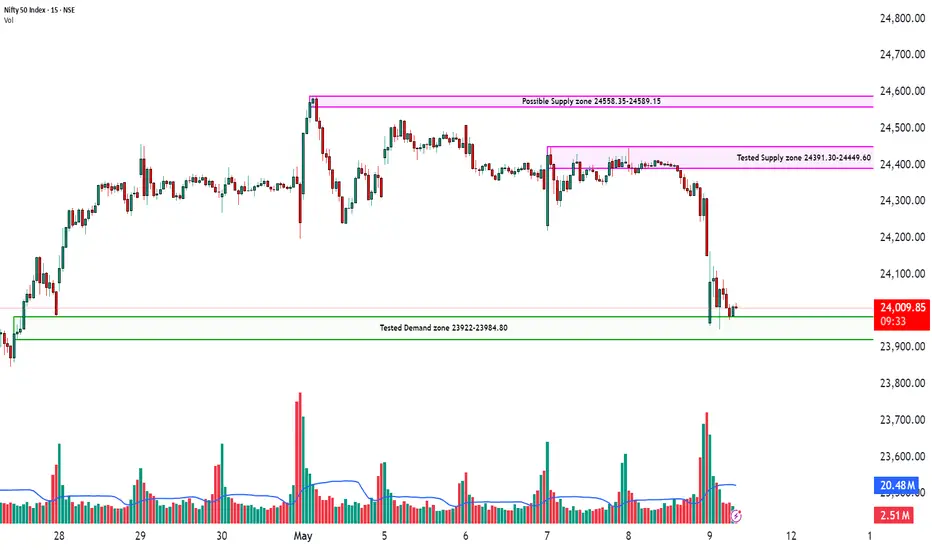
📍 Chart Timeframe: 15-Min | Index: Nifty 50
🖼️ Visuals Above: Key Demand & Supply Zones plotted with high-precision, backed by volume spikes and price rejection patterns.
🔍 What Are Demand & Supply Zones?
Think of demand and supply zones as institutional footprints.
Demand Zone = Where smart money is likely buying.
Supply Zone = Where smart money is likely selling.
These zones aren't random. They're created when large orders enter the market — and price reacts sharply. The idea is to follow where the "big boys" are placing their bets.
🧠 Why This Chart Matters:
In this Nifty 15-min chart, we’ve identified 3 key levels:
🟩 Tested Demand Zone: 23922 – 23984.80
This zone has already been tested and respected multiple times.
Price bounced cleanly from here again, showing active buying interest.
Volume confirms buyer presence — a sign that this zone still holds value.
🟥 Tested Supply Zone: 24391.30 – 24449.60
Sellers have defended this level previously.
It acted as a ceiling, pushing price back down.
If price returns here, be alert for shorting opportunities with bearish confirmation.
🟪 Possible Supply Zone (Untested): 24558.35 – 24589.15
This zone hasn’t been tested yet.
If price breaks above the first supply zone, this could be the next target or reversal point.
📈 How to Trade This Setup:
🟢 Long Trade Idea – Buy from Demand Zone
Entry: Near 23922–23984 (once price shows reversal candles or bullish volume)
Stop Loss: Just below 23922
Target: 24391–24449 (tested supply zone)
🔴 Short Trade Idea – Sell from Supply Zone
Entry: Near 24391–24449 (look for rejection wicks, volume drop)
Stop Loss: Slightly above 24449
Target: Demand zone near 23984
🔄 Breakout Opportunity
If price breaks above the tested supply zone with volume, watch for a quick move to the next supply zone near 24589.
Re-entry is possible on a retest of the broken zone.
🎯 Pro Trader Tip:
"Don’t chase price. Let it come to your zone. The highest probability trades happen when price enters a zone + confirms with volume."
⚠️ Disclaimer:
This analysis is for educational purposes only and does not constitute any investment advice or stock recommendation. Please consult with your financial advisor before taking any trading decisions. This post complies with SEBI regulations and is intended to promote financial literacy.
🗣️ Let's Discuss:
✅ Are you using supply & demand in your trading?
✅ Want help identifying zones on your favorite stocks?
👇 Drop your charts or questions in the comments — let’s grow together!
Technicalindicators
USD/JPY Bullish Setup – Demand Zone Buy Opportunity Toward 151.5🔍 Chart Overview (4H Timeframe):
Currency Pair: USD/JPY
Trend: 📈 Uptrend
EMA 70: 🔴 (144.776) – Price is trading above it = Bullish Bias
---
🟦 Demand Zone
📌 Zone: 144.804 – 146.324
💡 What it means: Strong buying interest expected here
🟢 Support line + EMA = Confluence zone!
---
✅ Entry Point:
📍 Between: 146.324 – 146.423
🎯 Best area for long (buy) position
📊 Wait for a pullback to this area before entering
---
❌ Stop Loss:
📉 Below demand zone
🔻 Range: 144.705 – 144.776
🛡️ Helps protect against unexpected drop
---
🎯 Target Point:
📈 151.500
🟩 Big reward area
🔥 Previous resistance zone = Ideal profit-taking point
---
🧭 Summary:
✅ Entry: 146.324
❌ Stop: 144.776
🎯 Target: 151.500
Risk-to-Reward: Excellent!

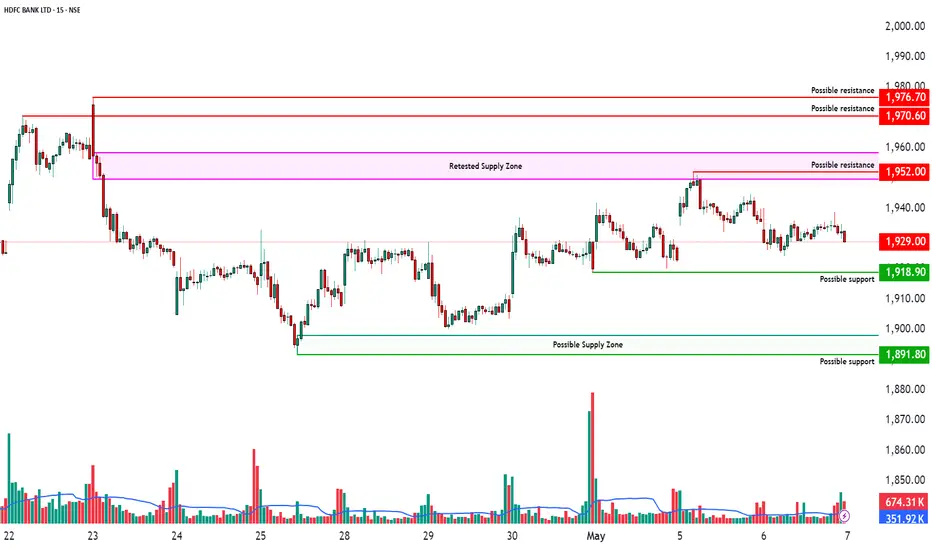
Range-Bound Between Key Supply & Demand Zones🏦 HDFC Bank Ltd – Range-Bound Between Key Supply & Demand Zones 📊
Timeframe: 15-Minute | Exchange: NSE | Date: May 6, 2025
CMP: 1,929.00
🔴 Retested Supply Zone: 1949.60 - 1958.40
This zone previously acted as resistance after a sharp fall.
Price revisited the zone but was rejected, indicating potential selling pressure.
A breakout above this level could trigger bullish continuation.
🟢 Possible Demand Zone: 1898 - 1891.80
Price rebounded from this zone earlier, showing possible accumulation by buyers.
Not confirmed yet with multiple tests, but worth watching for potential support.
Breakdown below this may open the door to further downside.
📌 Current Price Action
HDFC Bank is currently consolidating between these two zones.
No clear trend yet; price is oscillating sideways.
Volume is decreasing, indicating lack of momentum in either direction.
📈 Levels to Watch
Breakout Zone: 1,959+
Breakdown Zone: 1,890-
🔍 Observational Bias
Bearish Bias: If price revisits 1949.60 - 1958.40 zone and shows rejection, potential short setups may emerge.
Bullish Bias: If price retests 1898 - 1891.80 with bullish confirmation, long trades may be considered.
Management and Psychology Trading psychology is the emotional component of an investor's decision-making process, which may help explain why some decisions appear more rational than others. Trading psychology is characterized primarily by the influence of both greed and fear. Greed drives decisions that might be too risky.

Mangalore chemical:(Ready to shoot up); Take a look; Min 50% RoiHuge potential is there.
For short term investment ;
Leave a " Like If you agree ". 👍
.
.
Wait for Breakout & then Daily candle to close above - "135"
.
If you want to enter now "Go for it with stoploss".
.
.
Enter after Price Breaks
"Yellow box" mentioned.
.
Don't make complicated trade set-up.📈📉
Keep it " simple, focus on consistency " 💹
Refer our old ideas for accuracy rate🧑💻
Valuable comments are welcomed-✌️
.
Follow for regular updates.👍

Tech Mahindra Q4 Earnings Highlights: #TECHM
Tech Mahindra Q4 Earnings Highlights: #TECHM
• Net Profit: ₹1,166.7 Cr-
Up 18.7% QoQ (vs *983.2 Cr) •
Revenue: *13,384 Cr - Up 0.7% QoQ (vs *13,285.6 Cr)
⚫ EBITDA: *1,378 Cr-Grows 2.1% QoQ (vs *1,350.2 Cr)
⚫ EBITDA Margin: 10.3%, Slightly Up from 10.2% QoQ
Technical Analysis Summary:
The stock made a recent high of ₹1,810.
*1,210.
It was in a downtrend but has reversed from a strong support level at
Currently trading at ₹1,445, the stock has formed a Doji candle, indicating a balance between buying and selling pressure.
A break below *1,430-₹1,425 may signal increased selling pressure and potential downward movement.
Conversely, a break above ₹1,465-₹1,470 may trigger buying momentum
and a potential upward move.

BTC/USD 1H – Bullish Breakout with FVG Entry & $91K TargetChart Breakdown:
📈 Trend Structure:
BTC is moving in an ascending channel with:
🔵 Resistance Line on top
🟢 Support Line below
🔁 Recently, it broke out above the resistance with a bullish move!
Key Zones & Levels:
🟦 Fair Value Gap (FVG)
This is your potential buy zone:
✅ Entry Point: $86,135
❌ Stop Loss: $85,098
🎯 Target: $91,000
📌 Plan:
Wait for price to retrace into the FVG zone
Look for a bullish bounce ✅
Enter long at $86,135
Set your SL and target accordingly
Risk-Reward Setup:
Risk: Small (below FVG zone) ❗
Reward: Big upside toward $91,000 🚀
Gain Potential: +5.74% ($4,948 per BTC)
Visual Flow:
1️⃣ Price breaks resistance 🔼
2️⃣ Pullback expected to FVG 🔽
3️⃣ Entry triggers around $86,135
4️⃣ Targeting moon shot to $91K 🌕
Conclusion:
This setup shows a bullish continuation with solid RR.
If BTC holds the FVG on a retest, the move to $91K looks likely!

"USD/JPY Supply Zone Short Setup | High R:R Trade Plan (1H Chart📉 Short (Sell) Setup
🔵 Supply Zone (Resistance Area)
Marked in the blue box
⚠️ Price may reverse here
Sellers dominated this area before.
🔄 Expected behavior:
Price goes up to the zone and then drops
➡️🔼🔽
🔹 Entry Point: 142.841
✍️ Enter a sell trade here
Right in the supply zone.
🔴 Stop Loss: 143.371
⛔ Placed above the supply zone
To avoid stop hunts.
🟣 Target Point: 140.000
🎯 Take profit here
Strong support level
Good place to close the trade.
⚖️ Risk to Reward Ratio
❗ Risk: ~53 pips
✅ Reward: ~284 pips
⭐ R:R = 1:5.4 – Excellent setup!
📈 EMA (7)
Current price is below the EMA
Confirms bearish bias
🧭 Used as a trend guide.
Summary
🚨 Plan:
Wait for price to enter the supply zone
Enter a sell at 142.841
SL at 143.371 ⬆️
TP at 140.000 ⬇️

"AUD/USD Reversal Setup – Short from Supply Zone!''🔹 Trend Overview:
Price was in a strong uptrend 🔼, forming higher highs and higher lows.
Key Zones:
🟦 Supply Zone (🔵 Resistance Area):
0.63803 - 0.64064
Price entered this zone and started to slow down ⏸️, showing signs of seller strength.
🔵🟤🟤🟤
📍Entry Point: 0.63803
This is where the short (sell) trade is planned.
✍️ "Let’s short it here!"
🚫 Stop Loss: 0.64064
Just above the supply zone to avoid false breakouts.
🛑 "If it goes here, we're out!"
🎯 Target Point: 0.62800
Previous support zone.
🟢💰🟢
💥 "This is where we take profit!"
Indicators:
📈 EMA (7) – Black line
Shows price momentum. Currently flattening ➡️, meaning bulls are losing steam.
Trade Idea Summary:
📉 Bias: Bearish (Short)
✅ Entry: 0.63803
🛑 Stop Loss: 0.64064
🎯 Target: 0.62800
⚖️ Risk/Reward Ratio: ~1:3.8 (Very solid!)
⏱️ Timing: Watching for signs of reversal before entering

"Silver Short Setup: Supply Zone Rejection &Targeting Major SptChart Analysis for Silver/USD (XAG/USD) 🪙
🔵 Entry Point: 32.64870
📍This is where the trade is planned to start (short/sell).
🧲 Price is approaching this level again — watch for rejection.
🟥 Supply Zone: 32.65 - 33.16
⚠️ “SuPly Zone!” — Area of potential selling pressure.
🧱 Price previously reversed here, so it's a key resistance.
👀 Wait for bearish confirmation before entering.
❌ Stop Loss: 33.16322
🚨 Risk control: If price hits this level, the setup is invalid.
📈 If price breaks above, it could go higher — time to exit.
🎯 Target Point: 30.58219
🪂 The take profit zone — aim here!
🧊 It’s a previous support level where price might bounce.
📉 Trade Direction: SHORT (SELL)
🧾 Entry: 32.64870
🛑 Stop Loss: 33.16322
✅ Target: 30.58219
⚖️ Risk/Reward: ~1:4
🔻 Potential Move: -6.16%
📊 Trend & Indicators
🟠 Price recently moved up, now facing resistance.
🟢 EMA (7) is being tested — may act as dynamic resistance.
🔄 Several swing highs/lows marked with yellow dots — helps visualize market structure.
What to Watch For:
🔎 Bearish candlestick patterns inside the supply zone.
🧨 Sharp rejection or wick candles = good entry signal.
⏱️ Patience is key — let the setup come to you.

"GBP/CAD Bullish Setup: RBR Zone Bounce with 4:1 RRR "Trend:
⬆️ Bullish Trend – Market is making higher highs and higher lows, signaling upward momentum.
Key Zones & Levels
🔵 RBR Zone (Rally-Base-Rally)
This is the buy zone or demand area
📍Zone: Between 1.83927 and 1.83390
📌 Action: Look for bullish candles or patterns here
🟠 Entry Point
🔽 Entry: 1.83927
✅ This is where you consider going LONG
❌ Stop Loss
🔽 Stop: 1.83390
🛑 Protect your capital here if price drops below this zone
🎯 Target Point
🔼 Target: 1.86500
💰 Take profit zone
Possible Move
1. ⬇️ Pullback into RBR zone
2. 📈 Bullish bounce from the zone
3. 🚀 Upward rally toward 1.86500
Risk to Reward
⚖️ RRR: ~4:1 – Nice balance of risk vs potential profit!
Visual Flow
🎯 Target 1.86500
🔼
|
|
🚀 Price rallies up
|
🔄 Pullback
|
🔵 RBR Zone
🟠 Entry: 1.83927
|
❌ Stop: 1.83390

Meaning of Management and PsychologyManagement psychology explores how psychological principles and insights can be applied to understand and improve management practices within organizations. It helps managers understand human behavior, motivation, and decision-making processes, ultimately leading to more effective leadership and a better work environment.

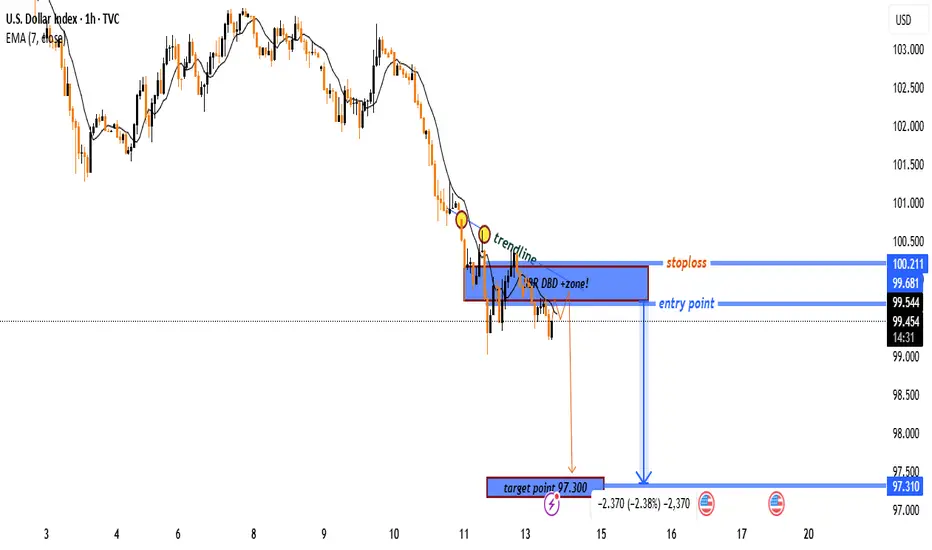
"USD Index Short Setup – Bearish Rejection from Supply Zone (DBD📉 Downtrend confirmed
➖ Lower highs and lower lows
➖ EMA (7) is sloping downward and acting as resistance
➖ Bearish momentum continues
Key Zones & Levels
🔵 Supply Zone (DBD)
🔹 Zone: 99.540 – 99.681
🔹 Label: “Drop-Base-Drop”
🔹 This is where sellers stepped in before – price is retesting it
🔹 Expecting a rejection from this area.
Trade Setup
📍 Entry Point:
🔹 Enter short around 99.540 – 99.681
❌ Stop Loss:
🔺 Set above the zone at 100.211
🚫 Protects against fakeouts
🎯 Target Point:
🔻 Target at 97.300
💰 Risk-Reward: 1:2.4 (Good!)
Visual Summary
📍 Entry: 99.540
❌ Stop Loss: 100.211
🎯 Target: 97.300
📉 Overall Bias: Bearish
✅ Strong RR setup with trend confirmation
"Bitcoin Bearish Reversal Setup: Supply Zone Short Strategy"🔵 SUPPLY ZONE (Resistance Area)
💥 Strong selling area around 85,800 - 87,800 USD
Historically, price got rejected here
Expect sellers to step in again
✍️ ENTRY POINT
📍 Just below the supply zone (~85,889.89)
Ideal for short position setup
Watch for bearish candlestick patterns for confirmation
🛑 STOP LOSS
❌ Placed above the supply zone at 87,796.97
Keeps risk under control if breakout happens
🎯 TARGET POINT (Support Area)
📉 Around 78,000 USD
Marked by previous support and structure
Great Risk-to-Reward ratio
📐 PATTERN WATCH
Looks like a harmonic pattern (maybe Gartley or Bat) 🦇
Suggests reversal from point D
Also resembles a rising wedge, which is bearish
📊 EMA (9-period)
🧭 Price hovering above the 9 EMA (84,704)
A break below it = bearish confirmation
Summary
🔻 Bearish bias
🛒 Short near supply zone
❌ SL above 87,800
🎯 TP around 78,000

Explanation of RSIRSI is a tool that aids traders in capturing market momentum by measuring the fluctuation in prices. Traders rely on RSI to spot oversold and overbought markets and determine the right time to enter a trade. RSI helps traders identify whether a stock is either overbought or oversold.

Option and Database tradingOptions data providers collect specific data points that can later be used to determine price movements over time. These price changes in the stock market help investors and brokers decide which stocks might be ideal to sell or buy given current market conditions.

Option Chain TradingAn option chain is a comprehensive listing of all available option contracts for a specific underlying asset, typically organized by expiration date and strike price. It provides a detailed view of call and put options, their premiums, and other relevant information like bid/ask prices, volume, and open interest. This tool is crucial for options traders to analyze market conditions, identify potential trading opportunities, and choose the right options contracts based on their investment strategy.

Divergence part 2In technical analysis, divergence occurs when a stock price moves in the opposite direction of a technical indicator, suggesting a potential trend reversal or weakening momentum. This can be either a bullish or bearish divergence.

RSI Divergence explainedRSI (Relative Strength Index) divergence in technical analysis occurs when the price of an asset and the RSI indicator move in opposite directions, potentially signaling a trend reversal or weakening momentum.

ADX ExpalanationThe Average Directional Index (ADX) is a technical analysis tool used to measure the strength of a trend, regardless of its direction, helping traders assess market momentum and make informed decisions.

Price Action TradingPrice action trading is a strategy where traders make decisions based on the movement of an asset's price over time, focusing on trends, chart patterns, and significant price events, rather than relying heavily on technical indicators.

Meaning of Management and psychologyManagement is the process of planning, organizing, leading, and controlling resources to achieve organizational goals, while psychology is the scientific study of behavior and mental processes. Management psychology, also known as managerial psychology, applies psychological principles to understand and improve managerial practices and organizational behavior.

Divergence explanationIn a general sense, "divergence" means moving apart or becoming different, whether in terms of physical objects, ideas, or mathematical concepts. In mathematics, it specifically refers to the rate at which a vector field expands or contracts at a point.
