XAUUSD – M30 Technical AnalysisMild Pullback Before the Next High | Lana ✨
Gold has extended sharply and is now trading into a high-resistance zone, where price often needs a light correction or consolidation to rebuild liquidity before attempting higher levels again. The broader trend remains bullish, but the next clean opportunity is more likely to come from a pullback into structure, not from chasing the highs.
📈 Market Structure & Trend Context
Price is still respecting the broader bullish structure, but the current leg is stretched after a strong impulsive run. The market is now reacting under the highest resistance zone, which typically creates short-term profit-taking and liquidity reactions before continuation.
As long as price holds above key structural support, the bullish trend remains intact.
🔍 Key Technical Zones
Highest resistance zone: 5585 – 5600 This is a premium area where price may hesitate or reject in the short term.
First support zone: 5508 A key decision level where price can rebalance before choosing direction.
Buy liquidity zone: 5446 – 5450 A strong liquidity pocket where buyers are more likely to step back in.
Long-term support zone: 5265 – 5285 A deeper base area if volatility expands into a broader correction.
🎯 Trading Scenarios
Gold may correct modestly from resistance and retest structure before pushing higher.
Buy Entry: 5446 – 5450 Stop Loss: 5438 – 5440
Take Profit targets:
TP1: 5508
TP2: 5538 – 5545
TP3: 5585 – 5600
TP4: 5650+
A shallower pullback toward 5508 could also be enough to reset momentum before another attempt higher, but repeated rejection at the top would increase the risk of deeper consolidation.
🧠 Lana’s View
Gold remains bullish, but the market is now at a level where patience matters more than speed. Rather than chasing price near resistance, the focus should stay on how price reacts during pullbacks into key structural zones.
✨ Respect the structure, manage risk, and let price come to your level.
Technicals

XAUUSD – Brian | H3 Technical AnalysisGold has officially broken above the 5,000 level for the first time, confirming a major structural shift on higher timeframes. The breakout reinforces the broader bullish narrative, with price now trading firmly in expansion mode rather than consolidation.
The move above 5,000 reflects sustained safe-haven demand amid elevated global uncertainty. While short-term volatility remains possible, the broader environment continues to favour gold as a defensive asset, supporting upside continuation scenarios.
Market Structure & Trend Context (H3)
On the H3 timeframe, XAUUSD remains well-contained within a rising price channel, with structure defined by higher highs and higher lows. The recent impulsive leg confirms continuation within the dominant trend rather than a terminal move.
Key structural observations from the chart:
Price is holding above the ascending trendline, which has acted as dynamic support throughout the advance.
A clean impulsive push above 5,000 followed by shallow pullbacks suggests strong buyer acceptance at higher prices.
The broader Elliott structure remains constructive, with price progressing through higher-wave extensions rather than showing signs of distribution.
Key Technical Zones to Monitor
Several important technical areas stand out:
5,000 – trendline retest zone: A potential area for price to stabilise if a technical pullback develops.
Strong liquidity zone around 4,787: A deeper support area where buy-side liquidity is concentrated, aligned with prior structure.
FVG zone below current price: Represents unfinished business in case volatility increases.
Upper resistance / extension zone near 5,315 (Fibonacci 1.618): A key upside reaction area where price may pause or consolidate before further expansion.
As long as price remains above the trendline and key liquidity supports, the bullish structure remains intact.
Liquidity & Forward Outlook
The breakout above 5,000 opens a new liquidity regime. With limited historical resistance overhead, price is now driven more by liquidity expansion and momentum than by traditional supply zones.
Short-term pullbacks should be viewed in the context of trend continuation rather than reversal, unless there is a clear breakdown in structure. Acceptance above 5,000 would further strengthen the case for continued upside toward higher Fibonacci extensions.
Trading Bias
Primary bias: Bullish continuation while structure holds
Key areas of interest:
Trendline / 5,000 retest zone
4,787 liquidity support
5,315 extension resistance
Preferred timeframe for confirmation: H1–H4
Strong trends rarely move in a straight line. Patience and alignment with structure remain critical in this phase of the market.
Refer to the accompanying chart for a detailed view of trend structure, liquidity zones, and Fibonacci extensions.
Follow the TradingView channel to get early access to structural updates and join the discussion.

XAUUSD – H2 Technical AnalysisLiquidity Pullback Within a Strong Bullish Structure | Lana ✨
Gold continues to trade within a well-defined bullish structure on the H2 timeframe. The recent surge was impulsive, followed by a healthy retracement that appears to be rebalancing liquidity rather than signaling a trend reversal.
Price action remains constructive as long as the market respects key structural levels and the ascending trendline.
📈 Market Structure & Trend Context
The overall trend remains bullish, with higher highs and higher lows still intact.
Price continues to respect the ascending trendline, which has acted as reliable dynamic support throughout the uptrend.
The recent pullback occurred after an aggressive upside expansion, fitting the classic sequence:
Impulse → Pullback → Continuation
No clear distribution pattern is visible at this stage. As long as structural support holds, the bias remains BUY on pullbacks, not selling strength.
🔍 Key Technical Zones & Value Areas
Primary Buy POC Zone: 4764 – 4770
This area represents a high-volume node (POC) and aligns closely with the rising trendline.
It is a natural zone where price may rebalance before resuming the bullish trend.
Secondary Value Area (VAL–VAH): 4714 – 4718
A deeper liquidity zone that could act as support if sell pressure temporarily increases.
Near-term resistance: 4843
Acceptance above this level strengthens the continuation scenario.
Psychological reaction zone: 4900
Likely to generate short-term hesitation or profit-taking.
Higher-timeframe expansion targets:
5000 (psychological level)
2.618 Fibonacci extension, where major liquidity may be resting.
🎯 Trading Plan – H2 Structure-Based
✅ Primary Scenario: BUY the Pullback
Buy Entry:
👉 4766 – 4770
Lana prefers to engage only if price pulls back into the POC zone and shows bullish confirmation on H1–H2 (trendline hold, strong rejection of lower prices, or bullish follow-through).
Stop Loss:
👉 4756 – 4758
(Placed ~8–10 points below entry, beneath the POC zone and the ascending trendline)
🎯 Take Profit Targets (Scaled Exits)
TP1: 4843
First resistance zone — partial profit-taking recommended.
TP2: 4900
Psychological level with potential short-term reactions.
TP3: 5000
Major psychological milestone and upside expansion target.
TP4 (extension): 5050 – 5080
Area aligned with the 2.618 Fibonacci extension and higher-timeframe liquidity.
The preferred approach is to scale out gradually and protect the position, adjusting risk as price confirms continuation.
🌍 Macro Context (Brief)
According to Goldman Sachs, central banks in emerging markets are expected to continue diversifying reserves away from traditional assets and into gold.
Average annual central bank gold purchases are projected to reach around 60 tons by 2026, reinforcing structural demand for gold.
This ongoing accumulation supports the idea that pullbacks are more likely driven by positioning and profit-taking, rather than a shift in long-term fundamentals.
🧠 Lana’s View
This remains a pullback within a bullish trend, not a bearish reversal.
The focus stays on buying value at key liquidity zones, not chasing price at highs.
Patience, structure, and disciplined execution remain the edge.
✨ Respect the trend, trade the structure, and let price come to your zone.

XAUUSD (H4) – Liam PlanMacro tailwinds remain, but price is extended | Trade reactions, not emotions
Quick summary
Gold remains supported by a strong macro backdrop:
📌 Fed hold probability in January: 95% → USD/yields capped.
📌 Geopolitical tension (Kremlin praising Trump over Greenland, NATO cracks) adds safe-haven demand.
Technically, price has pushed aggressively into upper expansion territory. At this stage, the edge is reaction trading at key levels, not chasing strength.
Macro context (why volatility stays elevated)
With the Fed very likely holding rates in January, markets are highly sensitive to USD and yield shifts.
Rising geopolitical noise keeps gold bid, but also increases the risk of headline-driven spikes and liquidity sweeps.
➡️ Conclusion: directional bias is secondary to execution quality. Trade levels + confirmation only.
Technical view (H4 – based on the chart)
Gold is trading inside a rising channel, currently extended toward the upper Fibonacci expansion.
Key levels to focus on:
✅ Major sell Fibonacci / wave top: 4950 – 4960
✅ Sell wave B / reaction zone: 4825 – 4835
✅ Buy entry / structure support: 4730 – 4740
✅ Sell-side liquidity: 4520 – 4550 (below structure)
Price is stretched above the mid-channel — conditions where pullbacks and rotations are statistically more likely than clean continuation.
Trading scenarios (Liam style: trade the level) 1️⃣ SELL scenarios (priority – reaction trading)
A. SELL at Fibonacci extension (primary idea) ✅ Sell zone: 4950 – 4960 SL: above the high / fib extension TP1: 4830 TP2: 4740 TP3: 4550 (if momentum accelerates)
Logic: This is an exhaustion area aligned with wave completion and fib extension — ideal for profit-taking and mean rotation, not trend chasing.
B. SELL wave B reaction ✅ Sell: 4825 – 4835 Condition: clear rejection / bearish structure on M15–H1 TP: 4740 → 4550
Logic: Classic corrective wave zone. Good for tactical shorts within a broader volatile structure.
2️⃣ BUY scenario (secondary – only on reaction)
BUY at structural support ✅ Buy zone: 4730 – 4740 Condition: hold + bullish reaction (HL / rejection / MSS on lower TF) TP: 4825 → 4950 (scale out)
Logic: This is a key flip zone inside the rising channel. BUY only if price proves acceptance — no blind dip buying.
Key notes (risk control)
Market is extended → expect fake breaks and sharp pullbacks.
Avoid mid-range entries between levels.
Reduce size during geopolitical headlines.
Confirmation > prediction.
What’s your play: selling the 4950 fib extension, or waiting for a clean reaction at 4730–4740 before reassessing?
— Liam

XAUUSD (H4) — Bond Selloff, Yields UpPullback Opportunity or Rejection at the Top?
Gold is still holding a bullish structure on the H4 chart, but the rebound in global yields can easily trigger sharp swings around key resistance. Today’s approach is simple: trade the zones, not the noise.
I. Executive Summary
Primary trend: H4 uptrend remains intact.
Trading bias: Prefer BUY on pullbacks into demand; consider SELL only with clear rejection at Fibonacci resistance.
Key zones:
Sell: 4774–4778
Buy: 4666–4670
Value Buy: 4620–4625
Rule: Enter only after zone touch + confirmation (rejection / micro-structure shift).
II. Macro & Fundamentals (optimized & concise)
Global bond selloff: Bond selling is spreading globally; Japan’s 40-year JGB yield hitting 4% signals broad, persistent yield pressure.
US yields rebounding: Higher US yields (10Y–30Y) raise the opportunity cost of holding gold → short-term bearish pressure for XAUUSD.
Risk premium still alive: Geopolitical tension and tariff headlines keep markets sensitive, supporting defensive flows and limiting deep downside.
Fundamental takeaway: Rising yields can drive a pullback, but the broader risk backdrop favors a correction within an uptrend, not a full reversal (unless structure breaks).
III. Technical Structure (from your chart)
1) H4 overview
Price is extended after a strong impulse and is now consolidating, while structure still prints Higher Highs / Higher Lows.
The ascending trendline remains supportive → the higher-probability play is buying dips into demand rather than chasing price.
2) Key zones
Fibonacci Sell zone: 4774 – 4778 (major supply / resistance — profit-taking and rejection risk)
Buy zone: 4666 – 4670 (shallow pullback within trend)
VL / Value Buy: 4620 – 4625 (deeper pullback — higher-quality dip if yields spike again)
Lower support zones remain a contingency for a deeper flush.
IV. Trading Plan (Brian style — 2 scenarios)
⭐️ PRIORITY SCENARIO — BUY (trend continuation)
Idea: As long as the H4 uptrend holds, look to buy pullbacks into demand with confirmation.
Option A — Buy pullback: 4666 – 4670
SL: below 4620 (more conservative: below 4616–4610 depending on volatility/spread)
TP: 4716 – 4740 – 4774 – 4800
Option B — Value Buy (if a deeper sweep happens): 4620 – 4625
SL: below the nearest H4 swing low / below 460x (risk preference dependent)
TP: 4666 – 4716 – 4774 – 4800
Confirmation cues (optional):
Strong rejection wick at the buy zone, or
H1 micro-structure break back to the upside, or
Liquidity sweep then close back above the zone.
⭐️ ALTERNATIVE SCENARIO — SELL (rejection at Fibonacci resistance)
Idea: With yields rising, gold may react sharply at the top — treat this as a reaction trade, not a macro trend reversal call.
Sell zone: 4774 – 4778 (SELL only if price rejects clearly)
SL: above 4788 – 4800
TP: 4740 – 4716 – 4670
Important: If H4 closes and holds above 4778 (acceptance), the bias shifts to buying pullbacks instead of forcing shorts.

XAUUSD – H1 Technical AnalysisXAUUSD – H1 Technical Analysis | Lana ✨
Gold remains in a strong bullish structure, and the current price action is best understood as a healthy pullback within an uptrend, not a reversal.
📈 Market Structure & Trendline
Price continues to respect the ascending trendline, confirming higher highs and higher lows.
The impulsive leg at the start of the week created a clear liquidity imbalance, which is now acting as a key demand zone.
As long as price holds above this structure, the bullish bias stays intact.
🔢 Fibonacci Confluence
Using Fibonacci on the latest impulsive move:
0.618 – 0.5 retracement zone aligns perfectly with the current consolidation.
This confluence strengthens the idea that the market is rebalancing before continuation, rather than distributing.
🟢 Key Buy Zones (Preferred)
4510 – 4520
Liquidity imbalance + trendline support
→ Ideal zone to wait for bullish confirmation
This zone represents value, where smart money typically looks to re-enter the trend.
🔴 Resistance & Reaction Zone
4635 – 4637 (Fibonacci extension 2.618)
→ Strong resistance and profit-taking area
→ Possible short-term sell reaction, not a confirmed reversal
Avoid chasing buys near this zone without a clear breakout and acceptance.
🧠 Trading Scenario
Base case: Price pulls back into the buy zone (4510–4520), reacts, and continues higher following the trendline.
Alternative: Deeper pullback but structure remains bullish as long as trendline holds.
Invalidation: A clean break and acceptance below the trendline would signal a deeper correction.
✨ Lana’s Notes
Trend is your friend — but entries matter more than bias.
Buy value, sell reactions.
Let Fibonacci, structure, and trendline do the heavy lifting.
No FOMO, no chasing.
Trade the structure. Respect the trend. React, don’t predict. 💛

XAUUSD H4 – Gold Trading Strategy Next Week(Liquidity-Based Levels)
Gold is heading into a key decision week as price returns to a major reaction area. The market is currently best traded by waiting for liquidity reactions at the highlighted zones, rather than chasing moves in the middle of the range.
1) H4 Technical Context
Price has recovered and is now retesting a key pivot region around the 4.45xx area.
The chart shows clear supply zones overhead, while the 4445–4449 zone stands out as the highest-probability buying reaction area.
If price holds this buying zone, the preferred path is continuation higher toward the upper supply region near 4632–4637.
2) Key Levels to Watch
Main BUY zone: 4445 – 4449
Liquidity confluence area with strong probability of bullish reaction if structure remains intact.
Mid resistance: 4550 – 4560
A reaction zone where buyers may take partial profits and where price behavior matters.
Target SELL zone (scalping): 4632 – 4637
Strong overhead supply. Ideal for short-term selling reactions if price rallies sharply and shows rejection.
Strong support: around 4408
If the main buying zone fails, this level becomes the next key area that defines whether the pullback deepens.
3) PRIORITY SCENARIO – Main Plan (Buy with Structure)
Next week’s primary strategy remains trend-following, but execution should be level-based.
Buy area: 4445–4449
Best confirmation: H4/H1 candles hold the zone and close back above it without a strong breakdown.
Upside expectations: push toward 4550–4560 first, then extend toward 4632–4637.
4) ALTERNATIVE SCENARIO – If the Buy Zone Fails
If price breaks 4445–4449 cleanly and accepts below it:
A deeper correction can develop toward 4408 and potentially lower.
In that case, the plan is to wait for a clear reaction at support before looking for the next long setup.
5) SELL Scenario – Short-Term Only
Selling is not the primary strategy. It is only considered as a short-term scalp at premium supply.
Sell zone: 4632–4637
Only sell on clear rejection signals such as strong wicks, failed breakout, or a lower-timeframe structure shift.
6) Weekly Summary
Focus zone: 4445–4449 is the key decision area
Hold above it → prefer BUY toward 4550–4560 and 4632–4637
Lose it → watch 4408 for deeper correction reaction
Sell ideas are scalps only at the upper supply zone

XAUUSD liquidity changes amid 2026 Black Swan risksXAUUSD H1 – Liquidity Rotation Under Black Swan Risks in 2026
Gold is once again being driven by liquidity and macro uncertainty. While short-term price action is rotating around key Volume Profile levels, the broader backdrop for 2026 is increasingly shaped by underestimated systemic risks, often ignored during periods of market optimism.
TECHNICAL STRUCTURE
On H1, gold has completed a sharp downside liquidity sweep followed by a strong rebound, signalling aggressive absorption from buyers at lower levels.
Price is now rotating inside a short-term recovery structure, with liquidity clusters clearly defining where reactions are likely to occur.
The market is currently trading between sell-side liquidity above and buy-side liquidity below, favouring range-based execution rather than chasing momentum.
KEY LIQUIDITY ZONES
Sell-side liquidity / resistance:
4513 – POC sell zone
4487 – VAL sell scalping area
These zones represent heavy historical volume where sellers previously defended price. Reactions here may trigger short-term pullbacks before continuation.
Buy-side liquidity / support:
4445 – Buy POC
4409 – Major buy zone and liquidity support
These levels align with value areas where demand has stepped in strongly, making them critical zones for price stabilisation.
EXPECTED PRICE BEHAVIOUR
Short term: price is likely to continue rotating between buy and sell liquidity, creating two-way opportunities.
A sustained hold above buy-side liquidity keeps the bullish structure intact.
A clean break and acceptance above sell-side liquidity would open the path toward a retest of ATH levels.
MACRO & BLACK SWAN CONTEXT – WHY 2026 MATTERS
2026 is shaping up to be a year of hidden tail risks, including:
Increasing political pressure from President Trump on the Federal Reserve
Key elections in the US and multiple emerging markets
Elevated risk of an AI-driven technology stock bubble due to excessive valuations
Historically, environments marked by political stress, central bank credibility concerns, and asset bubbles tend to strengthen demand for hard assets, particularly gold.
BIG PICTURE VIEW
Gold remains structurally supported by liquidity and macro uncertainty
Short-term price action is tactical and level-driven
Long-term, gold continues to act as insurance against systemic and political risk
When markets underestimate risk, liquidity quietly shifts. Gold tends to move first.

XAUUSD (H4) – Monday StrategyGeopolitical shock risk, gold may spike | Trade liquidity and reaction zones only
Quick summary
News around Trump’s claim that Maduro has been detained, plus Venezuela’s response (they don’t know his and his wife’s whereabouts and are demanding proof of life), raises geopolitical uncertainty sharply. For gold, that’s a classic catalyst for a gap/spike at Monday open.
So my rule for Monday: no FOMO, only trade liquidity zones and confirmed reactions on the chart.
1) Macro context: Why gold can surge on Monday
Rising geopolitical tension often drives flows into safe-haven assets like gold.
When facts are unclear and tensions escalate, the market can open with:
✅ sharp spikes, ✅ liquidity sweeps, ✅ wider spreads.
➡️ Best approach: wait for price to hit levels, then trade the reaction — not the headline.
2) Technical view (H4 – based on your chart)
Gold is currently moving inside a larger structure after a heavy move, and your chart highlights the key zones clearly:
Key zones
Sell test support 4450 (pullback area where price may get sold)
Liquidity 4330 (major liquidity magnet)
OB 4309 (order block / short-term reaction zone)
Support 4277 (intermediate support)
Buy zone 4203–4206 (deep support / swing buy area)
3) Monday trading scenarios (Liam style: trade the level)
Scenario A (priority): Spike up → SELL around 4450
✅ If gold pumps on the headline at the open:
Sell around 4450 (sell-test zone)
SL: above the most recent swing high (refine on lower TF)
TP1: 4330
TP2: 4309
TP3: 4277
Logic: Headline-driven opens often spike to sweep buy-side liquidity first, then rotate back into value/liquidity.
Scenario B: Sweep down → BUY at liquidity zones
✅ If price gets pulled down first:
Buy around 4330 (Liquidity)
Buy confirmation at 4309 (OB)
SL (guide): below 4300
TP: 4380 → 4450 (scale out)
Logic: 4330 is a major liquidity magnet and often produces a sharp reaction bounce.
Scenario C (worst-case dump): BUY the deep support 4203–4206
✅ If volatility is extreme and price flushes:
Buy: 4203 – 4206
SL: 4195
TP: 4277 → 4330
Logic: This is a deep swing-buy area if the market does a hard liquidity reset.
4) Key notes for a headline-driven Monday open
Avoid trading the first 5–10 minutes if spreads widen.
Only enter once price hits the level and shows a clear reaction (rejection / engulf / MSS on M15).
Reduce size — geopolitical opens can whip hard.
Do you think Monday’s move sweeps up into 4450 first, or drops straight into 4330 liquidity?

XAUUSD (H1) – Early 2026 ForecastShort-term recovery inside a larger bullish cycle 💛
Quick market recap
2025 performance: Gold surged ~64%, the strongest annual gain since 1979
Recent move: Sharp year-end correction driven by profit-taking and margin adjustments, not trend reversal
Big picture: The multi-year bull market in precious metals remains intact
Fundamental context (why the trend still matters)
Despite the late-2025 pullback, the broader precious metals complex remains structurally strong. Gold, silver, platinum, and palladium all benefited from:
Fed rate-cut cycle expectations
Persistent geopolitical tensions
Strong central bank buying
Industrial demand and supply constraints (especially for silver and platinum)
Most analysts agree the recent correction was technical in nature. The long-term outlook still points toward gold potentially testing 5,000 USD/oz and silver approaching 100 USD/oz in 2026, although short-term volatility is expected to remain high.
Technical view (H1) – Based on the chart
After failing to hold above the ATH, gold experienced a sharp bearish displacement, followed by a stabilization phase near a strong support zone. Price is now attempting a recovery, but the structure suggests this is still a corrective move within a broader range.
Key observations:
Strong sell-off broke short-term bullish structure
Price is rebounding from major support, forming a potential higher low
Overhead liquidity and Fibonacci zones remain key reaction areas
Key levels Lana is watching
Buy zone – Strong liquidity support
Buy: 4345 – 4350
This is a strong liquidity zone where price already reacted. If price revisits this area and holds structure, it offers a favorable risk-to-reward buy aligned with the larger bullish cycle.
Sell zone – Short-term resistance (scalping)
Sell scalping: 4332 – 4336
This zone aligns with short-term resistance and Fibonacci reaction levels. If price fails here, a brief pullback toward support is possible.
Important overhead liquidity
Key liquidity: 4404 area
A clean break and hold above this level would signal stronger bullish continuation toward higher targets.
Scenarios to consider
Scenario 1 – Range correction continues
Price reacts at short-term resistance, rotates back into liquidity, and builds a base before the next directional move.
Scenario 2 – Bullish continuation resumes
A break above overhead liquidity opens the path toward higher levels, potentially retesting prior highs as the new year unfolds.
Lana’s approach 🌿
Trade zones, not headlines
Focus on price reaction at liquidity levels
Accept short-term volatility while respecting the long-term bullish structure
This analysis reflects Lana’s personal market view and is not financial advice. Please manage risk carefully and trade responsibly 💛

XAUUSD (H1) – Bearish Correction After ATHLana focuses on selling rallies, waiting for a deeper buying zone 💛
Quick overview
Market state: Sharp sell-off after failing to hold above ATH
Timeframe: H1
Current structure: Strong bearish impulse → corrective rebound in progress
Intraday bias: Sell on pullbacks, buy only at major support
Technical picture (based on the chart)
Gold printed a clear distribution top near ATH, followed by a strong bearish displacement. This move broke the short-term bullish structure and shifted momentum to the downside.
Price is now attempting a technical rebound, but so far this looks corrective rather than impulsive. As long as price stays below key resistance, Lana treats this as a sell-the-rally environment.
Key observations:
Strong bearish candle confirms loss of bullish control
Current rebound is moving into prior liquidity + Fibonacci reaction zone
Market is likely building a lower high before the next move
Key levels to trade
Sell zone – priority setup
Sell: 4392 – 4395
This zone aligns with:
Prior structure resistance
Fibonacci retracement area
Liquidity resting above current price
If price reaches this zone and shows rejection, Lana will look for sell continuation.
Buy zone – only at strong support
Buy: 4275 – 4278
This is a higher-timeframe support zone and the first area where buyers may attempt to step back in. Lana only considers buys here if price shows clear reaction and stabilization.
Intraday scenarios
Scenario 1 – Rejection at resistance (preferred)
Price retraces into 4392–4395, fails to break higher, and rolls over → continuation to the downside, targeting deeper liquidity.
Scenario 2 – Deeper correction then recovery
If selling pressure extends, price may sweep liquidity into 4275–4278 before forming a base for a larger rebound into the new year.
Market tone
The recent move reflects profit-taking and risk reduction after an extended rally. With year-end liquidity thinning out, price action can remain volatile and deceptive, making zone-based trading essential.
This analysis reflects Lana’s technical view and is not financial advice. Always manage your own risk and wait for confirmation before entering trades 💛

XAUUSD H4 – Medium-Term Outlook for the Coming WeekGold remains within a broad rising channel, but recent price action shows clear rejection at the upper trendline. For the week ahead, the focus is on a potential technical pullback, while keeping an alternative bullish scenario if the market fully accepts higher prices.
PRIORITY SCENARIO – MAIN SCENARIO
Wait for structural confirmation to sell the medium-term corrective move.
Key confirmation level: a break of the trendline around 4317.
Trade idea: look for confirmation below 4317 to sell the corrective leg within the rising channel.
Technical context: price is trading near the upper boundary of the channel and showing rejection, a common setup before a rotation back toward lower value areas.
Position management:
Sell positions should be treated strictly as corrective trades within a broader uptrend. If price fails to stay below 4317 and regains bullish structure, risk should be reduced and short positions avoided.
ALTERNATIVE SCENARIO – SECONDARY SCENARIO
Trend continuation if price breaks to new highs and finds acceptance.
Trigger condition: a clean breakout to new highs with sustained bullish momentum.
Trade idea: prioritize buy setups once the market clearly accepts higher prices.
Technical context: successful breakouts often lead to range expansion, making short positions unfavorable.
KEY MEDIUM-TERM BUY ZONE
Liquidity-based opportunity in the event of a deeper pullback.
Reference buy zone: around 4220.
Rationale: this area represents a major liquidity cluster and a logical zone to monitor for bullish reactions during a deeper year-end pullback.
KEY TECHNICAL REASONS
The dominant H4 trend remains bullish, but rejection at the upper channel increases the probability of a technical correction.
The 4317 level acts as a key decision point to distinguish between a genuine pullback and temporary consolidation.
The 4220 area serves as a value zone aligned with liquidity for potential trend-following buys.
MACRO AND NEWS CONTEXT
Recent comments have reinforced expectations of future rate cuts to address labor market risks, which remains supportive for gold in the broader context. Geopolitical developments, including discussions around the next steps in the Gaza peace process, continue to underpin safe-haven demand. However, year-end holiday conditions often result in thinner liquidity, wider spreads, and less reliable price moves, making discipline and risk control essential.
RISK MANAGEMENT AND WEEKLY PLAN
Avoid chasing long positions near the upper trendline of the rising channel. Only consider short positions after clear confirmation below 4317, avoiding emotional top-picking in a bullish market. If price breaks and holds above recent highs, shift focus back to trend-following buy setups. Reduce position size during the holiday week and prioritize trades around well-defined key levels rather than extended moves.

Heikin Ashi with Bollinger Bands – Rule-Based Reversal Strategy🔹 Intro / Overview
The Bollinger Bands are one of the most widely used indicators for identifying overbought and oversold market conditions.
They consist of an upper band, middle band (SMA), and lower band that expand and contract based on volatility.
In this setup, we focus on Bullish and Bearish signals generated when price closes outside the bands.
Heikin Ashi Chart In this idea Apply Boolinger band on Heikinashi chart to capture reversal signals.Heikin Ashi candles help reduce market noise, providing smoother price action and clearer trend signals.
When combined with Bollinger Bands, they offer disciplined entries, defined stop losses, and structured target management.
---
📖 How to Use
🔴 Bearish Signal - Appears after a uptrend
- Trigger → Candle closes above the Upper Band. (Signal candle)
- Candle High = Devalidation line.
- Candle Low = Validation line.
- Entry Confirmed → When price closes below the validation line.
- ❌ No Entry → If price moves above the devalidation line before validation.
🟢 Bullish Signal - Appears after a downtrend
- Trigger → Candle closes below the Lower Band. (Signal candle)
- Candle High = Validation line.
- Candle Low = Devalidation line.
- Entry Confirmed → When price closes above the validation line.
- ❌ No Entry → If price moves below the devalidation line before validation.
- 👉🏼 RESET → if Another New Trigger Comes Before Validation-Devalidation, the system RESET Validation and devalidation line to new values.
---
🎯 Trading Plan
- Entry → On validation close (Bearish: below signal Candle Low, Bullish: signal Candle above High).
- Stop Loss (SL) → Signal candle low for Bullish, signal candle high for Bearish.
- Target → 1R (equal to risk: Entry–SL distance).
- Remaining Lots → Trail with ATR, Fibonacci, Box Trailing, or structure-based stops for extended moves.
---
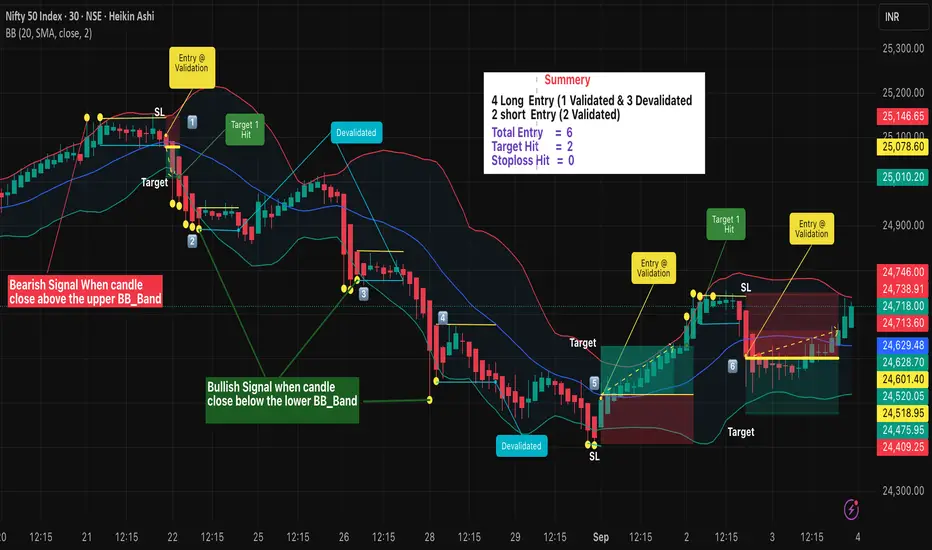
📊 Chart Explanation
1️⃣ 🛑Bearish Signal →
- Candle validated as price closed below the validation line .
- 🎯 Target 1 achieved, remaining lots managed with trailing methods. Exit may occur at swing bottom with best trailing method.
2️⃣ 🟢 Bullish Signal →
- ❌ Candle Devalidated as price closed below the devalidation line . . no Entry
3️⃣ 🟢Bullish Signal →
- ❌ Candle Devalidated as price closed below the devalidation line . . no Entry
4️⃣ 🟢Bullish Signal →
- ❌ Candle Devalidated as price closed below the devalidation line . . no Entry
5️⃣ 🟢Bullish Signal →
- Candle validated as price closed above the validation line
- 🎯 Target 1 achieved, remaining lots managed with trailing methods. Exit may occur at swing top with best trailing method.
6️⃣ 🛑Bearish Signal →
- Candle validated as price closed below the validation line .
-Still active during trading hours, monitoring continues.
---
👀 Observation
- Bearish signals are more effective during strong uptrends when volatility peaks.
- Bullish signals work best at market bottoms or oversold conditions.
- Early invalidations prevent false entries.
- Trailing stops allow scaling out while capturing bigger moves.
---
❗ Why It Matters?
- Provides rule-based trading using Bollinger Bands, not just blind signals.
- Validation & devalidation ensure disciplined entries.
- Helps traders avoid chasing moves by waiting for confirmation.
- Enhances risk management with clear SL & trailing systems.
---
🎯 Conclusion
The Bollinger Band Strategy offers structured bullish & bearish setups.
By combining validation lines, devalidation rules, and trailing systems, traders can capture high-probability trades while avoiding false signals.
🔥 Patterns don’t predict. Rules protect. 🚀
⚠️ Disclaimer
📘 For educational purposes only · 🙅 Not SEBI registered · ❌ Not a buy/sell recommendation · 🧠 Purely a learning resource · ❌ Not financial advice.
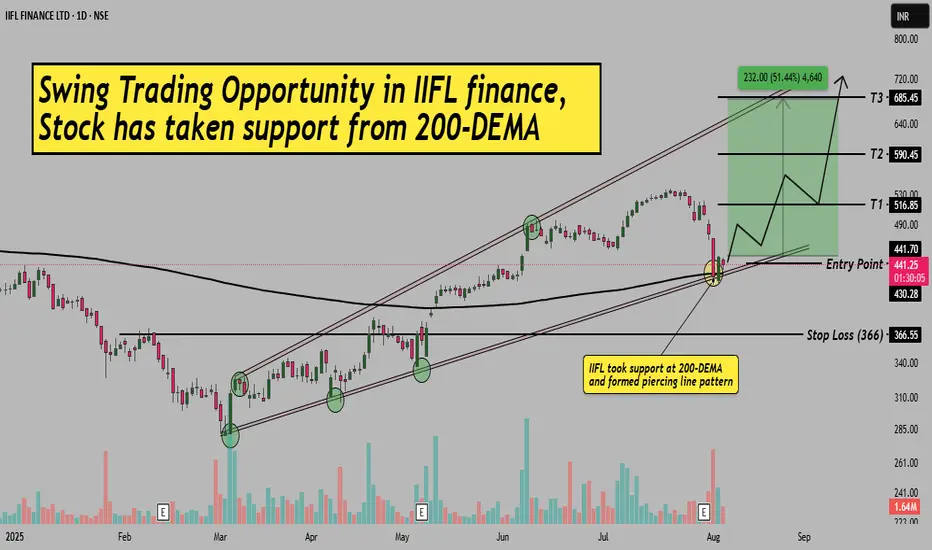
IIFL Finance–Swing Setup from 200-DEMA Support & Piercing Line!Hello Everyone, I hope you all are doing well in life and in trading!
Today I’ve brought a fresh swing trading opportunity in IIFL Finance , where the stock has taken support from the 200-EMA and is formed a bullish Piercing Line pattern.
After a strong uptrend, the stock corrected and has now taken trendline support (from channel base) along with the 200-day EMA confluence, a high-probability reversal zone. A clear bullish candle indicates a potential bounce from here.
The best part? The stock still offers a great risk-reward with defined entry, stop-loss, and 3 possible targets. Please refer to the chart for full trade setup details.
This setup is purely based on price action, moving average confluence, and support zone behavior.
If you are a swing or positional trader, this setup is worth keeping on your radar!
If you found this helpful, don’t forget to LIKE & FOLLOW for more such clean technical ideas.
Disclaimer: This idea is for educational purposes only. Always do your own research before taking trades.
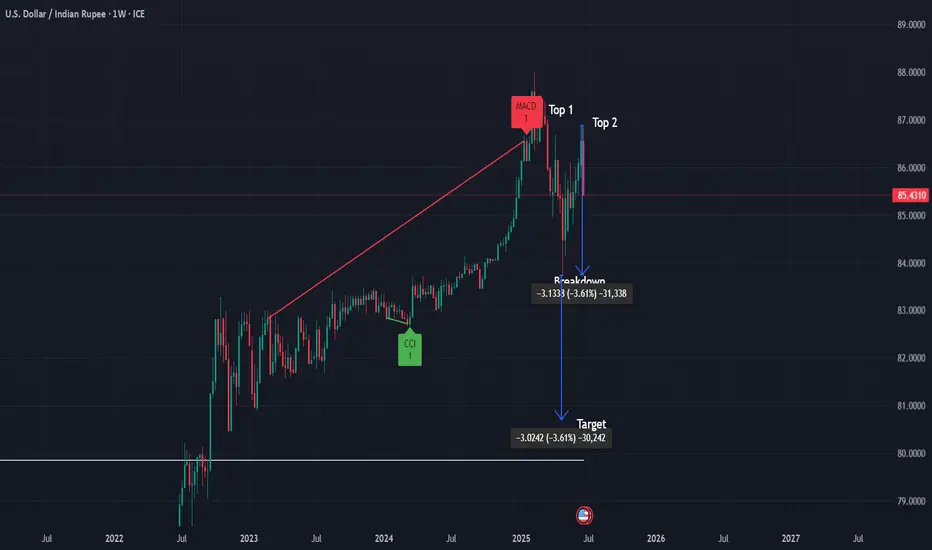
USD/INR Weekly Chart Analysis 📌 USD/INR Weekly Chart – Double Top Analysis
After a sustained uptrend, USD/INR is showing potential signs of a reversal with a well-defined Double Top pattern on the weekly timeframe.
✅ Pattern: Double Top (Weekly)
✅ Key Resistance: ~87.00 (tops)
✅ Breakdown Level: 83.76 (watch for confirmed weekly close below)
✅ Target Projection: ~80.76 (based on measured move)
✅ Stop-loss: ~84.70 (ATR-based level)
📉 Bias: Bearish on confirmed weekly close below 83.76 with increased selling volume.
🔎 Volume Note: Look for higher volume on breakdown to confirm selling pressure and pattern validity.
✅ Commentary:
This classic double top setup suggests potential trend exhaustion after an extended move up. A weekly close below the 83.76 neckline with strong volume would strengthen the bearish signal, targeting ~80.76 in the medium term. ATR-based stop-loss placement provides tactical risk management above recent support
GOLD SPOT (XAU/USD) 1H ANALYSIS – BULLISH STRUCTURE HOLDING STRO📈 GOLD SPOT (XAU/USD) 1H ANALYSIS – BULLISH STRUCTURE HOLDING STRONG! 🚀✨
🔍 Overview:
Gold is currently trading within a well-defined ascending channel 📊, showing clear bullish intent. Price action has respected the lower channel support, bouncing strongly from a key demand zone highlighted in blue.
🟦 Support Zone:
The price is consolidating just above the $3,385–$3,390 support zone 🛡️, which has acted as a springboard multiple times in the past. This area aligns perfectly with the lower trendline, increasing its reliability.
📍 Key Price Targets:
🎯 $3,402 – First breakout confirmation and minor resistance.
🎯 $3,422 – Mid-level target, possible resistance.
🎯 $3,452 – High-probability target if bullish momentum continues.
🎯 $3,460+ – Extended target aligning with the channel top.
📈 Technical Structure:
Price is respecting higher lows and higher highs, maintaining bullish momentum.
A breakout above $3,402 could trigger the next leg up.
Market is forming a bullish flag/pennant consolidation—potential breakout pending ⏳.
⚠️ Risk Zone:
A break below the demand zone and the channel could invalidate the bullish setup ❌. Close monitoring of lower structure is essential.
✅ Conclusion:
As long as price holds above the key support zone and within the ascending channel, bullish continuation remains the favored scenario. A breakout above interim resistance levels could send Gold toward $3,450+! 🌟📊
🔔 Watch for bullish confirmation candles or volume spikes before entry!
📅 Chart published: June 18, 2025 | XAU/USD | 1H timeframe
🧠 Strategy: Bullish breakout play 📈
💡 Sentiment: Moderately Bullish ♻️

Gold (XAU/USD) 1H Analysis – Potential Breakout Play🟡 Gold (XAU/USD) 1H Analysis – Potential Breakout Play 📈
🔎 Key Levels and Zones
Resistance Zone: Around $3,410 – $3,430.
Midpoint/Key Resistance-Turned-Support: Around $3,360 – $3,370.
Support Zone: Around $3,270 – $3,290.
🔀 Chart Structure & Momentum
The price is in a short-term bullish recovery after finding strong support at the $3,270 – $3,290 level.
The breakout above the midpoint around $3,360 is a significant bullish trigger, suggesting that bulls are taking charge.
📊 Scenario Analysis
Bullish Scenario (Primary Bias) 🟢: If the price holds above the midpoint ($3,360), we expect a push towards the resistance zone ($3,410 – $3,430). This aligns with the “resistance-flip-support” concept, where the previous resistance becomes a new support base.
Bearish Scenario (Alternate Bias) 🔴: If the price fails to hold above $3,360, a re-test of the support zone ($3,270 – $3,290) is likely. From there, bulls will likely try to defend the area and launch another attempt upwards.
📌 Conclusion
The path of least resistance currently favors the bulls while the $3,360 level holds.
Watch for consolidation near $3,360 – $3,370 as a healthy retest before potential continuation to the upside target zone ($3,410 – $3,430).
📅 Near-Term Bias
Remain cautiously bullish while above $3,360.
A confirmed breakout above $3,410 opens room for further bullish momentum, while a breakdown below $3,360 can re-test the key support at $3,270.

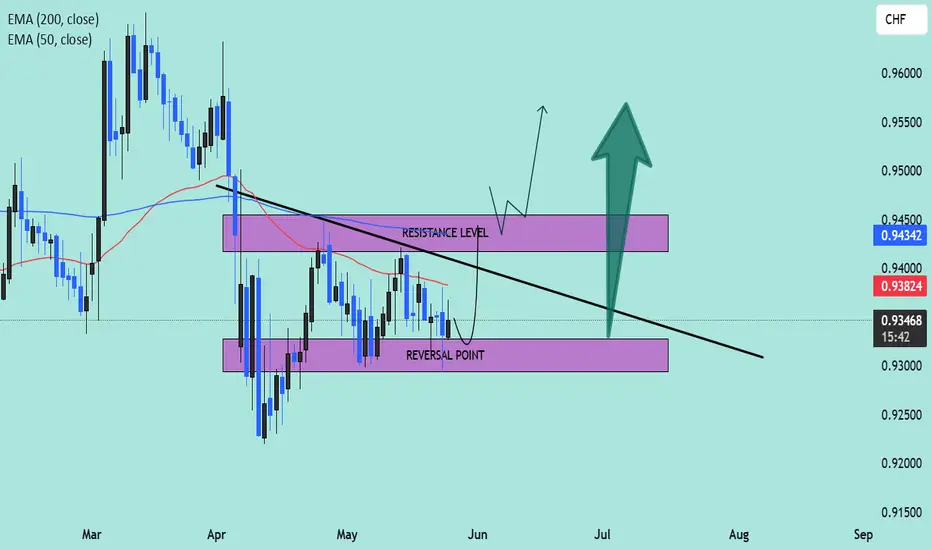
EUR/CHF Technical Outlook – Potential Bullish Reversal Setup📈 Pair: EUR/CHF
📆 Date: May 27, 2025
📊 Timeframe: Daily (D1)
📌 Technical Highlights:
🔹 Current Price: 0.93456
🔹 Key Indicators:
50 EMA (Red): 0.93824
200 EMA (Blue): 0.94342
🧠 Chart Analysis:
🔻 Downtrend Resistance Line: A clear descending trendline is pressing price lower, reinforcing a bearish structure since March.
🟣 Reversal Zone (Support Area):
Price is currently hovering just above the marked Reversal Point, a demand zone between 0.93000–0.93400. Historically, this zone has acted as a launch pad for upward momentum.
🟪 Resistance Level:
Located around 0.94300–0.94600, this zone is reinforced by the 200 EMA, making it a critical breakout area. A strong bullish close above this region could invalidate the downtrend.
🔄 Two Scenarios to Watch:
✅ Bullish Breakout Scenario:
Price may bounce from the reversal zone.
A break and retest above the resistance level could lead to bullish continuation toward 0.9500–0.9550.
Confirmation above the 200 EMA will add confidence to the breakout.
📈 Potential Buy Entry: On breakout and retest of 0.9450
🎯 Target: 0.9550
🛡️ Stop Loss: Below 0.9320
❌ Bearish Continuation Scenario:
If price fails to hold above the reversal point, sellers may regain control.
A breakdown below 0.9300 could trigger further downside toward 0.9200 or lower.
📉 Sell Setup Invalid Until: Price closes below 0.9300 on strong volume.
🧭 Conclusion:
This chart suggests a critical decision point for EUR/CHF. A bounce from the reversal zone followed by a confirmed break above resistance could signal the start of a medium-term uptrend. Traders should monitor price action closely for confirmation signals near the trendline and EMA zones.
🚦 Bias: Neutral to Bullish, awaiting confirmation
🧠 Tip: Watch for candlestick patterns (like bullish engulfing or pin bars) near the support zone for early entries.
Technical Levels Respected – BTC Reaches $108K Target📍 BTC Target Hit with Precision!
✅ As predicted in the previous analysis, Bitcoin has successfully tapped the $108K resistance zone — clean and technical execution!
📊 My chart spoke in advance... and the market listened.
🎯 Why miss out on these accurate forecasts?
📉 My strategies are not just random lines — they’re built on solid market structure, EMAs, and key price action zones.
📢 Let’s stay connected!
🧠 I’m committed to sharing educational content and professional trading insights to help you grow as a trader.
💡 Whether you're a beginner or seasoned trader, there’s always something new to learn with me.
📚 Join the journey — learn, trade, and win!
📩 DM or follow to get consistent updates and chart breakdowns.
🚀 Let’s trade smart, not hard!

Key Rejection Zone Approaching – Bearish Setup in PlayChart Summary:
Asset: Unspecified (USD-based)
Timeframe: Short-term (likely 1H or 4H)
Indicators:
EMA 50 (red): 3,245.772
EMA 200 (blue): 3,223.635
Key Zones:
Resistance Zone (Red box): ~3,310–3,360
Target/Support Zone (Red box): ~3,110–3,160
Mid Support Zone (Blue box): ~3,200–3,230
Trendline: Downward sloping resistance connecting major highs
---
Technical Breakdown:
Trend Analysis:
Primary Trend: Bearish ⬇️
Confirmed by the downtrend line (black) which has been respected multiple times (3 clear touches).
Current Price: 3,290.090
Price is approaching a key confluence zone: resistance area + trendline.
This area has previously acted as strong supply.
Moving Averages:
EMA 50 > EMA 200: Minor bullish signal (Golden Cross), but price action is still below major resistance.
However, this cross may be a false signal if price gets rejected here.
---
Price Action:
Current Move: Strong bullish push toward resistance after rebounding from the target zone ✅
The resistance zone and trendline are likely to act as a rejection point unless broken decisively.
---
Bearish Scenario (High Probability):
If price fails to break above the resistance zone:
Expect a rejection and move back toward:
Blue mid-support: ~3,220
Target zone: ~3,130 (major demand area)
Confirmation: Bearish candlestick pattern or strong wick rejections near resistance.
🔵 Entry Idea: Short near 3,310–3,350
🎯 Target: 3,130 zone
✋ Stop-Loss: Above 3,360 (above trendline + resistance)
---
Bullish Scenario (Less Likely):
If price breaks above the resistance zone with strong volume:
Could signal trend reversal
Next target levels: ~3,400+
---
Conclusion:
Bias: Bearish near resistance zone
Key Level to Watch: 3,310–3,360 (critical for direction)
Trading Approach: Wait for confirmation, don't preemptively short without rejection signals.

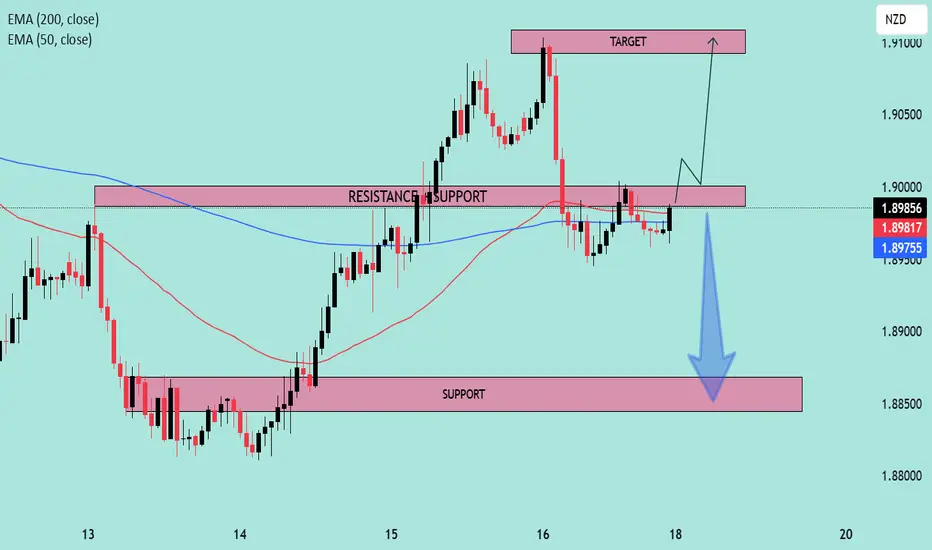
EURNZD at Key Decision Zone | Breakout or Breakdown? 📊 Pair: EURNZD
🕒 Timeframe: Likely H1 or H4
📅 Date: May 18, 2025
🔍 Technical Analysis
🔁 Key Zones
🔴 Resistance-Turned-Support (RTS):
1.8975 – 1.8990
This area was previously a resistance level that price broke above, and is now acting as a critical support zone (flip zone). Price is currently retesting this area.
🎯 Target Zone (Resistance):
1.9085 – 1.9110
This is the next projected bullish target if price successfully rebounds from current support.
🛑 Major Support Zone:
1.8840 – 1.8860
Strong buying interest was seen here previously, acting as a safety net in case of bearish rejection from the current level.
🔄 EMA Confluence
📘 EMA 200 (Blue): 1.8975
📕 EMA 50 (Red): 1.8981
Price is hovering around the EMAs, indicating a moment of decision. A decisive move above these EMAs could trigger bullish momentum. 📈
🔮 Scenario Outlook
🟢 Bullish Scenario (Preferred Setup)
✅ Confirmation above 1.8990
➡️ Retest and continuation could push price toward the 1.9100 target zone.
🔼 Momentum supported by prior breakout and higher lows.
📌 Entry Idea: Above 1.8995
🎯 Target: 1.9100
🛡️ Stop: Below 1.8950
🔴 Bearish Scenario
❌ If price fails to hold the 1.8970–1.8990 zone, a breakdown could follow.
⬇️ Likely move toward 1.8850 support zone.
🚨 Watch for bearish engulfing or rejection candles near resistance.
🧠 Summary
Price is at a key decision point.
✅ Bullish bias is slightly stronger due to market structure (higher highs & higher lows).
⚠️ But a clean break below support would shift focus to the downside.
📈 Strategy: Wait for confirmation ⚖️
Bullish: Break + retest of 1.8990
Bearish: Breakdown below 1.8950 and close under EMAs
Critical Reversal or Breakdown? | XAU/USD at Make-or-Break Zone 📉 Chart Overview:
Instrument: XAU/USD (assumed from chart context)
Timeframe: 4H or Daily (based on candlestick size)
Indicators Used:
📏 EMA 50 (Red): 3,247.86
📏 EMA 200 (Blue): 3,221.42
🔍 RSI (14): Currently at 45.90 (below midline, showing weak momentum)
🔎 Key Zones:
🧱 Support Zone: ~3,180 – 3,220
Price is currently sitting on this key demand zone.
Price previously bounced here sharply ➡️ indicating buyer interest.
📦 Resistance Block: ~3,260 – 3,280
Short-term resistance, price has been repeatedly rejected from here.
🎯 Target Zone: ~3,420 – 3,460
If price breaks out from the support-resistance squeeze, this is the potential bullish target 🎯.
🧭 EMA Analysis:
EMA 50 is still above EMA 200 ➡️ Golden Cross formation (medium-term bullish bias) ✅
However, price is currently below both EMAs, signaling short-term weakness ❌
📉 Bearish Scenario (📍Blue Arrow Down):
If price breaks below the support zone at ~3,180, we could see a sharp drop toward the next support at ~3,032 🔻.
RSI is trending down near 40, close to oversold territory ⚠️
🚀 Bullish Scenario (📈 Blue Arrow Up):
A successful retest and bounce from this support area (currently forming a rounded bottom 🥄) could lead to a bullish move toward the target zone.
This is further supported by the potential RSI bounce from the 40 area, signaling renewed momentum 🔋.
✅ Bias & Conclusion:
Neutral-to-Bullish Bias 🤝: As long as the price holds above the major support zone (~3,180), buyers have a chance to reclaim higher levels.
Look for confirmation breakout above the local resistance (~3,260) for a move toward 3,400+ 🚀.
A breakdown below support would invalidate the bullish thesis and target 3,030 instead 📉.
🛠️ Trading Plan (not financial advice!):
Long Entry: On bullish breakout & retest of ~3,260 ✅
Stop-Loss: Below ~3,180 ⚠️
Target: ~3,420 – 3,460 🎯

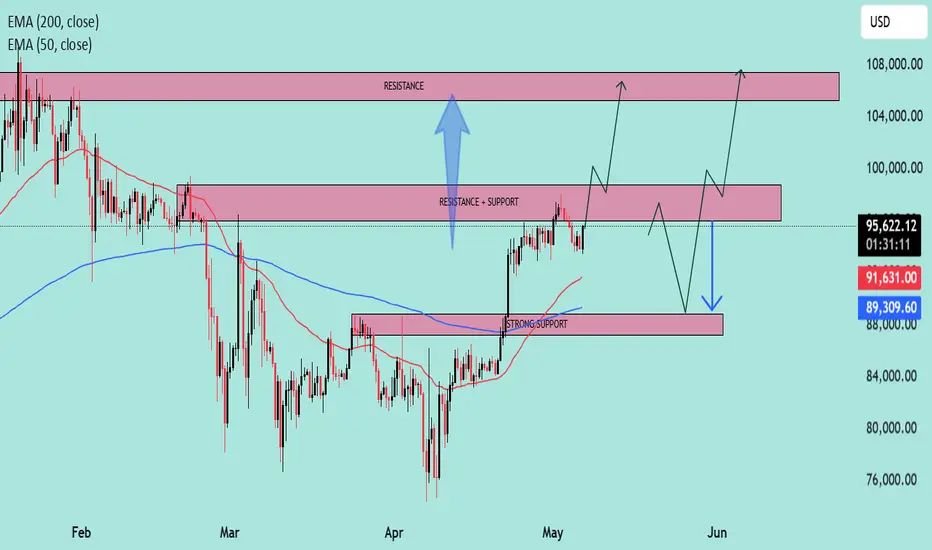
BTC at Key Inflection Zone – Breakout or Rejection Ahead?Asset: BTC/USD
Timeframe: 4H or Daily (based on visual pattern structure)
As of: May 6, 2025
Indicators:
50 EMA (Red): $91,615.79
200 EMA (Blue): $89,305.75
Key Technical Zones:
🔴 Resistance Zone: ~$104,000 – $108,000
This area has historically acted as a major supply zone.
Price has been rejected from this level multiple times, indicating strong selling pressure.
🔁 Flip Zone (Resistance turned Support/Support turned Resistance): ~$95,500 – $100,000
The current price ($95,234.23) is testing this zone from below.
A confirmed break and hold above could signal continuation toward the higher resistance.
🟢 Strong Support Zone: ~$88,000 – $91,000
Confluence of 50 EMA and 200 EMA adds strength to this demand zone.
Previous breakout level and accumulation area.
EMA Outlook:
50 EMA > 200 EMA: Short-term bullish crossover is active, indicating bullish momentum.
Both EMAs are sloping upward slightly, suggesting trend strengthening.
Price is currently above both EMAs, which acts as dynamic support.
Potential Scenarios:
✅ Bullish Scenario:
If price reclaims the $95,500–$100,000 resistance-turned-support zone:
Expect upward momentum to continue.
Target: $104,000–$108,000 zone.
Break of $108K could lead to a macro bull continuation.
⚠️ Bearish Scenario:
If price rejects the current zone and fails to hold above the $91,000 support:
Look for retest of $88,000–$89,000 area (confluence with EMAs).
Breakdown below that zone would invalidate bullish structure and signal potential deeper correction.
Summary:
Bias: Bullish above $91K, Neutral between FWB:88K –$91K, Bearish below $88K.
Key Confirmation Needed: Daily close above $100,000 for strong bullish continuation.
Risk Management: Watch for fakeouts within the $95K–$100K range due to past volatility.