"Silver – Bearish Move Toward Support"🧠 Market Overview:
Instrument: Likely Silver (based on file name).
Chart Context: The price is currently trading below both the 50 EMA (red) and 200 EMA (blue), indicating bearish momentum and a possible shift in market structure.
📊 Key Technical Components:
🔹 Exponential Moving Averages (EMA):
50 EMA (32.614) is above the 200 EMA (32.526) but both are above the current price.
This crossover is recent and could indicate the beginning of a larger downtrend if confirmed by continued price action below both EMAs.
🔹 Market Structure:
POI (Point of Interest) marks a previous swing high where selling pressure emerged.
The chart shows internal liquidity (INT.LQ) sweeps both above and below consolidation areas, hinting at smart money manipulation to grab liquidity before making a move.
🔹 Resistance Zone:
Clearly defined between approx. 33.4–34.0, where price was rejected after a failed attempt to break higher.
Multiple rejections from this zone show strong selling pressure.
🔹 Support Zone:
Sitting between approx. 30.8–31.2.
Price previously consolidated here before a bullish move, making it a likely target for a return test or a potential bounce.
📉 Bearish Scenario & Projection:
The price broke below a short-term structure and failed to hold above EMAs.
The current price action shows a bearish pullback likely to form a Lower High (LH).
The projected path shows a pullback to previous support-turned-resistance, followed by a breakdown targeting the support zone.
✅ Bias:
Short-term bias: Bearish
Medium-term bias: Bearish, unless price reclaims the 200 EMA and consolidates above the resistance zone.
🔍 Confluences Supporting Bearish Outlook:
Price below EMAs (dynamic resistance).
Failed higher highs with liquidity sweeps (indicating smart money selling).
Clear market structure shift to the downside.
Anticipated retest of support zone around 30.8–31.2.
Technicals

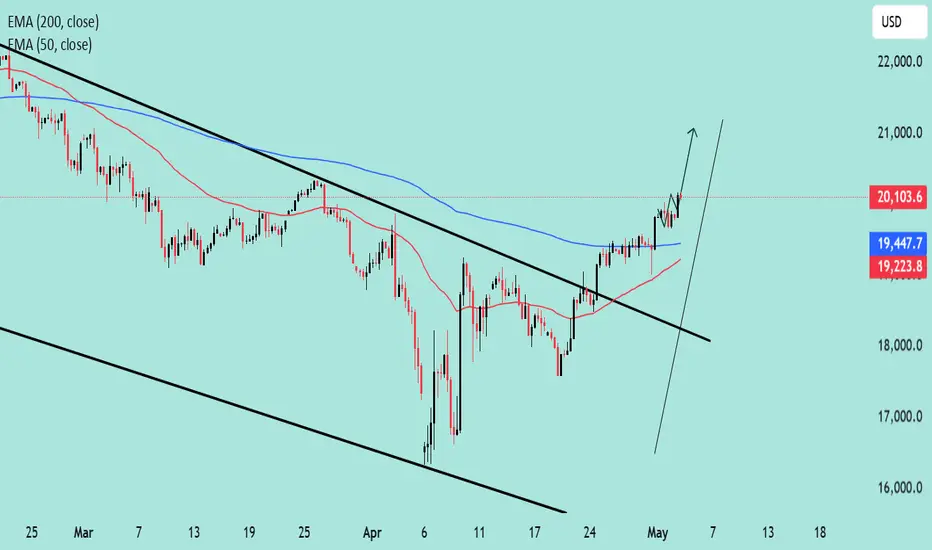
NASDAQ Eyes Higher Highs Bullish Reversal in Play 📈 NASDAQ Outlook: Bullish Momentum Builds Up
✅ Breakout Confirmed: Price action has broken above the descending channel, signaling a reversal from the previous downtrend.
📊 EMA Crossover: The 50 EMA is crossing above the 200 EMA (a golden cross), historically a bullish indicator.
🔼 Momentum Strong: Price is accelerating above EMAs with a steep upward trajectory, suggesting buyers are in control.
🔮 Potential Target: With sustained momentum, price could aim for the 21,000+ region in the short term.
If the price sustains above the 19,500 zone, dips could be considered buying opportunities in the current bullish structure.
"EUR/AUD Bearish Channel with Key Support Ahead"📉 Market Structure Analysis (Bearish Bias)
Current Trend:
The pair is trading within a well-defined descending channel, indicating a bearish trend. Price action is forming lower highs and lower lows, adhering to the channel boundaries.
Moving Averages (EMA):
EMA 50 (Red) at 1.77491 is above the price, acting as dynamic resistance.
EMA 200 (Blue) at 1.73338 is close to current price, likely to act as a support area in the short term.
The bearish crossover between the 50 EMA and current price supports the continuation of downward momentum.
🔍 Key Zones:
Weak Resistance Zone:
Located around 1.7740 – 1.8000, previously a support area, now acting as resistance.
Price rejection from this zone multiple times indicates sellers' strength.
Support Zone:
Located around 1.6950 – 1.7100, where demand may return.
This zone coincides with the lower boundary of the descending channel, making it a likely reaction zone.
📊 Forecast / Expectation:
The chart projects a bear flag / corrective pullback before another leg downward toward the support zone.
If price breaks and sustains below the EMA 200, it will likely accelerate bearish pressure.
The descending channel suggests potential continuation to the downside unless price breaks out of the upper boundary with momentum.
✅ Trade Implications:
Bearish Setup:
Look for short opportunities on intraday pullbacks near the resistance or EMA 50.
Bullish Invalidations:
A breakout above the descending channel and sustained move above 1.7800 would invalidate the bearish outlook.
Conclusion:
This chart presents a technically clean bearish setup. The confluence of a descending channel, EMA rejection, and defined resistance/support zones suggests the EUR/AUD may continue lower, especially if it loses the 1.7300 level decisively.

XAU/USD Market Outlook – Key Levels & Scenarios (May 2025)📊 Market Overview
Asset: XAU/USD (Gold vs. USD) – likely
Timeframe: 🕒 4H or Daily
EMAs:
🔴 50 EMA = 3,281 (short-term trend)
🔵 200 EMA = 3,179 (long-term trend)
🧱 Key Zones
🔺 Main Resistance Zone (🚫 Supply Area)
📍 ~3,320–3,400
🔍 Observation: Strong rejection zone with multiple failed attempts. 🚧 Price struggles to break and hold above here.
⚖️ Mid Support & Resistance Zone
📍 ~3,200–3,250
🧭 Current Action: Price is consolidating here. This is a key decision zone. A bounce or breakdown will likely decide the next big move. 🤔
🟦 Main Support Zone
📍 ~2,980–3,030
🛑 Observation: Major demand zone. If price falls here, it might attract buyers 👥 for a potential rebound.
📉 EMA Analysis
🔴 50 EMA is above 🔵 200 EMA → Trend still technically bullish ✅
🟡 BUT: Price is currently below 50 EMA, showing short-term weakness ⚠️
⚡️ 200 EMA is nearby (~3,179): Acting as dynamic support — a critical bounce zone! 🛡️
🔮 Scenarios
🐂 Bullish Path
✅ If price bounces from 3,200 support zone and reclaims 🔴 50 EMA:
🎯 Target: Retest of 3,320–3,400 🔺 zone
📈 Confirmation: Strong candle closing above 3,281 🔴 EMA
🐻 Bearish Path
🚨 If price breaks below 3,200 & 200 EMA:
🕳️ Expect drop towards 2,980–3,030 🟦 zone
📉 Confirmation: Candle closes below 3,179 with weak retest
✅ Conclusion
📍 Key Level to Watch: 3,200
⚖️ Market Sentiment: Neutral → Bearish bias unless price reclaims 50 EMA
🔒 Risk Tip: Avoid longs until price confirms bullish structure again 🔐

XAU/USD Holding Above $3,050 – Breakout or Pullback Next?XAU/USD Update 📊
Gold just touched $3,061 and is now hovering around $3,056. Price is holding within the ascending channel, showing signs of consolidation.
🟢 Bullish Scenario: If buyers defend this level, we could see another push toward $3,100+, with $3,153 still in play as a key resistance.
🔴 Bearish Risk: A break below $3,050 - $3,020 could trigger a deeper correction toward $2,980, where stronger demand may step in.
📉 Watching price action closely—let’s see how it reacts from here! 🚀

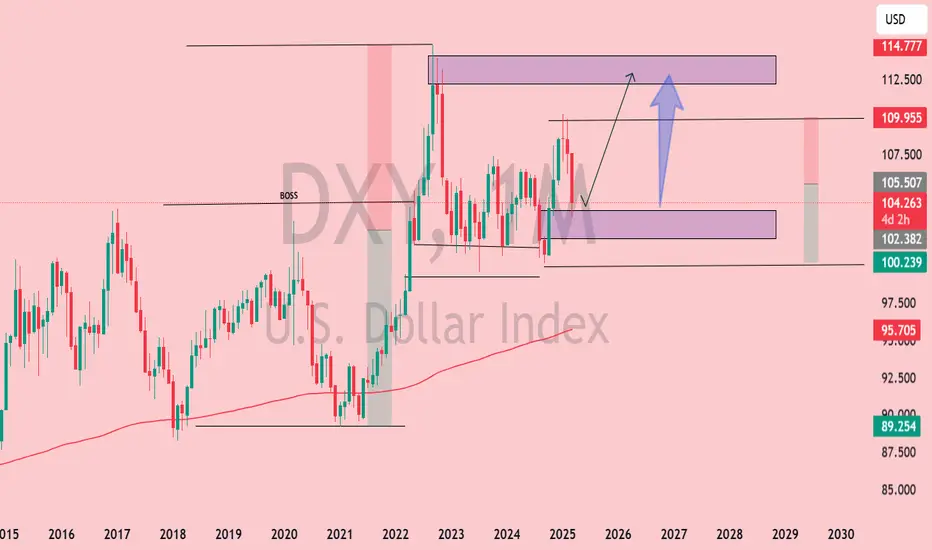
DXY Monthly Analysis: Key Support Holding, Bullish Move Ahead?📊 DXY Monthly Chart Analysis (March 27, 2025)
Key Observations:
Current Price Action:
The U.S. Dollar Index (DXY) is trading near 104.267, with notable resistance ahead.
Price is consolidating within a key demand zone (~102.5–104) after rejecting higher levels.
Technical Levels:
Support Zone: 100.2–104 (Highlighted in purple)
Resistance Zone: 112.5–114.7 (Highlighted in purple)
Major Resistance: 114.77 (Previous high, acting as a supply zone)
200-MA Support: Located below current price, offering a long-term bullish confluence.
Market Structure:
Price remains in a higher time-frame bullish trend but is experiencing a correction.
The "BOSS" level (Break of Structure) suggests a prior bullish breakout.
If the demand zone holds, a bullish continuation towards 112.5–114.7 is possible.
Projected Move:
A bounce from 102–104 could trigger a rally toward the upper resistance zone (~112.5).
A break below 100.2 could indicate a shift in trend and further downside.
Conclusion:
DXY is at a critical decision point. Holding the current support zone (~102–104) could fuel a bullish continuation toward 112–114, while a breakdown below 100.2 would weaken bullish momentum.
Gold (XAU/USD) – Possible Reversal from Resistance XAU/USD (Gold Spot vs. U.S. Dollar) on the 1-day timeframe and shows an ascending channel with key price levels and technical annotations.
Key Observations:
Trend Direction:
The price has been in a strong uptrend since late 2024.
It is currently near the upper boundary of the ascending channel.
Liquidity & Market Structure:
INT.LQ (Internal Liquidity): This suggests an area where liquidity is expected to be taken before a potential move.
MB Unfilled (Market Balances Unfilled): These indicate inefficiencies in price movement that the market may revisit.
Projected Price Action:
The chart shows a potential short-term pullback from the upper boundary.
Expected retracement towards the "fair value range" around $2,800–$2,850.
If this scenario plays out, it would align with price rebalancing and a healthier uptrend continuation.
Key Levels:
Resistance: Around $3,050, which aligns with the upper trendline.
Support Zones: Around $2,950 and deeper at $2,800.
Potential Trading Strategy:
Bearish Case: If rejection occurs at $3,050, short opportunities could exist targeting $2,900–$2,850.
Bullish Case: If price retraces and finds strong support in the fair value range, it could resume its uptrend.

XAU/USD Analysis: Bearish Pullback Towards $3,000 SupportXAU/USD (Gold Spot vs. U.S. Dollar) Technical Analysis - 1H Chart
1. Price Action & Trend Analysis
The market has been in a strong uptrend, characterized by higher highs and higher lows.
Recently, the price faced resistance near the $3,040 level, leading to a rejection.
A pullback is currently in progress, suggesting a possible retracement to a demand zone.
2. Key Levels
Resistance Zone (Supply Zone): Around $3,040 - $3,045 where price has been rejected multiple times.
Support Zone (Demand Zone): Around $3,000 - $3,005, a previous accumulation area.
Current Price: $3,023.695
3. Market Structure & Expected Move
The price tested the resistance zone, failed to break above, and is now reacting downward.
A bearish projection (as shown in the chart) suggests a potential move toward the $3,000 - $3,005 support zone.
If the price reaches this level and finds buying pressure, we could see a reversal or continuation of the uptrend.
4. Indicators & Confluence Factors
Support-Resistance Flip: The previous support at $3,000 could act as a strong support again.
Bearish Momentum: Short-term price action suggests sellers are gaining control after rejection at resistance.
Liquidity Zones: The highlighted purple zones represent institutional order blocks where significant buy/sell orders exist.
5. Trading Plan & Strategy
Bearish Scenario: If price breaks below $3,000, we could see further downside pressure.
Bullish Scenario: A bounce from $3,000 could provide buying opportunities for another attempt at breaking $3,040.
6. Conclusion
The market is currently retracing from resistance, and a short-term bearish move is expected toward $3,000.
Traders should watch for price reaction at $3,000 to determine if it holds as support or breaks for further downside.

TataMotorsTata motors has good setup with Stop loss of just 2%. I can see great support at this level on daily time frame.
Current Price: 919
sl: 900

cup and handle pattern in avadhsugar cup and handle pattern is seen in avadhsugar. break above 856.00 could start a new upward trend with the target of 1300.00 and stoploss below 745.00

Graphite. Breakout stockInverse head and shoulder Break out and retest confirmation on weekly chart. W pattern on daily chart.
Buy price: 630
Follow base Trent line as stop loss.

Insider Bar Formation / Mother Candle40 points Inside Bar 1160 to 1110
Any side breakout closing can get a TG of 37-40 points, wait for
Keep RR 1:2, Resistance 1200 & Support 1080

Nifty is facing this resistance lineYou can see my real-time trading analysis and now bout this chart I think nifty can continue in this consolidation face a few more days with a double bottom resistance line after this consolidation it may continue to bulls if you take a few steps back on nifty chat that you can see from 14 March to 27 March it takes almost complete a month to make double bottom after this break down it continuous bullish and now on thins point nifty making a double bottom again to make bullish itself.
NSE:NIFTY
Anything you feel additional technical patterns or do you think you need to give any advice. Let me know in the comment

TataChem good for short termTata Chem is looking hot for short term which can fetch good returns on the investments.
Take your own bet

HCC - monthly cmp 20Monthly trendline breakout + cup and handle breakout.
Monthly RSI above 60, bullish.
Monthly charts, so it may take time but can give 40-60% returns in 2023
Buying range 17-20
Targets 23-28-32 and if something even better happens, then even 40.
SL - 14 on weekly closing.(around 20-25%)

Nmdc cup breakoutNmdc has broke out of a cup pattern IMO according to the technical analysis theory the target should be around 156 and moreover it has broken out of a channel on 1d timeframe basis.
*Only for educational Purposes, not a financial advice*

Rejection at All time HighMarket never break its all time high in one go it will definitely face rejection from that reason which give us conviction to sell just after rejection candle.

CNX AUTO: Short the rallyAuto index showing sign of exhaustion. Hammer candlestick near the resistance zone. Short the rally near the resistance is the right strategy in the bear market.

Adanigreen making flag pattern and breakout on daily basis Adanigreen making flag pattern and breakout on daily basis. Sustaining above 2030 with good volume can lead to further upmove respect to the following given levels. NSE:ADANIGREEN

HAPPIEST MIND Possible BreakoutThe chart is self explanatory ... target 1 and target 2 is given with stoploss...
trade with your risk... I am not SEBI registered advisor ...

Breakout and retestStock has retested the same breakout level but now the price has shown expansion on upside. Can be a good catch here with low risk high reward

Buy for breakout and dividend! BUY BUYLong term trendline is broken, and also 14dec is the dividend date.
BUYBUYBUY

enj next move, use stop loss.enj next move, use stop loss, best time to big profit lets make some money.......use stoploss, god luck.
