Big Move Coming? Watch This Classic VCP Setup on Shriram FinanceHello everyone, i hope you all will be doing good in your trading and your life as well. Today i have brought a setup which name is VCP (Volatility Contraction Pattern) is one of the most powerful base setups, where the price contracts in multiple tight ranges, showing controlled strength. It signals that supply is drying up and the stock is getting ready for a strong move, usually a breakout. What makes it special is the combination of tightening price with lowering volume , and that's exactly what we can observe in Shriram Finance right now.
The stock has taken multiple supports from key EMAs like 9, 21, and 50 during this entire consolidation, a classic VCP sign. With each dip being bought quickly and bounce getting tighter, the stock is preparing for a potential breakout move.
Keep this one on radar , structure is clean, volume behavior is ideal, and if momentum comes, VCP patterns don’t disappoint.
For levels and risk-reward, please refer the chart above.
Disclaimer: This analysis is for educational purposes only. Please consult a financial advisor before making investment decisions.
Technicalsetup

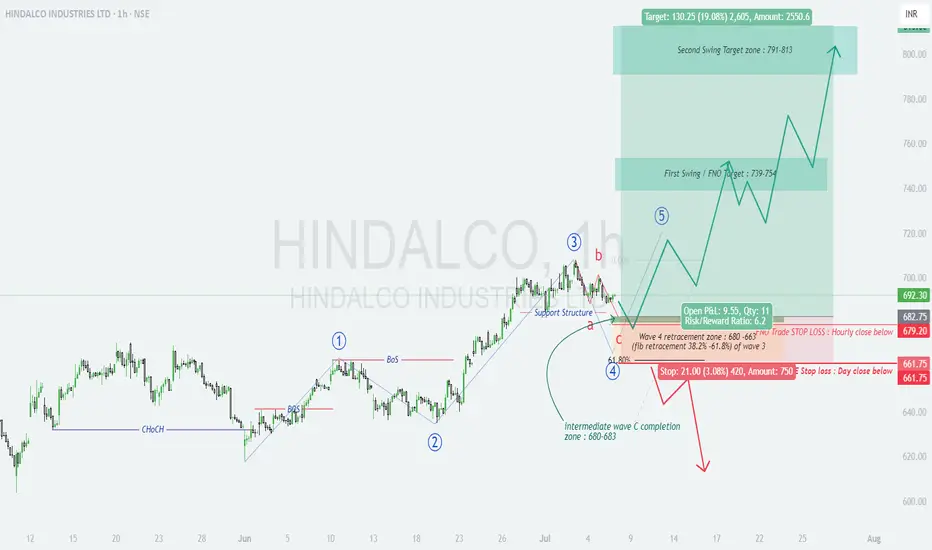
HINDALCO Gearing Up for Wave 5? Entry Zone Locked In for Swing!
📊 HINDALCO – Elliott Wave Analysis (1H Timeframe)
Textbook 5-wave impulse in play – Wave 4 nearing completion
Structurally clean setup with ideal R:R and defined invalidation. High probability long opportunity forming.
🧩 Wave Structure:
Wave 1 to 3 completed; Wave 3 peaked with momentum
Current correction forming a classic ABC zig-zag in Wave 4
Subwaves 'a' and 'b' completed; 'c' approaching ideal completion zone
🔎 Technical Confluence Zone:
Wave 4 Fib Retracement: 38.2–61.8% of Wave 3 → ₹680–663
Support Structure: Aligns with Wave C zone = ₹680–683
Price action showing slowdown → low volatility candles + buyer absorption
Entry zone aligns with high-probability reversal structure
🎯 Upside Targets (Wave 5 Projection):
First Swing Zone: ₹739–754
Second Swing Zone: ₹791–813
🛑 Stop-Loss Zones:
Intraday SL: Hourly close below ₹679.20
Positional SL: Day close below ₹661.75
📈 Reward Potential:
R:R ratio: 6.2+
Structure offers clear risk management and ideal swing setup
A must-watch for swing traders and Elliott Wave learners. Let price react at ₹680–683 zone for confirmation before entry.
#Hindalco #ElliottWave #SwingTrade #WaveAnalysis #TechnicalSetup #NSE
ETH Technicals Hint at Breakout — All Eyes on the 2588 Level📊 Cycle Structure:
HWC (Higher Wave Cycle): Bullish 🔼
MWC (Middle Wave Cycle): Ranging 🔁
LWC (Lower Wave Cycle): Bullish 🔼
The overall market structure leans bullish. With both HWC and LWC pointing upward, the directional pressure favors long setups.
❗️If you're looking for a short position, this analysis isn't for you.
🔍 Price Action Structure & Entry Scenario:
A strong resistance zone at 2588 has already been tested four times.
A fifth touch often increases the probability of a breakout — especially in a bullish-biased environment.
A 1H ascending trendline sits right below the resistance, acting as dynamic support.
📌 My Strategy: Pre-Breakout Entry
My approach focuses on entering before a confirmed breakout — riding the early wave toward resistance.
This includes watching for compression, weak selling volume, and bullish candlestick structures.
⚠️ This method is inherently riskier, and the chance of getting stopped out is higher, so solid risk management is essential.
👥 Based on trading style, here’s how different traders might approach this:
🔁 Reactive traders can wait to see how price reacts at the trendline.
🔓 Breakout traders should wait for a confirmed 15min or 1H close above 2588.
🐳 Those expecting a sharp whale-driven move may consider placing a Buy Stop Order above resistance.
🎯 Entry Levels & Risk Management:
Aggressive Entry: Pre-breakout trigger near 2588 (riskier).
Conservative Entry: Wait for a confirmed breakout candle above 2588.
Stop-loss idea: Below the 1H trendline, acting as a dynamic support.
📉 Invalidation Level:
My bullish outlook holds as long as we’re above 2387.
If price closes below that, I’ll re-evaluate for a possible short — but until then, the focus remains on the long side.
💬 Want me to analyze a specific coin?
Drop it in the comments — I’ll review and pick one for the next post.
⚠️ Without proper risk management, you're just a ticking time bomb.
— PXA 📊

Short Covering Trap Strategy – How to Catch Massive Moves!Hello Traders!
Today, we are diving into one of the most powerful and explosive setups in trading — the Short Covering Trap Strategy . When shorts get trapped and are forced to exit their positions, it can trigger massive upward moves in a very short time. If you can spot these traps early, you can ride some of the fastest rallies in the market!
What is a Short Covering Trap?
Short sellers bet on the market falling by selling first, planning to buy later at a lower price.
When the market suddenly reverses up against their position, they are forced to buy quickly to cover losses — creating a short covering rally .
This forced buying can lead to big green candles, breakout moves, and strong trend continuation .
How to Spot a Short Covering Trap
Identify Weakness or Breakdown Attempt
→ Price tries to break a support level but immediately reverses with high volume.
Sharp Reversal Candle
→ Look for strong bullish engulfing, hammer, or big green marubozu candle after false breakdown.
Volume Spike Confirmation
→ Check for sudden volume surge along with price reversal.
More volume = more trapped shorts.
Breakout Above Resistance
→ If price breaks above immediate resistance after trapping shorts, momentum can explode.
Real Example (OI Study please check chart above)
On 25th April 2025, Nifty faced rejection from the Resistance Zone around 24,100 levels.
OI data at 2 PM showed rising call writing pressure — indicating strong bearish sentiment initially.
By 3:30 PM, signs of weakening call writers emerged as put writers started adding positions, hinting at potential reversal.
On 28th April 2025, after Monday market opening, early morning OI data (9:15 AM and 10:15 AM) showed massive unwinding of call writers and heavy addition of put writing.
This sudden OI shift triggered a Short Covering Trap , leading to a quick rally of around 284 points in a short time.
Entry, Stop Loss, and Target Plan
Entry:
After confirmation candle closes above immediate resistance.
Stop Loss:
Below the reversal candle or recent swing low.
Target:
First target = Previous day's high or next major resistance.
Second target = Risk-Reward 1:2 or more.
When to Avoid This Setup
Low Volume Moves:
If the reversal happens without volume, it’s risky — avoid trading it.
Trending Down Days:
If broader market sentiment is heavily bearish, short covering may not sustain.
Rahul’s Tip
“Short covering rallies are like a firecracker — fast and furious. Ride it with strict risk control and exit smartly at targets.”
Conclusion
The Short Covering Trap Strategy offers some of the best risk-reward trades, especially in volatile markets. Recognize the signs early, manage your risk, and you can catch powerful explosive moves before the crowd!
Have you ever caught a massive short covering rally? Share your best trades and experiences in the comments below!
If you found this post valuable, don't forget to LIKE and FOLLOW !
I regularly share real-world trading setups, actionable strategies, and learning-focused content — all from real trading experience, not theory. Stay connected if you're serious about growing as a trader!

The VWAP Bounce Strategy – BankNifty Traders’ Favourite Setup!Hello Traders!
If you love trading BankNifty, then you must’ve heard of the VWAP Bounce Strategy . It’s one of the most popular and reliable intraday setups used by professional traders. Simple to spot, easy to execute, and highly effective during strong trending days. Today, I’ll explain exactly how to use the VWAP bounce strategy to enter high-probability trades — with confidence and clarity.
What is VWAP & Why It Works?
VWAP (Volume Weighted Average Price) acts as a dynamic support or resistance level during intraday moves.
Institutional traders and smart money often watch VWAP for mean reversion entries or trend continuation setups .
In BankNifty, VWAP bounces happen frequently due to high volatility , offering clean risk-reward trades.
How to Trade the VWAP Bounce Strategy
Step 1 – Wait for a Trend to Establish
→ Price must be trading clearly above or below VWAP to confirm trend bias.
Step 2 – Let Price Pull Back to VWAP
→ Watch for a healthy retracement after a strong move. VWAP should act as a bounce zone.
Step 3 – Confirmation Candle Near VWAP
→ Look for a bullish/bearish engulfing, pin bar, or hammer candle on VWAP.
Step 4 – Entry, SL & Target
→ Enter after confirmation candle closes
→ SL: Below/above the candle or VWAP
→ Target: Recent high/low or 1:2 RR
Check the BANKNIFTY Chart above for practical example
When NOT to Trade This Setup
Inside CPR Day: Sideways market with no momentum? Avoid it.
Choppy Price Action Around VWAP: No clean bounce = no trade.
News-Driven Volatility: Sudden spikes may break VWAP unpredictably.
Rahul’s Tip
“VWAP bounce works best when there’s clean trend & confidence from smart money.” Combine with volume and candle structure — and never force the trade.
Conclusion
The VWAP Bounce Strategy is loved by intraday traders for a reason — it provides structure, clarity, and clean entries . Especially in fast-moving indices like BankNifty, it can be your edge if traded with discipline.
Have you tried this strategy? Share your win/loss experience in the comments — let’s grow together!
