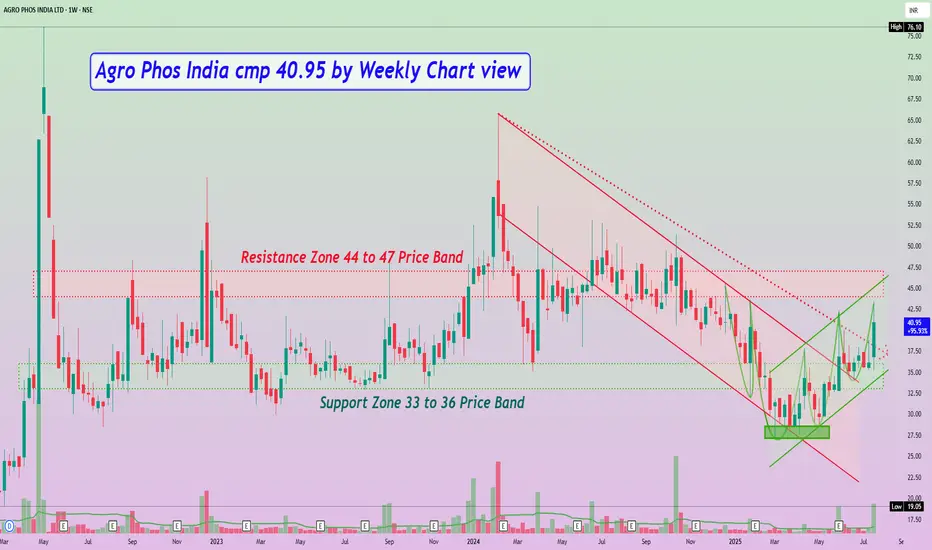
Agro Phos India cmp 40.95 by Weekly Chart viewAgro Phos India cmp 40.95 by Weekly Chart view
- Support Zone 33 to 36 Price Band
- Resistance Zone 44 to 47 Price Band
- Falling Price Channel Breakout has well sustained
- Falling Resistance Trendline Breakout too is maintained
- Bullish Double Bottom "W" by repeat Bullish Rounding Bottoms
- Rising Price Channel momentum steadily taking a gradual uptrend
- Volumes have surged heavily over the week above avg traded quantity
- Most common Technical Indicators BB, EMA, MACD, RSI, SAR seen turning positive
Technicaltrendanalysis
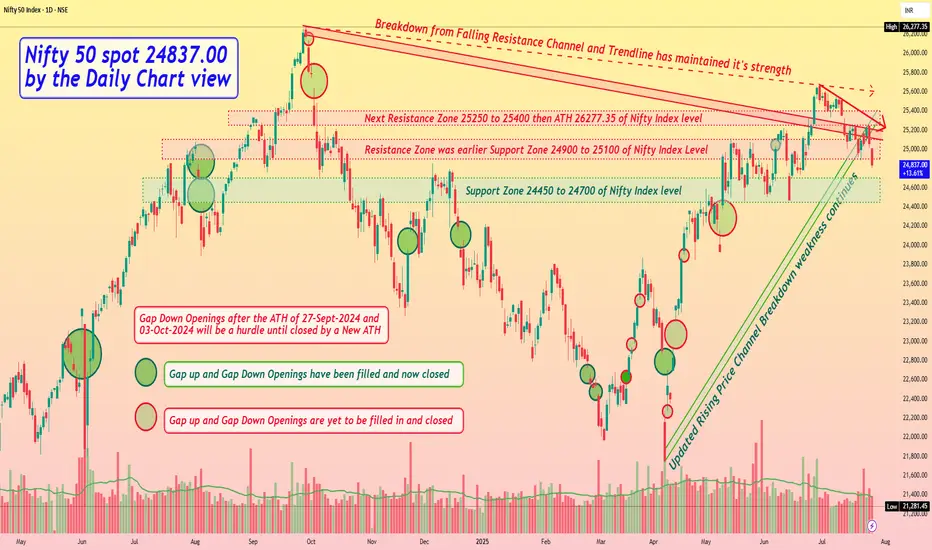
Nifty 50 spot 24837.00 by the Daily Chart view - Weekly updateNifty 50 spot 24837.00 by the Daily Chart view - Weekly update
- Support Zone 24450 to 24700 of Nifty Index level
- Updated Rising Price Channel Breakdown weakness continues
- Resistance Zone was earlier Support Zone 24900 to 25100 of Nifty Index Level
- Next Resistance Zone seen at 25250 to 25400 then ATH 26277.35 of Nifty Index level
- Breakdown from the Falling Resistance Channel and Trendline has maintained it's strength
- *Multiple reasons attribute for weakness and breakdown and that is how Markets show their Supremacy*
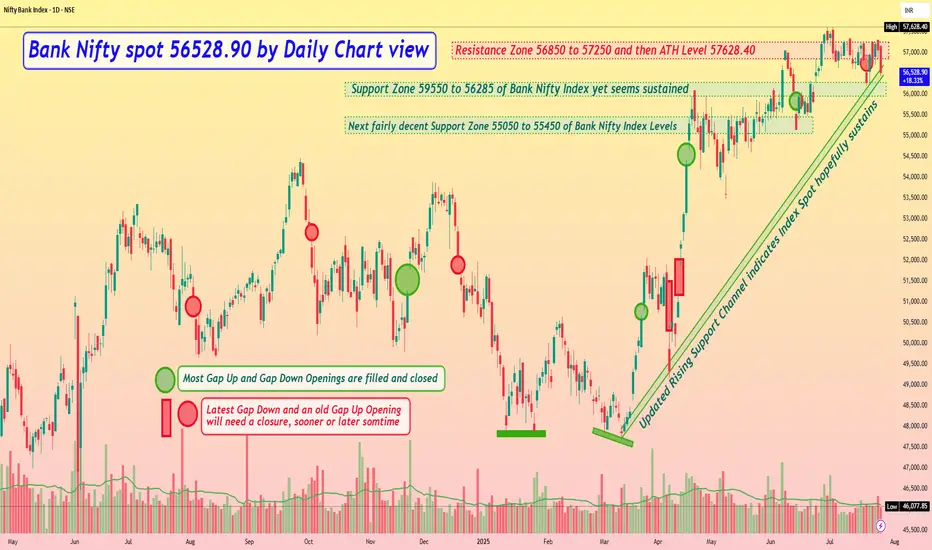
Bank Nifty spot 56528.90 by Daily Chart view - Weekly updateBank Nifty spot 56528.90 by Daily Chart view - Weekly update
- Resistance Zone seen at 56850 to 57250 and then ATH Level 57628.40
- Updated Rising Support Channel indicates Index Spot hopefully sustains
- Support Zone seen at 59550 to 56285 of Bank Nifty Index yet seems sustained
- Next fairly decent Support Zone seen at 55050 to 55450 of Bank Nifty Index Levels
- *Multiple reasons attribute for weakness and breakdown and that is how Markets show their Supremacy*
Paisalo Digital cmp 31.80 by Weekly Chart viewPaisalo Digital cmp 31.80 by Weekly Chart view
- Support Zone 27.50 to 30.50 Price Band
- Resistance Zone 39.50 to 42.50 Price Band
- Rising Support Trendline and Support Zone both are well respected
- Descending Triangle pattern breakout seen in the making process seen for stock chart
- Heavy Volumes surging seen over the past few days indicative of good demand based buying

Sinclair Hotels cmp 106.73 by Daily Chart view since listedSinclair Hotels cmp 106.73 by Daily Chart view since listed
- Support Zone 94 to 99 Price Band
- Resistance Zone 113 to 118 Price Band
- Huge Volumes surged today by demand based buying
- Rising Support Trendline sustained by upside price momentum
- Breakout done and sustained from both the Falling Resistance Trendlines
- 7 odd months long Bullish Rounding Bottom done at Resistance Zone Neckline
- Bullish VCP Pattern is embedded inside the above Bullish Rounding Bottom pattern

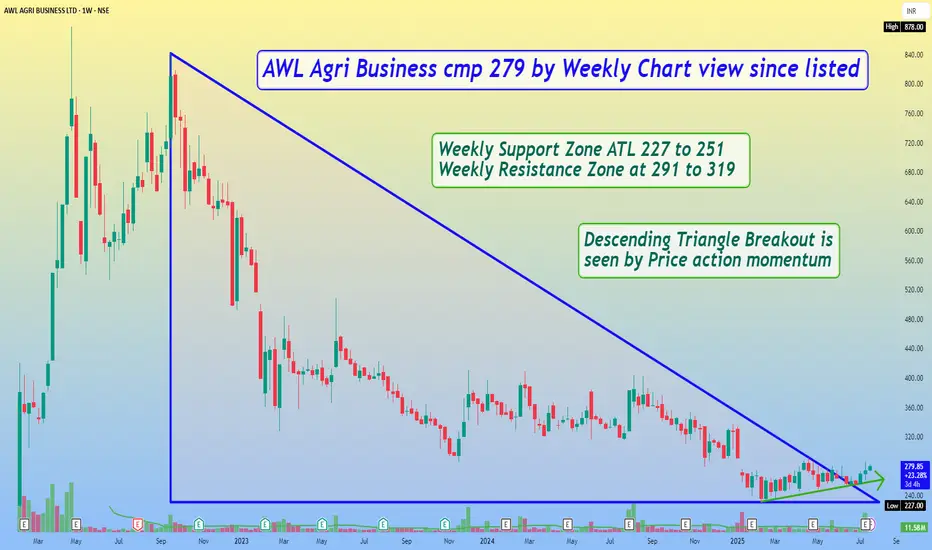
AWL Agri Business cmp 279 by Weekly Chart view since listedAWL Agri Business cmp 279 by Weekly Chart view since listed
- Weekly Support Zone ATL 227 to 251
- Weekly Resistance Zone at 291 to 319
- Descending Triangle Breakout is seen by Price action momentum
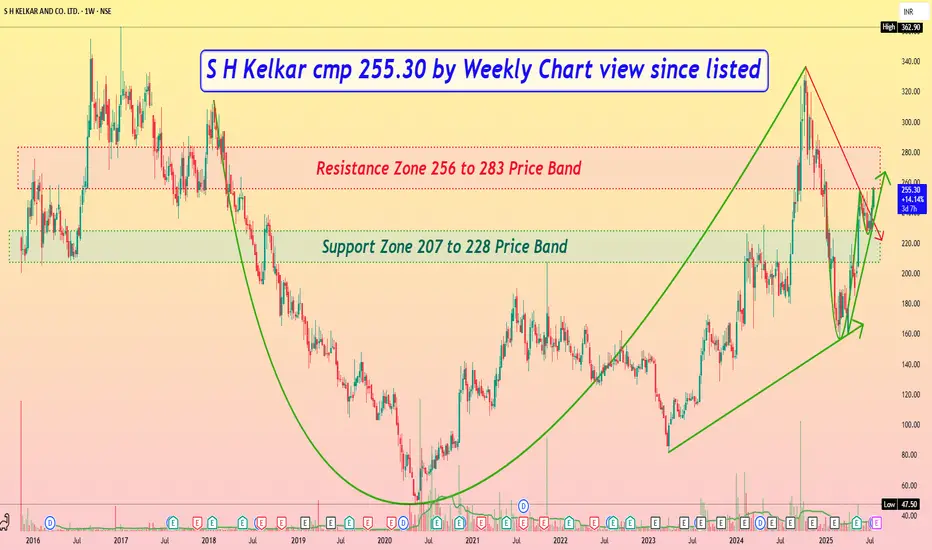
S H Kelkar cmp 255.30 by Weekly Chart view since listedS H Kelkar cmp 255.30 by Weekly Chart view since listed
- Support Zone 207 to 228 Price Band
- Resistance Zone 256 to 283 Price Band
- Volumes trying to sync with average traded quantity
- Support Zone tested retested by upside price momentum
- Bullish Cup & Handle seen completed formation with Resistance Zone neckline
- Fresh Breakout once Resistance Zone is crossed and price sustains closure above it for few days
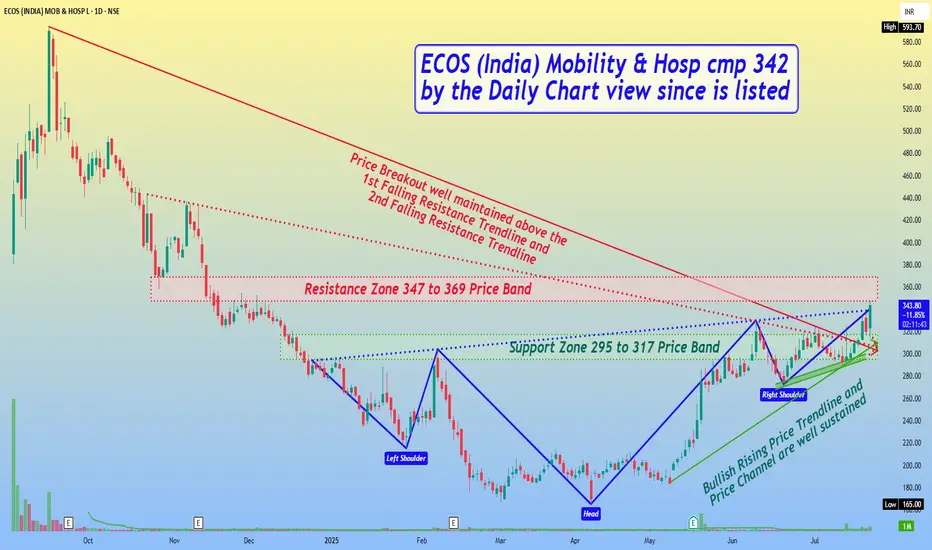
ECOS (India) Mobility & Hosp cmp 342 by Daily Chart since listedECOS (India) Mobility & Hosp cmp 342 by the Daily Chart view since is listed
- Support Zone 295 to 317 Price Band
- Resistance Zone 347 to 369 Price Band
- Bullish Rising Price Trendline and Price Channel are well sustained
- Above may also be interpreted as a Bullish "W" Double Bottom pattern
- *Rising Bullish Head & Shoulders pattern completed at Resistance Zone Neckline
- Volumes are intermittently spiking heavily indicative of demand based buying on the stock counter
- Price Breakout well maintained above the 1st Falling Resistance Trendline and 2nd Falling Resistance Trendline
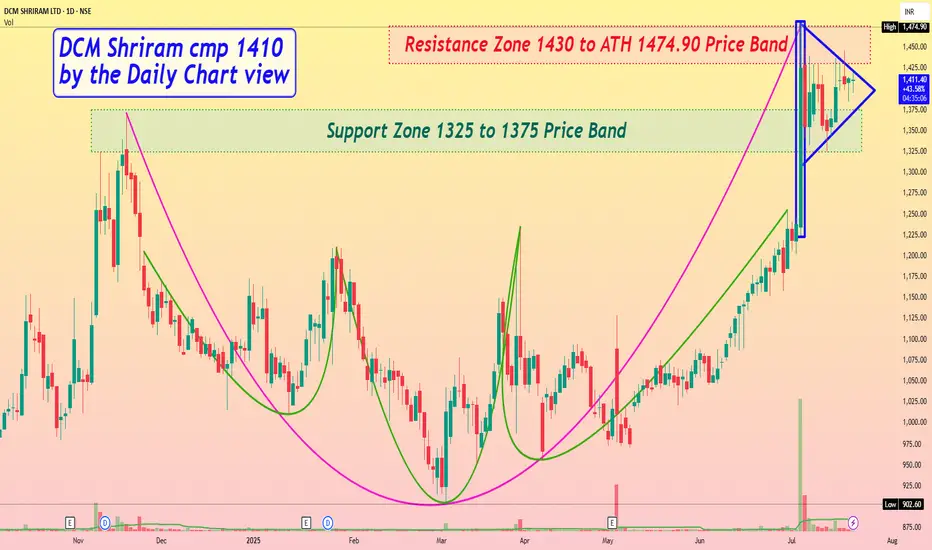
DCM Shriram cmp 1410 by the Daily Chart viewDCM Shriram cmp 1410 by the Daily Chart view
- Support Zone 1325 to 1375 Price Band
- Resistance Zone 1430 to ATH 1474.90 Price Band
- Support Zone been tested retested good and stock now consolidating
- *Bullish Pole and Flag pattern made around Support Zone and Resistance Zone*
- Volumes are flattish to slightly falling, need to increase for fresh upside breakout
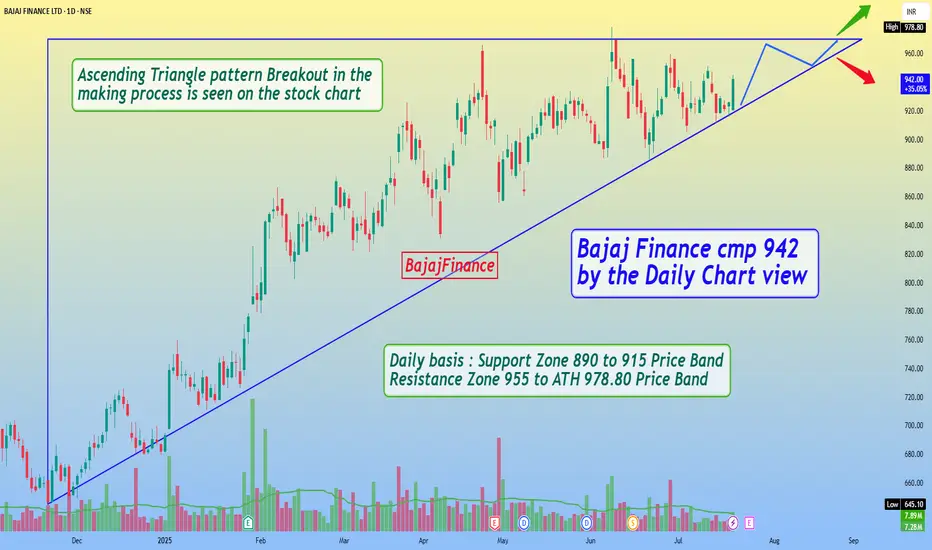
Bajaj Finance cmp 942 by the Daily Chart viewBajaj Finance cmp 942 by the Daily Chart view
- Daily basis : Support Zone 890 to 915 Price Band
- Resistance Zone seen at 955 to ATH 978.80 Price Band
- Ascending Triangle pattern Breakout in the making process is seen on the stock chart
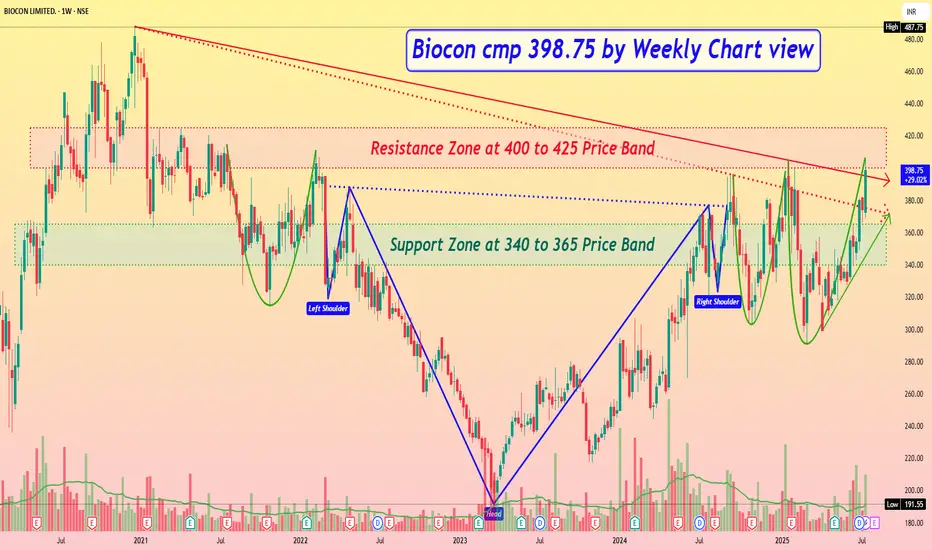
Biocon cmp 398.75 by Weekly Chart viewBiocon cmp 398.75 by Weekly Chart view
- Support Zone at 340 to 365 Price Band
- Resistance Zone at 400 to 425 Price Band
- 2nd Falling Resistance Trendline Breakout attempted
- 1st Falling Resistance Trendline Breakout done and sustained
- Stock Price restrained below Resistance Zone after ATH 487.75 in Dec 2020
- Volumes seen galloping heavily and surging well above the avg traded quantity
- Multiple Bullish Technical patterns completed under Resistance Zone Price Band
- *SUBJECT TO*..... Resistance Zone crossover by few days sustained closure, *ONLY then FRESH BREAKOUT* maybe expected*
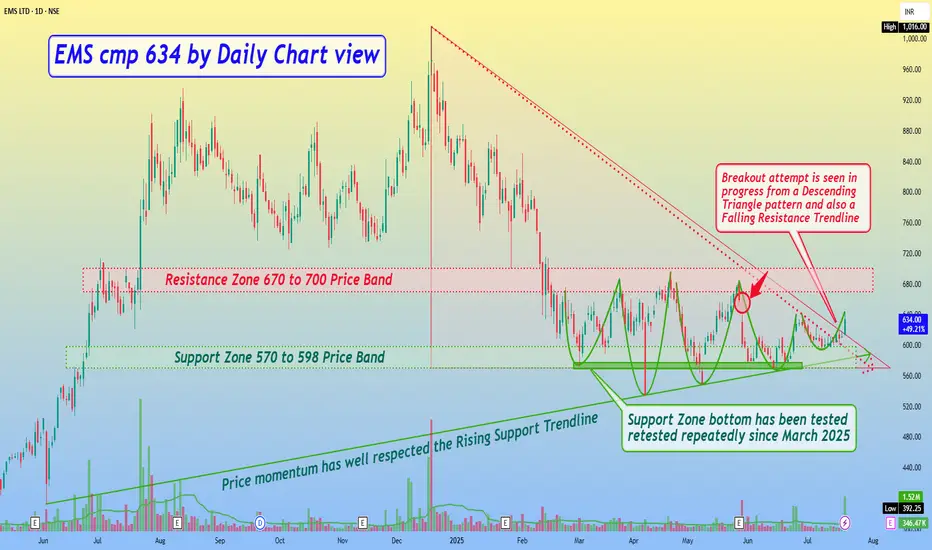
EMS cmp 634 by Daily Chart viewEMS cmp 634 by Daily Chart view
- Support Zone 570 to 598 Price Band
- Resistance Zone 670 to 700 Price Band
- Price momentum has well respected the Rising Support Trendline
- Support Zone bottom has been tested retested repeatedly since March 2025
- *Gap Down Opening of 29-May-2025 will act as tiny hurdle resistance crossing*
- Breakout attempt is seen in progress from a Descending Triangle pattern and also a Falling Resistance Trendline
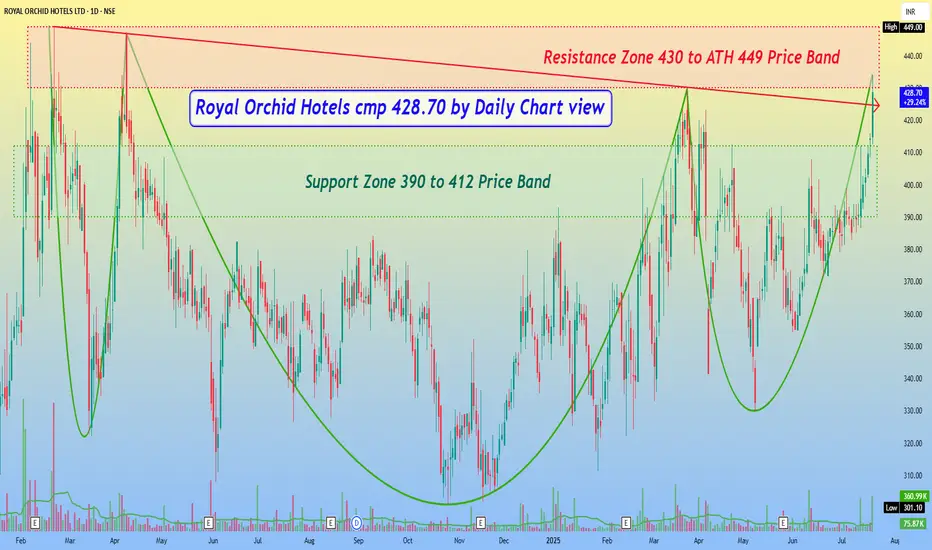
Royal Orchid Hotels cmp 428.70 by Daily Chart viewRoyal Orchid Hotels cmp 428.70 by Daily Chart view
- Support Zone 390 to 412 Price Band
- Resistance Zone 430 to ATH 449 Price Band
- Price attempting Breakout above Falling Resistance Trendline
- Repeated Bullish Rounding Bottoms having Resistance Zone Neckline
- Volumes are seen spiking regularly with heavy surges at intermittent intervals
- Price trending with Positively setup Technical Indicators BB, EMA, MACD, RSI, SAR, SuperTrend
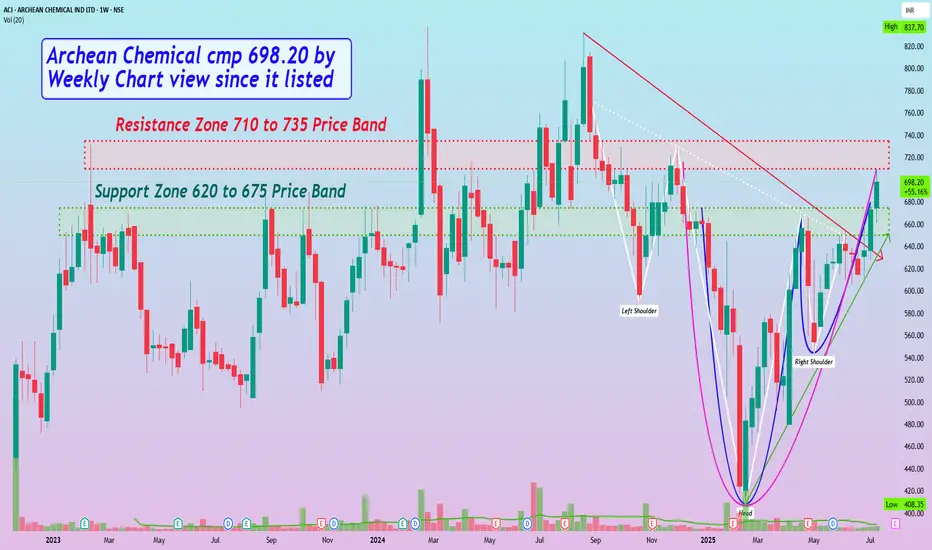
Archean Chemical cmp 698.20 by Weekly Chart view since it listedArchean Chemical cmp 698.20 by Weekly Chart view since it listed
- Support Zone 620 to 675 Price Band
- Resistance Zone 710 to 735 Price Band
- Volumes flattish, need to increase for Resistance Zone Breakout
- Bullish Rounding Bottom inclusive of Cup & Handle pattern completed
- A logically considerate slanting Bullish Head & Shoulder pattern too, has completed
- Falling Resistance Trendline Breakout sustained and Rising Support Trendline respected
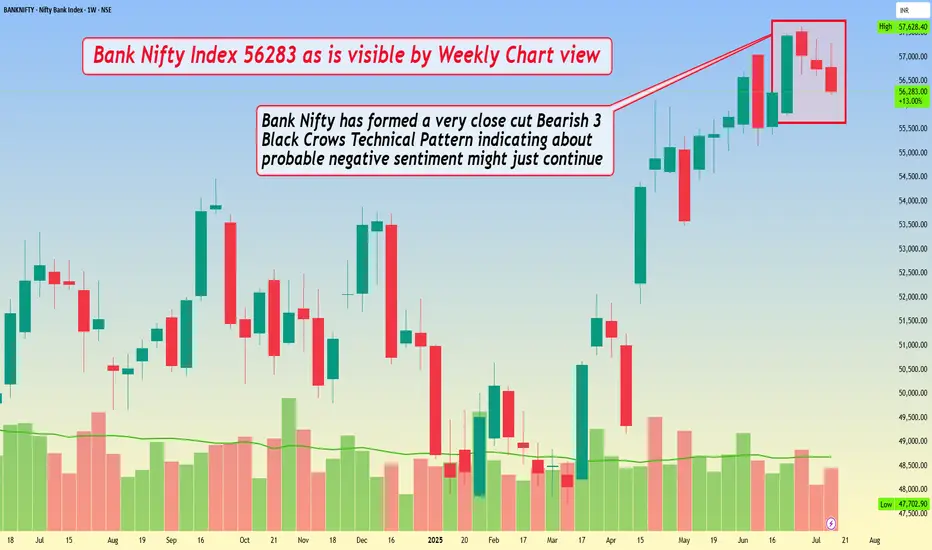
Bank Nifty Index 56283 as is visible by Weekly Chart viewBank Nifty Index 56283 as is visible by Weekly Chart view
- Bank Nifty has formed a very close cut Bearish 3 Black Crows Technical Pattern indicating about probable negative sentiment might just continue
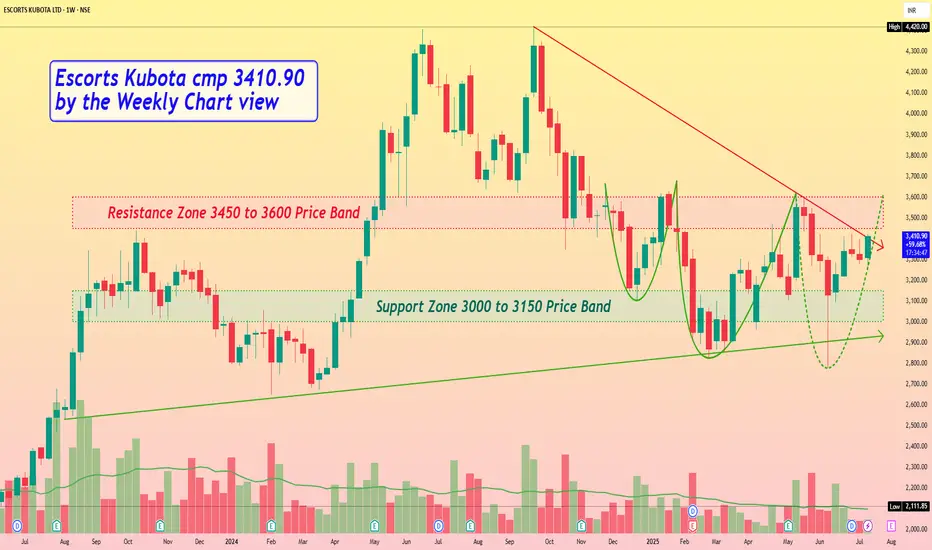
Escorts Kubota cmp 3410.90 by the Weekly Chart viewEscorts Kubota cmp 3410.90 by the Weekly Chart view
- Support Zone 3000 to 3150 Price Band
- Resistance Zone 3450 to 3600 Price Band
- 2 Bullish Rounding Bottoms done, 3rd in completion stage
- Volumes needed to push for fresh breakout across Resistance Zone
- Falling Resistance Trendline Breakout attempted by the current status
- Rising Support Trendline is well respected and sustained by price momentum
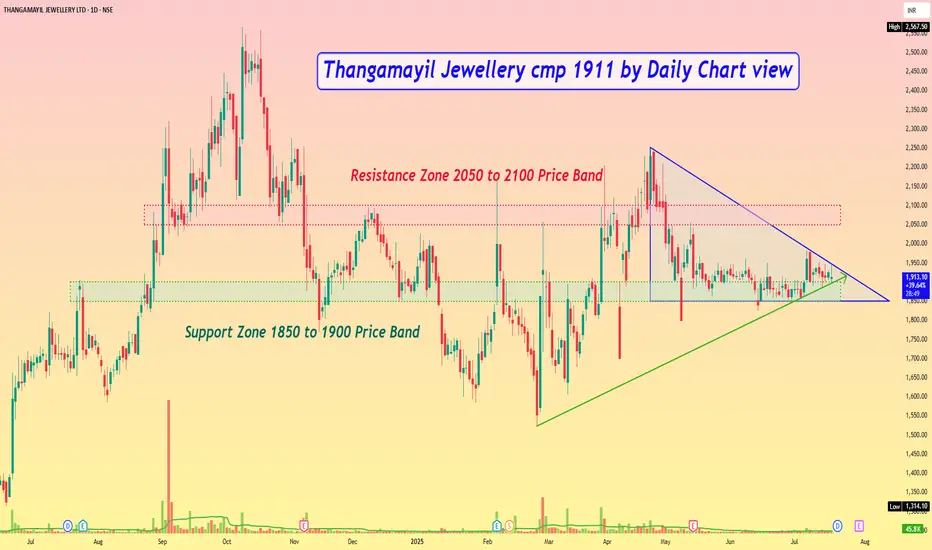
Thangamayil Jewellery cmp 1911 by Daily Chart viewThangamayil Jewellery cmp 1911 by Daily Chart view
- Support Zone 1850 to 1900 Price Band
- Resistance Zone 2050 to 2100 Price Band
- Symmetrical Triangle Breakout in the making process
- Price is currently testing retesting the Support Zone band
- Price action momentum respecting Rising Support Trendline
- Volumes are flat and need to increase for the upside momentum
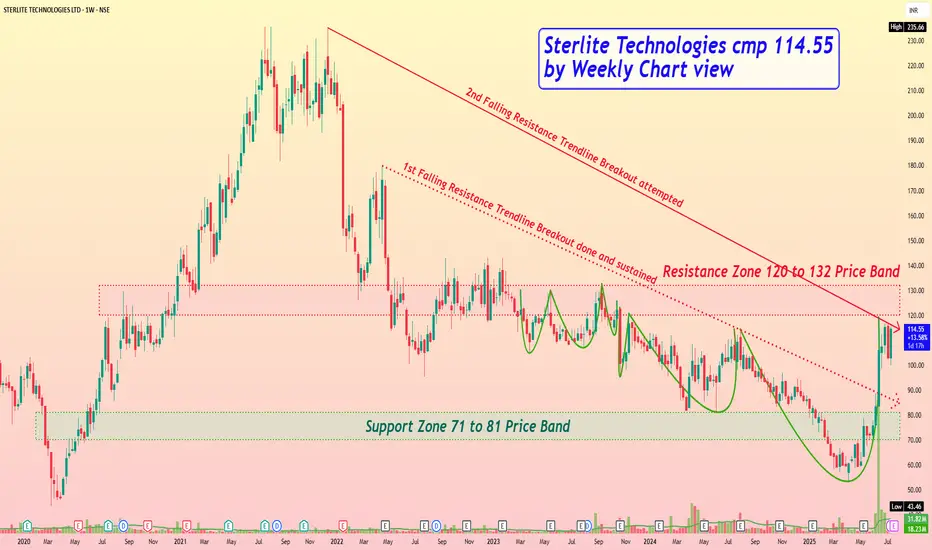
Sterlite Technologies cmp 114.55 by Weekly Chart viewSterlite Technologies cmp 114.55 by Weekly Chart view
- Support Zone 71 to 81 Price Band
- Resistance Zone 120 to 132 Price Band
- 2nd Falling Resistance Trendline Breakout attempted
- 1st Falling Resistance Trendline Breakout done and sustained
- Volumes spiked heavily over past few days by demand based buying
- Repeated Bullish Rounding Bottoms indicate probable Breakout above Resistance Zone neckline
LIC Housing Finance cmp 637.05 by Daily Chart viewLIC Housing Finance cmp 637.05 by Daily Chart view
- Support Zone 600 to 625 Price Band
- Resistance Zone 660 to 685 Price Band
- Rising Support Trendline seen well respected
- Volumes have spiked heavily today by demand based buying
- Breakout seemingly sustained for Double Falling Resistance Trendlines
- Support Zone acting as neckline for Multiple Bullish Technical Chart patterns
- Most common Technical Indicators BB, EMA, MACD, RSI, SAR trending positively
- Bullish Rounding Bottoms with considerate Cup & Handle and a faintly observant Head & Shoulders too

Vascon Engineers cmp 55.70 by Weekly Chart viewVascon Engineers cmp 55.70 by Weekly Chart view
- Support Zone 49.50 to 53.50 Price Band
- Resistance Zone 49.50 to 53.50 Price Band
- Volumes are getting close to average traded quantity
- Common Technical Indicators BB, EMA, SAR, MACD, RSI indicating positive trend
- Multiple Bullish Technical Chart patterns have emerged on the Daily and Weekly Charts
- Rounding Bottom, Head & Shoulders, Cup & Handle, VCP, as one may observe and interpret
