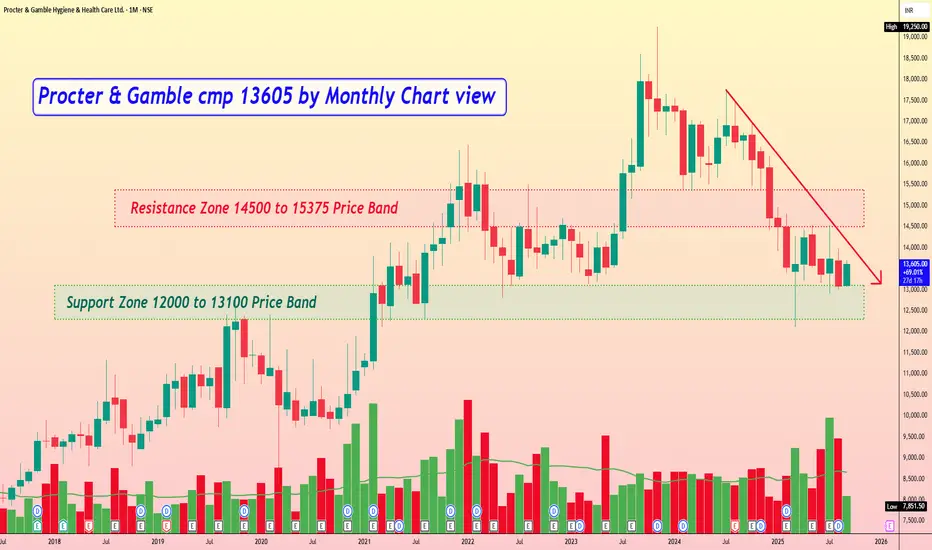
Procter & Gamble cmp 13605 by Monthly Chart viewProcter & Gamble cmp 13605 by Monthly Chart view
- Support Zone 12000 to 13100 Price Band
- Resistance Zone 14500 to 15375 Price Band
- Support Zone is under testing retesting phase by Weekly Chart view
- Subject to the Resistance Zone Breakout, one my anticipate for ATH 19250 as 1st target and then sky is the limit.
Technicaltrendoutlook
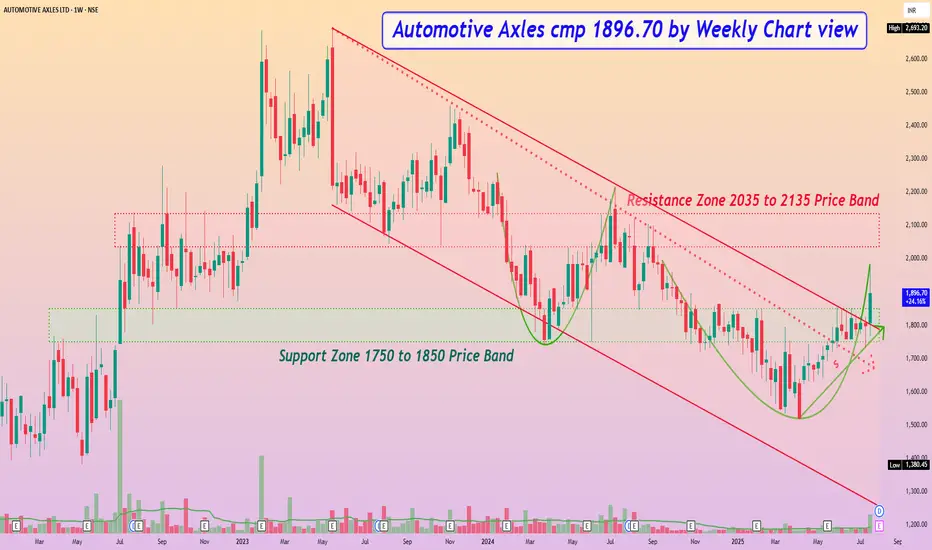
Automotive Axles cmp 1896.70 by Weekly Chart viewAutomotive Axles cmp 1896.70 by Weekly Chart view
- Support Zone 1750 to 1850 Price Band
- Resistance Zone 2035 to 2135 Price Band
- Falling Resistance Channel and Trendline Breakout well sustained
- Volumes surged by good demand based buying over the last week
- Bullish Rounding Bottom formed under the Resistance Zone price band
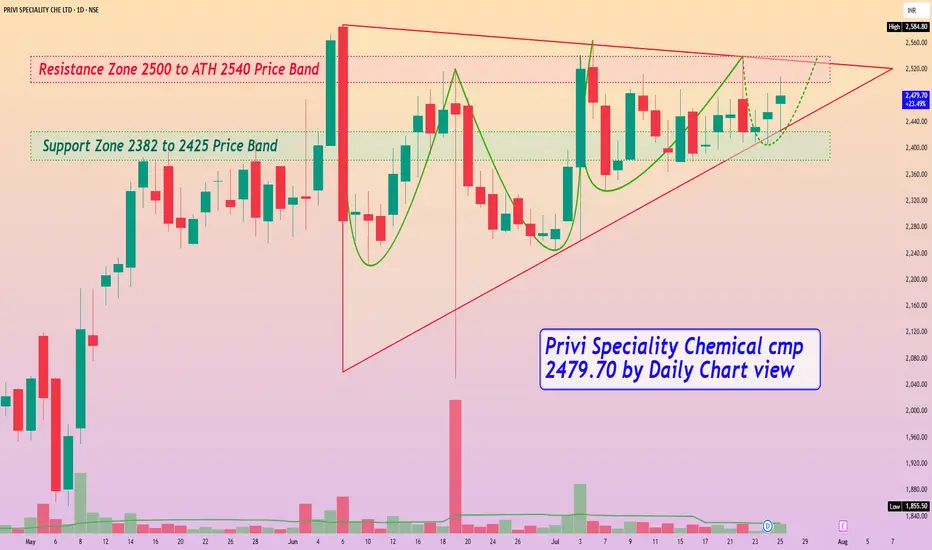
Privi Speciality Chemical cmp 2479.70 by Daily Chart viewPrivi Speciality Chemical cmp 2479.70 by Daily Chart view [/ b]
- Support Zone 2382 to 2425 Price Band
- Resistance Zone 2500 to ATH 2540 Price Band
- Ascending Triangle pattern Breakout in the making process
- Very considerate VCP pattern seems formed on the stock chart
- Volumes seen getting in close sync with the average traded quantity
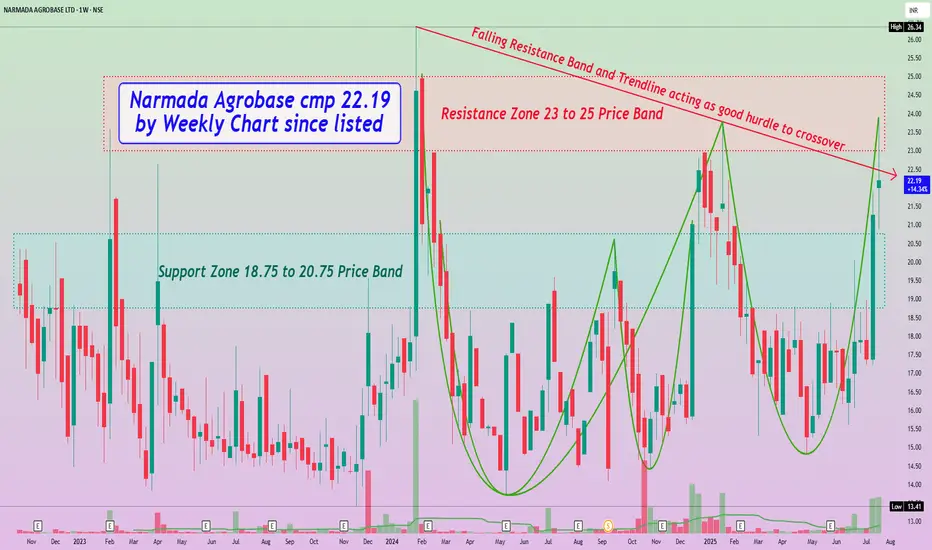
Narmada Agrobase cmp 22.19 by Weekly Chart since listedNarmada Agrobase cmp 22.19 by Weekly Chart since listed
- Support Zone 18.75 to 20.75 Price Band
- Resistance Zone seen at 23 to 25 Price Band
- Falling Resistance Band and Trendline acting as good hurdle to crossover
- Back to Back Bullish Rounding Bottoms formed at Resistance Zone neckline hurdle
- Volumes have spiked up heavily over past 2 weeks well above average traded quantity
- Most common Technical Indicators like BB, EMA, MACD, RSI, SAR are showing positive trend
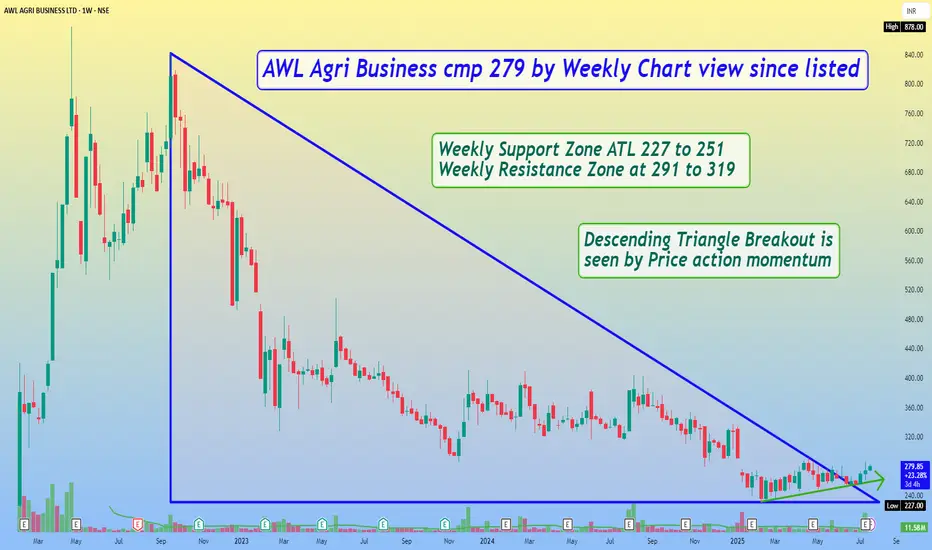
AWL Agri Business cmp 279 by Weekly Chart view since listedAWL Agri Business cmp 279 by Weekly Chart view since listed
- Weekly Support Zone ATL 227 to 251
- Weekly Resistance Zone at 291 to 319
- Descending Triangle Breakout is seen by Price action momentum
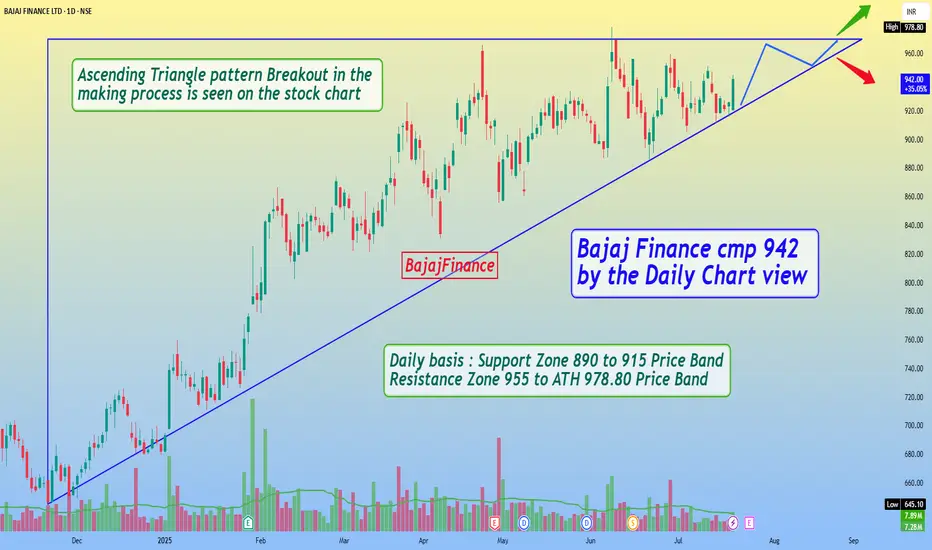
Bajaj Finance cmp 942 by the Daily Chart viewBajaj Finance cmp 942 by the Daily Chart view
- Daily basis : Support Zone 890 to 915 Price Band
- Resistance Zone seen at 955 to ATH 978.80 Price Band
- Ascending Triangle pattern Breakout in the making process is seen on the stock chart
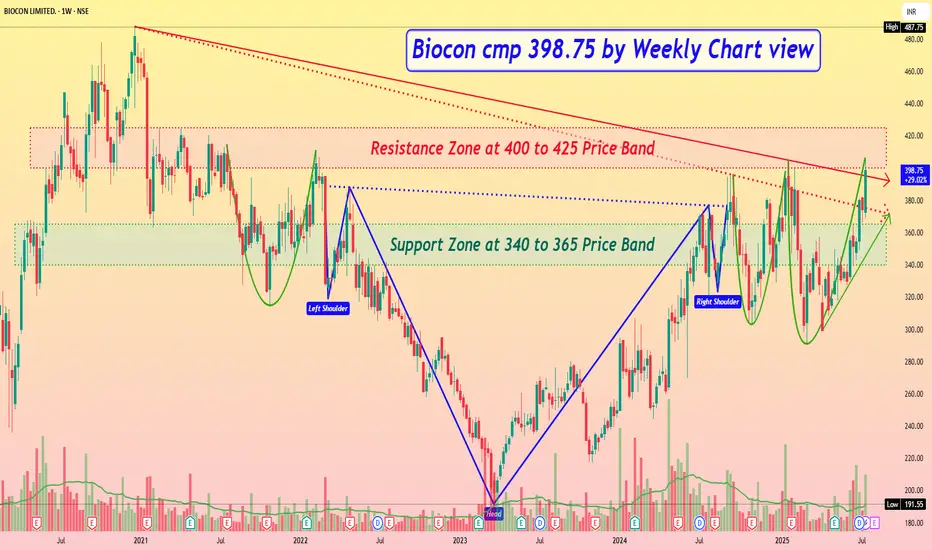
Biocon cmp 398.75 by Weekly Chart viewBiocon cmp 398.75 by Weekly Chart view
- Support Zone at 340 to 365 Price Band
- Resistance Zone at 400 to 425 Price Band
- 2nd Falling Resistance Trendline Breakout attempted
- 1st Falling Resistance Trendline Breakout done and sustained
- Stock Price restrained below Resistance Zone after ATH 487.75 in Dec 2020
- Volumes seen galloping heavily and surging well above the avg traded quantity
- Multiple Bullish Technical patterns completed under Resistance Zone Price Band
- *SUBJECT TO*..... Resistance Zone crossover by few days sustained closure, *ONLY then FRESH BREAKOUT* maybe expected*
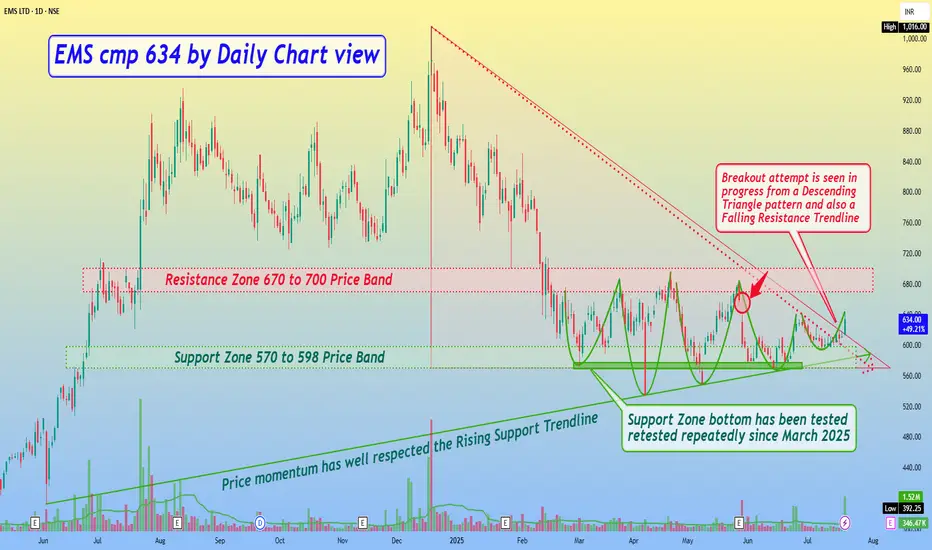
EMS cmp 634 by Daily Chart viewEMS cmp 634 by Daily Chart view
- Support Zone 570 to 598 Price Band
- Resistance Zone 670 to 700 Price Band
- Price momentum has well respected the Rising Support Trendline
- Support Zone bottom has been tested retested repeatedly since March 2025
- *Gap Down Opening of 29-May-2025 will act as tiny hurdle resistance crossing*
- Breakout attempt is seen in progress from a Descending Triangle pattern and also a Falling Resistance Trendline
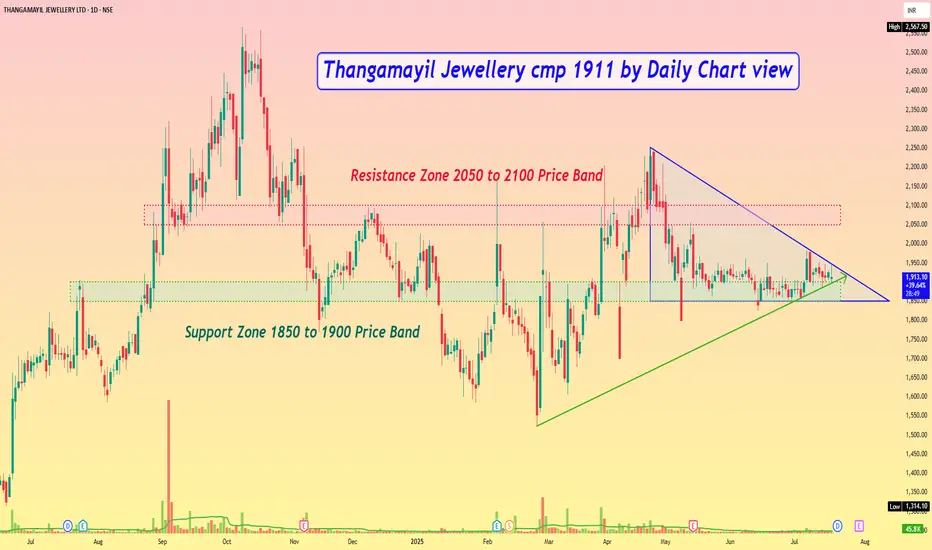
Thangamayil Jewellery cmp 1911 by Daily Chart viewThangamayil Jewellery cmp 1911 by Daily Chart view
- Support Zone 1850 to 1900 Price Band
- Resistance Zone 2050 to 2100 Price Band
- Symmetrical Triangle Breakout in the making process
- Price is currently testing retesting the Support Zone band
- Price action momentum respecting Rising Support Trendline
- Volumes are flat and need to increase for the upside momentum
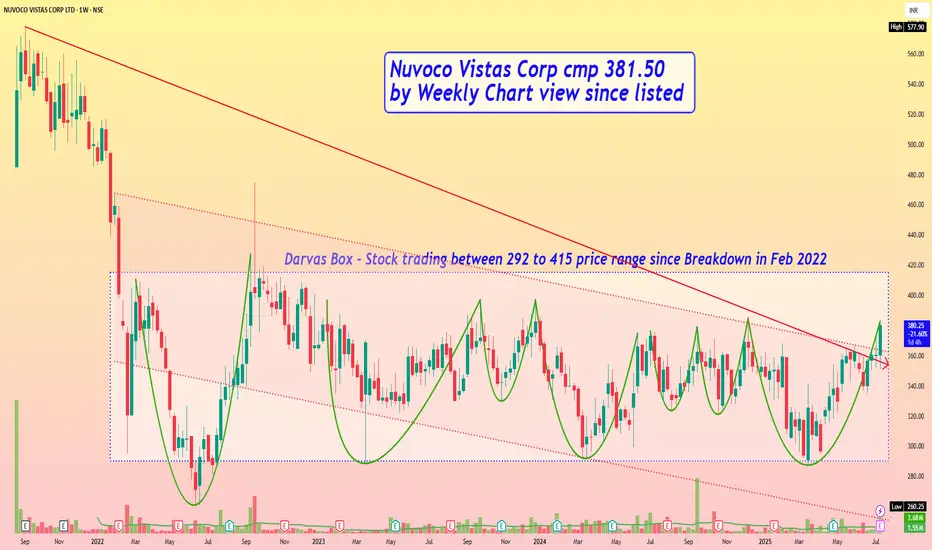
Nuvoco Vistas Corp cmp 381.50 by Weekly Chart view since listedNuvoco Vistas Corp cmp 381.50 by Weekly Chart view since listed
- Support Zone 335 to 355 Price Band
- Resistance Zone 395 to 415 Price Band
- Volumes generated over past few days based on expected good results outcome
- Darvas Box - Stock trading between 292 to 415 price range since Breakdown in Feb 2022
- Multiple Bullish Rounding Bottoms completed within Darvas Box indicative of probable breakout attempted
Vascon Engineers cmp 55.70 by Weekly Chart viewVascon Engineers cmp 55.70 by Weekly Chart view
- Support Zone 49.50 to 53.50 Price Band
- Resistance Zone 49.50 to 53.50 Price Band
- Volumes are getting close to average traded quantity
- Common Technical Indicators BB, EMA, SAR, MACD, RSI indicating positive trend
- Multiple Bullish Technical Chart patterns have emerged on the Daily and Weekly Charts
- Rounding Bottom, Head & Shoulders, Cup & Handle, VCP, as one may observe and interpret
