TechnoFunda Analysis: ASK Automotive Ltd(ASKAUTOLTD)In the ever-evolving automotive landscape, ASK Automotive Ltd stands out as a powerful blend of technical resilience and fundamental strength. With strong operational performance, expanding margins, and rising institutional confidence, the company has emerged as one of India’s leading auto component players specializing in braking systems, aluminum precision parts, and EV-compatible components.
Let’s decode ASK Automotive from both Technical and Fundamental perspectives to assess its investment potential for long-term investors and swing traders alike.
**************Technical Analysis*******************
ASK Automotive is currently in a buy zone, with a favorable risk-reward setup supported by higher timeframe structure. Traders can accumulate near supports with a stop loss below ₹470 for targets up to ₹540–560.
For investors, the current price offers a good entry point for long-term compounding given the synergy between chart strength and business fundamentals.
Trend: Uptrend remains intact across all major timeframes.
Momentum Indicators: RSI is recovering from the 40–45 zone, hinting at renewed bullish momentum.
Volume Action: Rising volume near the 200 EMA suggests smart money accumulation.
Short-Term View: A decisive close above ₹500 could lead to a near-term rally towards ₹540–560.
Medium-Term View: Sustained trading above ₹560 may open the path toward ₹600+ in the coming months.
**************Fundamental Analysis***************
1. Company Overview
Incorporated in 1988, ASK Automotive Ltd is one of India’s largest manufacturers of Advanced Braking Systems, supplying critical friction and safety components to leading two-wheeler and four-wheeler OEMs such as Hero MotoCorp, Honda, Suzuki, TVS, Bajaj, and Royal Enfield.
The company has diversified into lightweight aluminum precision solutions and EV-compatible products, making it a forward-looking player in India’s auto ancillary space.
2. Industry Analysis
India’s auto component industry is projected to grow at a CAGR of 10–12% over the next 5 years, driven by:
Increasing domestic vehicle production
Strong aftermarket demand
Rapid adoption of EVs and hybrid vehicles
Export opportunities due to global supply chain realignments
Within this context, ASK Automotive’s leadership in braking and aluminum lightweighting places it at the core of this structural growth story. With its 50% market share in 2W braking systems, it stands to benefit significantly from the 2W and EV upcycle.
3. Economic Conditions
The broader Indian economy provides a supportive backdrop:
GDP growth above 7% ensuring stable demand
Falling input inflation, aiding margin expansion
Government PLI schemes promoting domestic manufacturing
EV policy tailwinds, increasing OEM collaboration opportunities
Thus, macroeconomic conditions currently favor sustained growth in the auto ancillary sector.
4. Qualitative Analysis
Strengths:
Market leader with 50% share in the 2W braking system segment
Diversified product portfolio: braking, aluminum, safety cables, and EV components
Strong OEM relationships ensuring steady order flow
17 manufacturing facilities across India + 1 JV
Strategic partnerships with AISIN (Japan), LIOHO (Taiwan), and FRAS-LE (Brazil)
Focused R&D investments in EV and lightweight solutions
Weaknesses / Risks:
Heavy dependence on the two-wheeler segment (76% of OEM revenue)
High P/E valuation limits near-term upside
Raw material cost volatility could impact margins
Export contribution (5%) remains relatively small
5. Quantitative Analysis
Compounded Growth Ratios:
Sales CAGR (3Y): 21%
Profit CAGR (3Y): 44%
ROE (Last Year): 27%
Stock Price CAGR (1Y): 17%
ASK Automotive’s growth trajectory reflects consistent expansion in both topline and bottom-line metrics, alongside superior capital efficiency.
6. Past, Present & Future Growth Outlook
Past (FY19–FY21):
The company faced headwinds due to an industry slowdown and pandemic impact. Sales fell marginally but profitability remained intact, proving operational resilience.
Present (FY22–FY25):
Strong recovery phase driven by OEM revival, export traction, and margin expansion. FY25 saw record revenue of ₹3,630 Cr with 12% OPM and 27% ROE — its best performance yet.
Future (FY26–FY28):
ASK Automotive’s focus on EV-compatible lightweighting, thermal management systems, and global JVs positions it for 15–18% CAGR growth.
The upcoming Bengaluru plant (₹200 Cr capex) and 9.9 MW solar facility are expected to boost both capacity and sustainability credentials.
ASK Automotive represents a rare blend of technical strength, financial soundness, and industry leadership. With a clear growth trajectory, expanding institutional interest, and consistent operational excellence, it holds the potential to become one of India’s top-performing auto ancillary stocks in the coming decade.
Technofunda

Breaking Out of Falling Wedge and Symmetrical TriangleNSE:SYRMA is breaking out of Falling Wedge and Symmetrical Triangle Breakout on Weekly TF. With 2nd Best Weekly Volumes.
NSE:SYRMA is a Chennai-based engineering and design company engaged in electronics manufacturing services (EMS). The company provides integrated services and solutions to original equipment manufacturers (OEMs) from the initial product concept stage to volume production through concept co-creation and product realization.
Recently it posted good Q2 FY 24-25 Results, posting a 30% Y/Y rise in Q2 consol profit after tax. The auto and healthcare businesses led growth in Q2 and will drive future growth further ahead. Also, expect a recovery in margins fuelled by higher exports and design and manufacturing businesses. NSE:SYRMA faces margin challenges as the consumer segment, which comprises 35%—38% of topline, operates with lower margins, and they are aiming to lower the segment's share further.
One can wait for a retracement or ride the momentum with the current week candle as stop loss.
🙋♀️🙋♂️If you have any questions about this stock, feel free to reach out to me.
📌Thank you for exploring my idea! I hope you found it valuable.
🙏FLLOW for more
👍BOOST if useful
✍️COMMENT Below your views.
Meanwhile, check out my other stock ideas below until this trade is activated. I would love your feedback.
Disclaimer: This analysis is intended solely for informational and educational purposes and should not be interpreted as financial advice. It is advisable to consult a qualified financial advisor or conduct thorough research before making investment decisions.

CHENNAI PETRO-BLEND OF TECHNOFUNDABuy CHENNAI PETRO 680 TILL 610 FOR target of 740 and 850. Classic blend of fundamental a technical analysis. Bullish flag and inverse head & shoulder breakout happening at 630 levels.
Also available near P to B/V with dividend yield above 8%.
view invalid below 580.
Hikal Ltd. - Base Breakout above 412#Hikal Ltd. Base Breakout on sustained close above 412. CMP 403.85.
Resistance at 477/544/667 for expected level of life high 742 & beyond. Long Term Trade. View negated below 365. Q2 FY25 EBITDA Margin improved on YoY & QoQ basis released on 12/Nov/24. Management needs to deliver in future as per the investor presentation.
#TMPV #StockInvesting #ChemicalSector #PharmaSector #AgroChemical #TechnoFunda #SmartEye

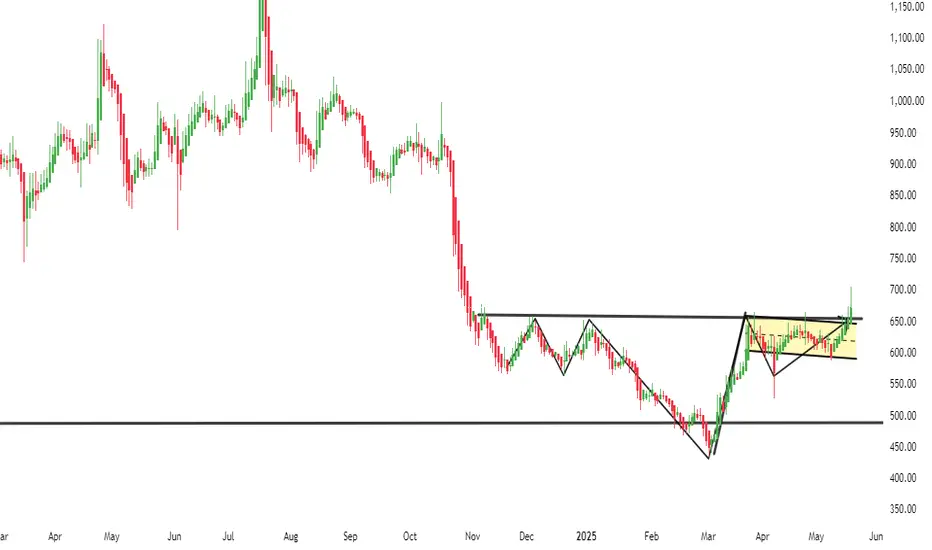
Sterlite Tech: From Despair to Breakout – A Textbook Turnaround NSE:STLTECH : From Despair to Breakout – A Textbook Turnaround Story in the Making. It makes it to my chart of the week Idea after breaking out with good volumes.
Price Action Analysis:
-Recent Action: Strong green candle with significant body suggesting institutional accumulation
-Candle Structure: Minimal upper shadow indicates buying pressure throughout the session
-Previous Action: Series of consolidation candles around ₹85-95 showing accumulation phase
-Breakout Candle: Wide-range bar breaking above downtrend resistance with conviction
Price Swing Analysis:
-Higher Highs/Higher Lows: Recent price action shows initial signs of trend reversal
-Momentum Shift: Price moving from range-bound to trending behaviour
-Gap Analysis: No significant gaps visible, suggesting organic price discovery
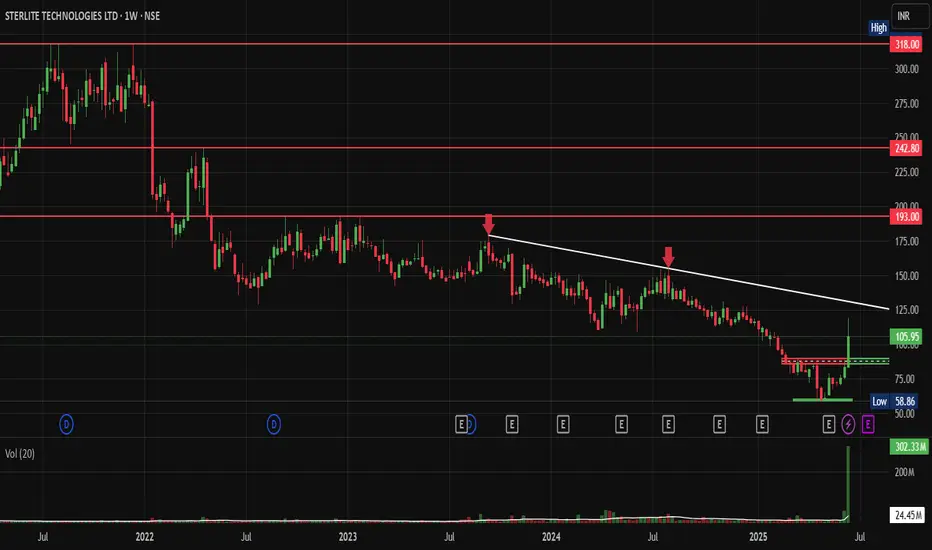
Volume Spread Analysis (VSA):
Current Weekly Bar Analysis:
-Volume: 302.33M (Exceptionally high - 12x average volume)
-Spread: Wide range bar with substantial price movement
-Close Position: Closing in the upper 75% of the range
-VSA Interpretation: Professional Money Accumulation - High volume with wide spread and strong close
Volume-Price Relationship Breakdown:
Phase 1 (2022-2023): Distribution & Selling Climax
-High volume on down bars during the initial decline
-Volume spikes coinciding with major price drops
-Classic distribution pattern with professional selling
Phase 2 (2023-2024): Accumulation Phase
-No Supply Bars: Low volume on down bars indicates selling exhaustion
-Testing for Supply: Multiple tests of the ₹50-60 zone with reducing volume
-Background Volume: Consistently low volume, suggesting minimal selling pressure
Phase 3 (Late 2024-2025): Mark-up Beginning
-Effort vs Result: Increasing volume with improving price action
-Spring Action: False break below support, followed by quick recovery
-Current Bar: Classic "Upthrust After Accumulation" with massive volume
Volume Spread Analysis Summary:
Key VSA Signals Identified:
-Selling Climax: Evident in 2022 with high volume and wide down bars
-No Supply: Consistent pattern during 2023-2024 base formation
-Spring/Shakeout: Brief dip below ₹58 with immediate recovery
-Effort to Rise: Current massive volume surge on breakout attempt
-Professional Interest: Volume pattern suggests smart money accumulation
Chart Structure Breakdown:
-Base Formation: Classic Multi-Year Cup Base spanning approximately 3 years (2022-2025)
-Base Duration & Depth: 36+ months with a devastating 85% decline from peak (₹318 to ₹50 lows)
Volume Characteristics:
- Volume dried up significantly during the base formation phase
- Massive volume surge (302.33M vs 24.45M average) accompanying the recent breakout attempt
- Classic accumulation pattern with low volume during decline and high volume on breakout
Key Levels:
Support Levels:
- Primary Support: ₹58-60 (recent low and base formation floor)
- Secondary Support: ₹75-80 (previous resistance turned support)
Resistance Levels:
- Immediate Resistance: ₹125-130 (downtrend line resistance)
- Major Resistance: ₹193-200 (previous significant level)
- Ultimate Resistance: ₹242-250 (prior consolidation zone)
- Breakout Zone: ₹108-112 (current breakout level with volume confirmation)
Price Patterns:
-Primary Pattern: Multi-year Cup Base with potential Handle formation
-Current Action: Breakout from 3-year downtrend line with explosive volume
-Volume Confirmation: 12x volume surge validates the breakout authenticity
-Pattern Reliability: High probability setup given the extended base duration and volume characteristics
Trade Setup:
Entry Strategy:
Primary Entry: ₹110-112 on sustained breakout with volume above 50M
Add-on Entry: ₹115-118 on momentum continuation or successful retest of breakout zone
Early Entry: ₹105-107 for aggressive traders betting on breakout confirmation
Exit Strategy:
Initial Target: ₹140-145 (measured move from base depth)
Secondary Target: ₹175-180 (intermediate resistance zone)
Ultimate Target: ₹200+ (major resistance retest)
Trail SL: Use a 20% trailing stop once the initial target is achieved
Stop-Loss and Risk Management:
Ideal Stop-Loss: ₹95-98 (below breakout zone invalidation)
Conservative SL: ₹88-90 (below recent swing low with buffer)
Position Sizing: Risk 1.5-2% of portfolio capital given the high-conviction setup
Risk-Reward: Attractive 1:3 to 1:4 ratio to initial targets
Sectoral and Fundamental Backdrop:
Sector Outlook:
Sector: Telecom Infrastructure & Optical Fiber - benefiting from 5G rollout momentum
Relative Strength: Telecom capex cycle turning positive with the government's digital infrastructure push
Peer Performance: Optical fiber and telecom equipment stocks showing renewed interest
Stock Fundamentals:
Business Turnaround: The Company has been restructuring operations and reducing its debt burden
Growth Catalyst: 5G infrastructure deployment and the government's Digital India initiatives provide tailwinds
Financial Health: Improving operational efficiency, though still in recovery phase
Technical-Fundamental Alignment: Multi-year base formation coincides with business restructuring completion
Overall Trade Summary:
Reward-to-Risk Ratio: 3.5:1 to initial target, extending to 5:1+ for swing targets
Conviction Level: High- Textbook cup base with volume confirmation.
Ideal Trader Profile:
- Swing Traders: 4-8 week holding period for initial targets
- Positional Traders: 6-12 month horizon for major resistance retest
- Momentum Players: Quick 15-20% moves on breakout continuation
Key Insight: "After 3 years of pain, Sterlite Tech is displaying all the hallmarks of a classic turnaround story - the kind that can deliver multi-bagger returns for patient capital."
Key VSA Insight: "The 12x volume surge represents the moment when smart money stops accumulating and starts marking up - a classic VSA signal for trend initiation."
My Take:
Trade Thesis: This represents a high-probability, low-risk entry into a fundamentally improving story at a technically optimal juncture. The combination of multi-year base, volume breakout, and sector tailwinds creates a compelling risk-adjusted opportunity.
Keep in the Watchlist.
NO RECO. For Buy/Sell.
📌Thank you for exploring my idea! I hope you found it valuable.
🙏FOLLOW for more
👍BOOST if you found it useful.
✍️COMMENT below with your views.
Meanwhile, check out my other stock ideas on the right side until this trade is activated. I would love your feedback.
Disclaimer: "I am not a SEBI REGISTERED RESEARCH ANALYST AND INVESTMENT ADVISER."
This analysis is intended solely for informational and educational purposes and should not be interpreted as financial advice. It is advisable to consult a qualified financial advisor or conduct thorough research before making investment decisions.
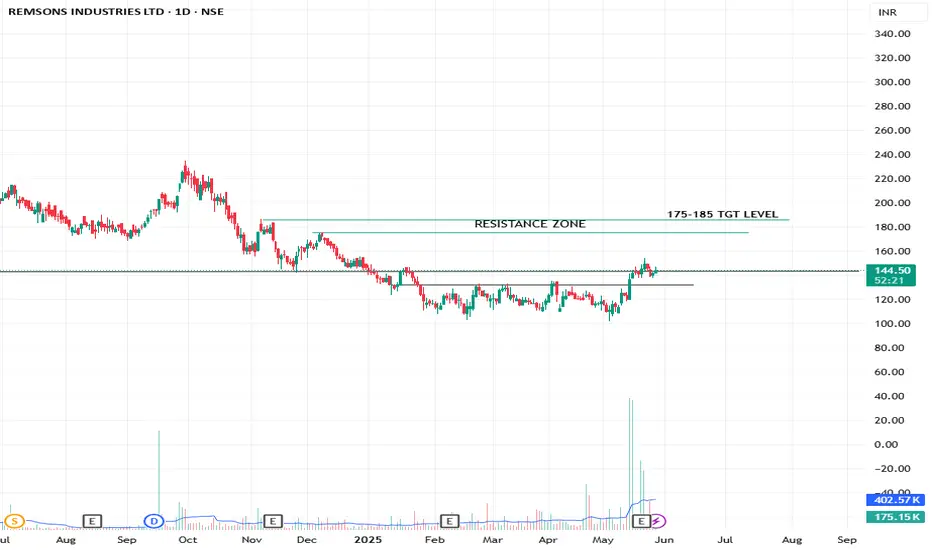
SWING/POSITIONAL PICKREMSONS INDUSTRIES LTD
TECHNICAL VIEW
Stock is shift the range and consoilidate near resistance or breakout zone. Buy 140-145 for 175-185 TGT, sl near 130 at closing basis..
FUNDAMENTAL VIEW
Quarterly/Yearly EBITDA & PAT Both Are Highest In History. ROE & ROCE Is Also Good.
I Am Not SEBI Registered Research Analyst. It Is Giving Only Educational Purpose. Trade In REMSONSIND After Discussing With Your Financial Advisor.
DEEPAKFERT Showing Strength From Base With Good Q3NSE:DEEPAKFERT showed strength today bouncing from a good base on the back of good Q3 Results, with RSI and MACD Showing Strength.
Q3 consolidated net profit jumped more than four times Y/Y, while revenue from operations climbed 39% Y/Y. Management says revenue from its crop protection business rose 55% due to good monsoon. Its profit margin also expanded to 10% from 3% a year ago. REVENUE FROM OPERATIONS 25.79 BILLION RUPEES, NET PROFIT 2.51 BILLION RUPEES.
Trade Setup:
It can be a Good 1:2 RISK-REWARD Trade with the recent being base being crucial.
Target(Take Profit):
52wh Levels for Swing Trader and 1522 for Positional Trader.
Stop-Loss:
Entry Candle Low For Swing Trader and a Recent Base of 1071 for Positional Trader.
📌Thank you for exploring my idea! I hope you found it valuable.
🙏FLLOW for more
👍BOOST if useful
✍️COMMENT Below your views.
Meanwhile, check out my other stock ideas below until this trade is activated. I would love your feedback.
Disclaimer: This analysis is intended solely for informational and educational purposes and should not be interpreted as financial advice. It is advisable to consult a qualified financial advisor or conduct thorough research before making investment decisions.

Beautiful Price Action With Good Q2 Numbers.NSE:BANCOINDIA Posted Good Q2 Numbers for FY 24-25 with Margin Expansion. It manufactures and supplies engine cooling modules and systems for automotive and industrial applications in domestic and international markets.
Results Snapshot:
QoQ Sales: 11.3 %
QoQ Profits: 102 %
YoY Sales: 23.5 %
YoY Profits: 110 %
OPM%: 23%
Currently Trading at 17.4 times P/E. with Book Values/Share of 4.72.
🙋♀️🙋♂️If you have any questions about this stock, feel free to reach out to me.
📌Thank you for exploring my idea! I hope you found it valuable.
🙏FLLOW for more
👍BOOST if useful
✍️COMMENT Below your views.
Meanwhile, check out my other stock ideas below until this trade is activated. I would love your feedback.
Disclaimer: This analysis is intended solely for informational and educational purposes and should not be interpreted as financial advice. It is advisable to consult a qualified financial advisor or conduct thorough research before making investment decisions.

Took Support From Major Levels and Broke Swing High.NSE:CCL Today Broke Swing Highs With Heavy Volumes on Back of Excellent Q2 FY 24-25 Results, after taking support from key levels.
On a YoY basis, EBITDA and PBT grew by 24% and 25% to ₹138 crore and ₹87 crore, respectively during the quarter. Rising volumes and value-accretive businesses largely drove the growth in EBITDA. Going ahead, they expect EBITDA growth to be largely driven by volume growth and not margin improvements from a long-term perspective.
NSE:CCL is engaged in coffee production, trading and distribution. The company's business operations are mainly in India, Vietnam, and Switzerland.
🙋♀️🙋♂️If you have any questions about this stock, feel free to reach out to me.
📌Thank you for exploring my idea! I hope you found it valuable.
🙏FLLOW for more
👍BOOST if useful
✍️COMMENT Below your views.
Meanwhile, check out my other stock ideas below until this trade is activated. I would love your feedback.
Disclaimer: This analysis is intended solely for informational and educational purposes and should not be interpreted as financial advice. It is advisable to consult a qualified financial advisor or conduct thorough research before making investment decisions.

Flag and Pole Pattern with 20 WEMA SetupNSE:TORNTPHARM has made a Pole and Flag Pattern on a Weekly Timeframe with 20 WEMA on the lower edge of the flag.
If a Bullish flag pattern Breaks Out above 3600, the stock may move toward the pattern target after the breakout which is 4560. Keep a Stop Loss of 3250.
NSE:TORNTPHARM is a leading Indian Pharmaceutical Company engaged in the research, development, manufacturing and marketing of generic pharmaceutical formulations, and gave a good Q2 FY 24-25 Resluts Recently.
🙋♀️🙋♂️If you have any questions about this stock, feel free to reach out to me.
📌Thank you for exploring my idea! I hope you found it valuable.
🙏FLLOW for more
👍BOOST if useful
✍️COMMENT Below your views.
Meanwhile, check out my other stock ideas below until this trade is activated. I would love your feedback.
Disclaimer: This analysis is intended solely for informational and educational purposes and should not be interpreted as financial advice. It is advisable to consult a qualified financial advisor or conduct thorough research before making investment decisions.

About to Break Key LevelsNSE:TATACONSUM about to break key levels with nearing completion of a cup and handle chart pattern on Daily time frame, Good Accumulation Seen from July to Sep. 2024 around Post Rights Issue to Acquire two companies Capital Foods (Ching's) and Organic India to strengthen their product portfolio further. 1154-1168 Will be a Good Zone to add or wait for the breakout of 1255 Levels.
Disclaimer: This analysis is intended solely for informational and educational purposes and should not be interpreted as financial advice. It is advisable to consult a qualified financial advisor or conduct thorough research before making investment decisions.

Bouncing Back from Accumulation ZoneNSE:MAHABANK after a long time came back to the Accumulation Zone and now bouncing back with a King Candle and Good Volume, The longer-term trend stays intact, fundamentally a stable PSU Bank. Keep in Radar.
Disclaimer: This analysis is intended solely for informational and educational purposes and should not be interpreted as financial advice. It is advisable to consult a qualified financial advisor or conduct thorough research before making investment decisions.

Change of Polarity With Good Q2 Results.NSE:JUSTDIAL on Weekly Timeframe Changed its Polarity (Resistance acting as Support),
After giving a Breakout and retesting it, it Accumulated in the 512-576 Range. Now, With Good Q2 FY 24-25 Results, it looks good for positional Techno-Funda Trade above 1400 Levels on the Weekly Timeframe.
NSE:JUSTDIAL is the market leader in the local search engine segment in India. The Company provides local search-related services to users across India in a platform-agnostic manner. The multi-platform offering includes an App (Android, iOS), a mobile website, a desktop /PC, voice, and text.
Check out my other stock ideas below until this trade gets activated, I would love your feedback.
Disclaimer: This analysis is intended solely for informational and educational purposes and should not be interpreted as financial advice. It is advisable to consult a qualified financial advisor or conduct thorough research before making investment decisions.

ARW Tachno-Funda CallNSE:ANANDRATHI is about to breakout Major Resistance after a good consolidation of over 8 Months. Today it Posted its Q2 FY 24-25 Results which were astonishing. It is an AMFI-registered mutual fund distributor and is one of the leading non-bank wealth solutions firms in India, being ranked amongst the top three non-bank mutual fund distributors in the country. It offers a wide product portfolio of wealth solutions, financial product distribution, and technology solutions to its clients.
For Swing Traders: Enter after it Breakouts above 4300 Levels With a Good Price and Volume Candle.
For Positional Traders: You can Accumulate it if it comes back to the Accumulation Zone or Near 200EMA.
For Investors: You Can SIP, Going all in at this Valuation is a bit Risky.
Check out my other stock ideas below until this trade gets activated, I would love your feedback.
Disclaimer: This analysis is intended solely for informational and educational purposes and should not be interpreted as financial advice. It is advisable to consult a qualified financial advisor or conduct thorough research before making investment decisions.

OM Infra LTD. Retesting a Multi Decadal ResistanceHere on the chart you can observe a few things :
- Previous resistance of almost 20 years became support for the stock.
- It broke previous resistance of 160 after taking sometime & now retesting the same (Concept of polarity)
- Whenever a stock breaks its multi decadal resistance, highly likely that can become a multi-bagger stock!!
- A fundamentally reasonable valuation company.
- Sectoral tailwinds in the sector in which company operates.
Risk :
- Dependent on Govt. orders.
- Competition from Big players like JSW, TATA, Torrent Power.

Special Situation Pick - Aavas Financiers Ltd. (Open Offer)- A Techno - Funda pick for medium to long term with a risk (stoploss) of 7% from CMP i.e., 1766(Open offer price).
- Technically a Stage 2 stock with a double bottom (more likely that this will work)
- With Fed rate cuts RBI likely to cut rates as well, Affordable housing finance companies likely to benefit from rate cuts as it will decrease cost of borrowing for them.
- Fundamentally also a cheap valuation company compared to peers.
- A company with a solid management track record.
# Just for information purpose. Please DYDD. Happy Trading Readers!

Neogen Chemicals LtdNeogen Chemicals Ltd
Neogen Chemicals Ltd, incorporated in 1991, manufactures bromine and lithium-based organic and organo-metallic compounds, used in the pharmaceutical, agricultural chemicals, and engineering industries.
Market Cap₹ 6,166 Cr. Current Price ₹ 2,337
ROCE9.38 % ROE5.74 %
Profit Var 3Yrs4.40 % Sales growth 3Years27.1 %
GREAT COMPANY WITH STRONG FUNDAMENTAS.

Aarti Surfactants LtdAarti Surfactants Ltd
Incorporated in 2018, Aarti Surfactants
Ltd is in the business of Home and personal care ingredients
Fundamentals:
Market Cap₹ 719 Cr. Current Price₹ 850
ROCE14.8 % ROE11.5 %
Profit Var 3Yrs0.96 % Sales growth 3Years8.19 %
Note: I am not SEBI registered financial Adviser. I solely present my views on chart .I do not charge any kind of service. This is not buy sell recommendation.
If you like my ideas than like boost and follow me for more ideas.
Thanks and comment freely

Cartrade Tech Ltd | momentum stockCartrade Tech Ltd
CarTrade Tech Ltd is a multi-channel auto platform provider company with coverage and presence across vehicle types and Value Added Services. The company operates various brands such as CarWale, CarTrade, Shriram Automall, BikeWale, CarTradeExchange, Adroit Auto, and AutoBiz.
fundamentals :great
Market Cap₹ 4,707 Cr. Current Price₹ 995
ROCE 4.20 % ROE 0.42 %
Debt to equity 0.05
Profit Var 3Yrs -54.6 % Sales growth 3Years 25.2 %
great momentum achieve recently . keep eye on chart.
debt free company. every quarter FII AND DII increase hold.
Note: I am not SEBI registered financial Adviser. I solely present my views on chart .I do not charge any kind of service. This is not buy sell recommendation.
If you like my ideas than like boost and follow me for more ideas.
Thanks and comment freely

Campus Activewear LtdCampus Activewear Ltd
was incorporated on September 24, 2008, and is one of India’s largest sports and athleisure footwear brands in terms of value and volume. The company manufactures and distributes a variety of footwear like Running Shoes, Walking Shoes, Casual Shoes, Floaters, Slippers, Flip Flops, and Sandals, available in multiple colors, styles, and at affordable prices.
FUNDAMENTALS :GREAT .NOW VALUATION IS ALSO RESONABLE.
Market Cap₹ 10,913 Cr. Current Price₹ 357
ROCE 16.7 % ROE14.9 %
Profit Var 3Yrs 49.5 % Sales growth 3Years26.8 % Promoter holding 73.9 %
as per chart reading there is huge volume came in this month and momentum also in positive zone.
Note: I am not SEBI registered financial Adviser. I solely present my views on chart .I do not charge any kind of service. This is not buy sell recommendation.
If you like my ideas than like boost and follow me for more ideas.
Thanks and comment freely

AEROFLEX INDUSTRIESHi, Aeroflex a subsidiary of SAT Industries has given breakout of rounding bottom pattern with high volumes and high momentum. The current candle looks like a marobozu formed at all the time high. Looks like a good breakout.

TECHNOFUNDA STOCK: ZENSARZENSAR making higher highs where NIFTY IT index is struggling. Good ROE/ROI with PE ratio comfortable at 22, one of lowest in industry. Net profit doubled from last year.
Technichal rebound from 200EMA and gradually trading at all time highs.
Buy for target of 810 to 1020 in medium to long term. Technical stop around 555 on weekly closing basis

HGInfra-DO NOT MISS!HG Infra is a techno-fundamental pick shared from infra sector.
Stock is available at a PE of around 10 and ROE, ROCE>25%.
Sales growth in 5 years is above 27% which is phenomenal
Technical Logic: -Stock is retesting previous breakout. Currently, small rejection is seen from demand zone. If a good candle closes above 890, stock can start upward journey with levels mentioned in chart.
Keep in watchlist.
Do follow me if you like my analysis for more such ideas:)
